BTC Breakdown Confirmed? High Probability Short Trade Setup | 4HBitcoin has broken below a key support zone and is currently retesting the breakdown area. The marked zone acts as a strong resistance, increasing the probability of bearish continuation.
📌 Entry: Retest of resistance zone
🎯 Target: 59,294
🛑 Stop Loss: 62,973
📊 Risk/Reward: Favorable bearish setup
This idea is for educational purposes only. Always use proper risk management and wait for confirmation before entering a trade.
⚠️ Trade the setup, not the prediction. Risk management is everything.
IMPORTANT LINE
“This setup is based on strong supply zone reaction, not a blind entry — confirmation is key.”
DISCLAIMER:We will not be held responsible for any loss you incur
CRYPTO:BTCUSD
Moving Averages
EMA Downtrend, Waiting for Fibonacci Sell EntryFundamental Analysis
Gold remains under bearish pressure as price continues to trade below the main EMA structure. Traders are still watching USD momentum, Treasury yields, and upcoming U.S. macro data.
For now, the technical structure still favours sellers while recovery attempts remain weak below the EMA resistance zone.
Technical Analysis
On the 1H chart, XAUUSD is trading below EMA 34, EMA 89, and EMA 200. The EMA structure is still pointing downward, confirming that the main trend remains bearish.
Price recently created a doji candle near the lower area around 4,060 - 4,070, showing short-term hesitation after the sell-off. However, this doji is not enough to confirm a bullish reversal while price remains below the EMA trend.
The key sell entry zone is around 4,109 - 4,117. This area aligns with the Fibonacci retracement zone, broken structure, and EMA resistance pressure. If price pulls back into this zone and rejects, the bearish continuation setup becomes cleaner.
The main downside target is around 3,989, which aligns with the Fibonacci extension area and lower liquidity zone on the chart.
Important Key Levels
Current price area: 4,064
Fibonacci sell entry zone: 4,109 - 4,117
EMA resistance area: 4,123 - 4,170
Short-term resistance: 4,086
Bearish continuation level: 4,073 - 4,064
Main Fibonacci target: 3,989
Invalidation area: above 4,146
Trading Scenario
Main Sell Scenario
Entry: 4,109 - 4,117
Stop Loss: 4,146
Take Profit 1: 4,086
Take Profit 2: 4,034
Take Profit 3: 3,989
Sell Condition
The preferred setup is to wait for gold to pull back into the 4,109 - 4,117 Fibonacci sell entry zone. This area is important because it aligns with the EMA downtrend and the previous broken structure.
A sell setup becomes more valid if price forms bearish rejection from this zone, such as a long upper wick, bearish engulfing candle, failed breakout, or lower high below the EMA range.
If price rejects from the sell zone and breaks below 4,064 again, the bearish continuation view becomes stronger. The next downside focus would be 4,034, followed by the Fibonacci extension target around 3,989.
Entry Conditions
Wait for price to retest 4,109 - 4,117.
Look for bearish rejection before entering sell.
A break below 4,064 confirms stronger downside pressure.
If price breaks and holds above 4,146, the sell setup is invalid.
Overall, the main view remains bearish while XAUUSD trades below EMA 34, EMA 89, and EMA 200. The preferred plan is to wait for a pullback into the Fibonacci sell entry zone, then look for sell confirmation toward 4,034 and 3,989.
Do you share the same bearish view on gold, or are you waiting for a cleaner rejection from the Fibonacci sell zone?
Wheels India (WHEELS)Monitoring the ongoing correction following a strong impulsive advance from the January lows.
Price is now approaching a technically important Top-bottom support zone, making the current structure worth tracking over the coming sessions.
The quality of the next reaction should provide useful information regarding the strength of the prevailing trend and the maturity of the correction.
Disclaimer: Views shared are for educational purposes only and do not constitute investment advice.
XAUUSD H4 — EMA Bearish TrendXAUUSD — EMA Bearish Trend, Two Sell Zones Toward Fibonacci Liquidity Target
Fundamental Analysis
Gold remains under bearish pressure as price continues to trade below the main EMA structure. The market is still watching USD strength, Treasury yields, and upcoming U.S. data, which may create volatility around key Fibonacci and liquidity zones.
For next week, the main view remains bearish while recovery attempts stay below the EMA resistance area.
Technical Analysis
On the 4H chart, XAUUSD is still trading below EMA 34, EMA 89, and EMA 200. This confirms that the broader short-term trend remains bearish, with the EMA structure acting as dynamic resistance above price.
Price is currently around 4,155 after a strong bearish move from the upper structure. The chart shows that gold is now reacting near a short-term reaction zone, but the recovery has not yet confirmed a bullish reversal.
The first sell area is around 4,222 - 4,243. This zone aligns with Fibonacci retracement, previous support turned resistance, and short-term liquidity. If price pulls back into this area and rejects, sellers may continue to defend the trend.
The second sell area is higher, around 4,320 - 4,341. This zone is stronger because it aligns with Fibonacci resistance, EMA pressure, and a larger support/resistance liquidity area. If gold retraces deeper into this zone, it may offer another sell opportunity with a wider structure.
The main downside target remains the Fibonacci 1.618 liquidity convergence zone around 4,066 - 4,065.
Important Key Levels
Current price area: 4,155
Reaction zone: 4,170 - 4,180
Sell zone 1: 4,222 - 4,243
Sell zone 2: 4,320 - 4,341
EMA resistance area: 4,254 - 4,320
Liquidity convergence target: 4,066 - 4,065
Invalidation for sell zone 1: above 4,254
Invalidation for sell zone 2: above 4,341
Trading Scenario
Sell Scenario 1 — Fibonacci Support Retest
Entry: 4,222 - 4,243
Stop Loss: 4,254
Take Profit 1: 4,170
Take Profit 2: 4,120
Take Profit 3: 4,066 - 4,065
Sell Condition
The first sell setup is to wait for gold to pull back into 4,222 - 4,243. This area is the nearest Fibonacci and support/resistance retest zone.
A sell setup becomes more valid if price forms bearish rejection from this zone, such as a long upper wick, bearish engulfing candle, failed breakout, or lower high below the EMA structure.
Sell Scenario 2 — Higher Liquidity Sell Zone
Entry: 4,320 - 4,341
Stop Loss: 4,365
Take Profit 1: 4,243
Take Profit 2: 4,170
Take Profit 3: 4,066 - 4,065
Sell Condition
The second sell setup is only considered if gold retraces deeper into 4,320 - 4,341. This is the stronger liquidity and Fibonacci resistance zone on the chart.
A rejection from this area would show that buyers failed to reclaim the EMA resistance zone. If sellers defend this level, the next bearish leg may target 4,243 first, then 4,170 and the Fibonacci 1.618 target around 4,066 - 4,065.
Entry Conditions
Wait for price to retest one of the sell zones.
Look for bearish rejection before entering sell.
Do not sell directly at the low without a pullback.
A break below 4,120 would strengthen the move toward 4,066.
If price breaks and holds above 4,341 - 4,365, the bearish setup should be reassessed.
Overall, the main view remains bearish while XAUUSD trades below EMA 34, EMA 89, and EMA 200. For next week, the preferred plan is to wait for a pullback into 4,222 - 4,243 or 4,320 - 4,341, then look for sell confirmation toward the Fibonacci liquidity convergence target around 4,066 - 4,065.
Do you share the same bearish view on gold for next week, or are you waiting for a cleaner pullback into the higher sell zone first?
XAUUSD — EMA Consolidation Before Bearish Continuation
Fundamental Analysis
Gold remains under short-term pressure as traders continue to watch USD momentum, Treasury yields, and upcoming U.S. macro data.
For now, the recovery has not confirmed a bullish reversal. Price is still reacting around the EMA area, so the current move may be only a short-term consolidation before sellers attempt another push lower.
Technical Analysis
On the 2H chart, XAUUSD is trading around 4,304 after a strong rejection from the upper value range. Price is now consolidating near the EMA 34 and EMA 89 area, showing that the market is pausing before choosing the next direction.
The key zone to watch is 4,301 - 4,320. This area aligns with the Fibonacci retracement zone, volume reaction, and short-term EMA structure. If price fails to hold above this area, sellers may regain control.
The stronger resistance remains around 4,359 - 4,382. As long as gold stays below this value range, the bearish view remains preferred.
If price breaks below the current EMA consolidation zone, the next downside levels are 4,257 and 4,219. A deeper bearish continuation may target the larger convergence support zone around 4,118 - 4,125.
Important Key Levels
Current price area: 4,304
EMA consolidation zone: 4,301 - 4,320
Fibonacci retracement + volume zone: 4,301 - 4,320
Upper value range resistance: 4,359 - 4,382
First downside target: 4,257
Second downside target: 4,219
Major convergence support zone: 4,118 - 4,125
Invalidation area: above 4,382
Trading Scenario
Main Sell Scenario
Entry: 4,301 - 4,320
Stop Loss: 4,382
Take Profit 1: 4,257
Take Profit 2: 4,219
Take Profit 3: 4,118 - 4,125
Sell Condition
The preferred setup is to wait for gold to react around the 4,301 - 4,320 EMA and Fibonacci value zone.
A sell setup becomes more valid if price forms bearish rejection from this zone, such as a long upper wick, bearish engulfing candle, failed breakout, or a lower high below the upper value range.
If price breaks below 4,257 with clear bearish momentum, the next downside focus will be 4,219. Below that, the larger target zone is 4,118 - 4,125.
Entry Conditions
Wait for rejection around 4,301 - 4,320.
Do not sell if price breaks strongly above the value zone.
A move below 4,257 confirms stronger bearish pressure.
If price breaks and holds above 4,382, the sell setup is invalid.
Overall, the main view remains bearish while XAUUSD stays below the upper value range and fails to reclaim stronger resistance. Price may continue to consolidate around the EMA zone in the short term, but if sellers defend 4,301 - 4,320, gold may continue lower toward 4,257, 4,219, and 4,118 - 4,125.
Do you share the same bearish view on gold, or are you waiting for a clearer breakdown below the EMA consolidation zone?
GBPUSD — Sell From EMA Value Zone & Fibonacci Levels
Fundamental Analysis
GBPUSD remains under short-term pressure as traders continue to watch USD strength, U.K. data, and upcoming macro events.
For now, the recovery has not confirmed a bullish reversal. Price is still trading below the key EMA resistance area, so pullbacks into value may continue to offer sell opportunities.
Technical Analysis
On the 2H chart, GBPUSD is trading around 1.3323 after a sharp bearish move from the upper range. Price is currently reacting near the strong support area, but the broader structure still favours sellers while the EMA 34, EMA 89, and EMA 200 remain above price.
The key zone to watch is the EMA value zone around 1.3380 - 1.3395. This area also aligns with the Fibonacci 0.382 retracement and previous broken support. If price pulls back into this zone and rejects, sellers may regain control.
There is also a short-term Fibonacci reaction level around 1.3355 - 1.3363, which can create a scalping sell reaction if price fails to recover strongly.
As long as GBPUSD remains below the EMA value zone, the main bias stays bearish. A rejection from the Fibonacci retracement levels may send price back toward 1.3320, then deeper to 1.3260.
Important Key Levels
Current price area: 1.3323
Strong support area: 1.3315 - 1.3330
Sell scalping zone: 1.3355 - 1.3363
Main EMA value sell zone: 1.3380 - 1.3395
Fibonacci 0.382 value zone: 1.3380 - 1.3395
Upper invalidation area: above 1.3415
First downside target: 1.3315
Main downside target: 1.3260
Trading Scenario
Main Sell Scenario
Entry: 1.3380 - 1.3395
Stop Loss: 1.3415
Take Profit 1: 1.3330
Take Profit 2: 1.3315
Take Profit 3: 1.3260
Sell Condition
The preferred setup is to wait for GBPUSD to pull back into the 1.3380 - 1.3395 EMA value zone. This area is important because it combines EMA resistance, Fibonacci retracement, and previous broken structure.
A sell setup becomes more valid if price forms bearish rejection from this zone, such as a long upper wick, bearish engulfing candle, failed breakout, or lower high formation below the EMA structure.
If price rejects from the value zone and breaks back below 1.3330, bearish pressure may continue toward 1.3315 and 1.3260.
Entry Conditions
Wait for price to retest 1.3380 - 1.3395.
Look for bearish rejection before entering sell.
Do not sell directly at strong support without a pullback.
If price breaks and holds above 1.3415, the sell setup is invalid.
Overall, the main view remains bearish while GBPUSD trades below the EMA value zone. The preferred plan is to wait for a corrective pullback into 1.3380 - 1.3395, then look for sell confirmation toward 1.3330, 1.3315, and 1.3260.
Do you share the same bearish view on GBPUSD, or are you waiting for a cleaner rejection from the EMA value zone?
EURUSD — EMA Bearish Trend, Sell From Value Zone
Fundamental Analysis
EURUSD remains under pressure as the market continues to watch USD momentum, Fed expectations, and upcoming U.S. macro data. If the dollar stays supported, recovery attempts on EURUSD may remain limited.
For next week, the main focus is whether price can retest the value zone above before continuing lower in line with the EMA trend.
Technical Analysis
On the 4H chart, EURUSD is still trading inside a descending channel. EMA 34, EMA 89, and EMA 200 remain above price, showing that the main structure is still bearish.
Price is currently around 1.1565 after reacting from the lower support area. However, this recovery is moving toward the Fibonacci value zone and EMA resistance area near 1.1615.
The main sell zone is around 1.1612 - 1.1627. This area aligns with the 0.382 - 0.5 Fibonacci retracement, EMA resistance, previous broken structure, and liquidity above price.
The key bearish confirmation level is around 1.1500 - 1.1510. If price rejects from the value zone and breaks back below this support, the bearish continuation scenario becomes stronger.
The weekly downside target is the Fibonacci 1.618 extension around 1.1387.
Important Key Levels
Current price area: 1.1565
Main sell zone: 1.1612 - 1.1627
Value zone / Fibonacci area: 1.1612 - 1.1627
Liquidity above: 1.1644 - 1.1646
EMA resistance area: 1.1592 - 1.1646
Key support zone: 1.1500 - 1.1510
Weekly Fibonacci target: 1.1387
Invalidation area: above 1.1646
Trading Scenario
Main Sell Scenario
Entry: 1.1612 - 1.1627
Stop Loss: 1.1646
Take Profit 1: 1.1510
Take Profit 2: 1.1450
Take Profit 3: 1.1387
Sell Condition
The preferred setup is to wait for EURUSD to pull back into the 1.1612 - 1.1627 sell zone. This area is the main value zone on the chart and also aligns with EMA resistance, Fibonacci retracement, and previous broken structure.
A sell setup becomes more valid if price forms bearish rejection from this zone, such as a long upper wick, bearish engulfing candle, failed breakout, or lower high below the EMA structure.
If price rejects from the sell zone and breaks below 1.1500 - 1.1510, the bearish continuation view becomes stronger. The next downside focus would be 1.1450, followed by the weekly Fibonacci target around 1.1387.
Entry Conditions
Wait for price to retest 1.1612 - 1.1627.
Look for bearish rejection before entering sell.
A break below 1.1500 - 1.1510 confirms stronger downside pressure.
If price breaks and holds above 1.1646, the sell setup is invalid.
Overall, the main view for next week remains bearish while EURUSD trades below the EMA structure and inside the descending channel. The preferred plan is to wait for a pullback into the Fibonacci value zone, then look for sell confirmation toward 1.1510, 1.1450, and the weekly Fibonacci target at 1.1387.
Do you share the same bearish view on EURUSD, or are you waiting for a cleaner rejection from the 1.1615 value zone first?
Time to Buy TCS? DCF valuation Check.Hey Folks,
I'like to have your attention on the tech giant Tata Consultancy Services Ltd.
After taking a huge correction over past year.
I am observing the price has finally landed in a very comforting support zone. 0.78 level according to my fib retracement placement. and hanging ~200 points above the price-action based support level.
I am Considering fib support with more weightage, with price trailing well below 50EMA as well.
So if not a trend reversal i am looking for the price to take support from here to move to 0.61 Fib lvl or 50EMA.
Now looking at the current DCF method of valuation, which i generated with help of an AI agent, with the following assumptions(adjusted with Indian trends) -
Revenue CAGR( FY27-31) : 6%
EBIT margin : 25%
Discount rate : 8%
Terminal growth rate : 2%
We are getting the DCF fair value of ₹2880, ~32% upside.
Another thing is, the Company DY has been 5.1% in FY26( ₹109/share+₹31special). which has been one of the most attractive yield in the market.
So, I believe the stock is cheap for adding in the portfolio to also have a good dividend returns in long term. but still if AI deflation compresses margins to 21% with revenue CAGR 2-3% a further Bear case is to be considered with ₹1900 as target.
Thanks, Happy Investing.
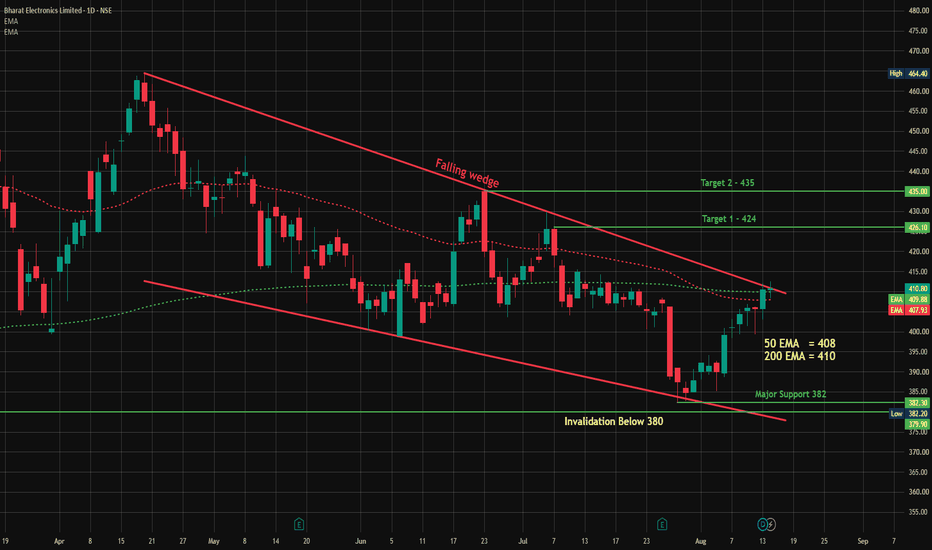
Investment Stock Analysis - BHEL Strong BuyTechnical Aanalysis
After making HH in July 24. Stock came to Prev Breakout Levels to Retest
and currently in Accumulation before making fresh Higher High.
1) Inverted Head & SHoulder in formation. Pattern will be active when Strong closing above 261. Inactive if Closes below 179.
2) Currently within falling wedge resistance. Confirmative entry will be above candle closing above 264.
3) Multiple and Confirmed Patterns on Weekly and Monthly Charts
4) Hidden Divergence formed in a weekly Tf, confirm Trend Conformation towards prev high and Fresh Higher High.
4) Strong candidate to hold for Better returns on Short to Long term Investment.
Disclaimer: Views shared are for Educational purpose only. Initiate your own analysis before taking any trades.
XAUUSD — EMA Bearish Trend, Sell From Fibonacci Value Zone
Fundamental Analysis
Gold remains under bearish pressure as the market focuses on key USD events this week, including the Federal Funds Rate, FOMC Economic Projections, FOMC Statement, and the FOMC Press Conference.
These events may create strong volatility for XAUUSD. If the Fed tone supports USD strength or keeps rate expectations tight, gold may continue to face selling pressure on recovery attempts.
Technical Analysis
On the 4H chart, XAUUSD is still moving inside a descending channel. EMA 34, EMA 89, and EMA 200 remain above price, confirming that the main trend is still bearish.
Price is currently trading around 4,218 after a short-term recovery from the lower area. However, this bounce is moving toward the Fibonacci value zone and EMA resistance area around 4,240 - 4,280.
This zone is important because it aligns with the 0.236 - 0.382 Fibonacci retracement, the EMA range, previous broken structure, and channel pressure. If price rejects from this area, sellers may regain control.
The key bearish confirmation level is 4,170. A clean break below this level would strengthen the downside continuation toward 4,026. If bearish momentum expands further, the weekly goal remains the Fibonacci Extension 1.618 zone around 3,813 - 3,815.
Important Key Levels
Current price area: 4,218
Fibonacci value sell zone: 4,240 - 4,280
EMA sell range: 4,240 - 4,280
Short-term resistance: 4,239 - 4,281
Key bearish confirmation level: 4,170
Reaction support: 4,026
Weekly Fibonacci Extension target: 3,813 - 3,815
Invalidation area: above 4,370
Trading Scenario
Main Sell Scenario
Entry: 4,240 - 4,280
Stop Loss: 4,370
Take Profit 1: 4,170
Take Profit 2: 4,026
Take Profit 3: 3,813 - 3,815
Sell Condition
The preferred setup is to wait for gold to pull back into the 4,240 - 4,280 Fibonacci value zone. This area aligns with the EMA sell range, descending channel pressure, and previous broken structure.
A sell setup becomes more valid if price forms bearish rejection from this zone, such as a long upper wick, bearish engulfing candle, failed breakout, or lower high below the EMA structure.
If price rejects from the sell zone and breaks below 4,170, the bearish continuation view becomes stronger. The next reaction level is 4,026, followed by the weekly Fibonacci Extension target around 3,813 - 3,815.
Entry Conditions
Wait for price to retest 4,240 - 4,280.
Look for bearish rejection before entering sell.
A break below 4,170 confirms stronger bearish pressure.
Be careful with FOMC volatility this week.
If price breaks and holds above 4,370, the sell setup is invalid.
Overall, the main view remains bearish while XAUUSD trades below the EMA structure and inside the descending channel. The preferred plan is to wait for a pullback into the Fibonacci value zone, then look for sell confirmation toward 4,170, 4,026, and the weekly Fibonacci Extension zone around 3,813 - 3,815.
Do you share the same bearish view on gold, or are you waiting for FOMC confirmation before taking a position?
XAUUSD — Sell Below EMA Trend From Liquidity Resistance
Fundamental Analysis
Gold remains under pressure as the market continues to watch USD strength, Treasury yields, and upcoming U.S. data. The current structure still favours sellers while price trades below the main EMA resistance.
For now, any recovery should be treated as a technical pullback unless gold can reclaim the key resistance zone with strong confirmation.
Technical Analysis
On the 1H chart, XAUUSD is still trading below EMA 34, EMA 89, and EMA 200. This shows that the short-term trend remains bearish, with the EMA structure acting as dynamic resistance above price.
Price is also moving inside a descending channel. After the previous bullish reaction from the lower area, gold is now slowing below the EMA zone again, which means sellers may still control the structure.
The key sell area is around 4,249 - 4,283. This zone is important because it combines the previous key support zone, liquidity resistance, and the upper reaction area below EMA pressure. If price retests this area and rejects, the bearish continuation setup becomes cleaner.
Below current price, the next liquidity zone is around 4,055 - 4,065. If sellers break this area, the next downside target may extend toward 4,024 and then 3,953.
Important Key Levels
Current price area: 4,178
Main sell zone: 4,249 - 4,283
Key support turned resistance: 4,249 - 4,283
EMA resistance area: 4,205 - 4,300
Nearest liquidity target: 4,055 - 4,065
Key downside level: 4,024
Extended bearish target: 3,953
Invalidation area: above 4,300
Trading Scenario
Main Sell Scenario
Entry: 4,249 - 4,283
Stop Loss: 4,300
Take Profit 1: 4,055
Take Profit 2: 4,024
Take Profit 3: 3,953
Sell Condition
The preferred setup is to wait for gold to retest the 4,249 - 4,283 resistance zone. This is the main liquidity sell area on the chart and also aligns with the broken support structure.
A sell setup becomes more valid if price forms bearish rejection from this zone, such as a long upper wick, bearish engulfing candle, failed breakout, or lower high below the EMA structure.
If price rejects from the sell zone and breaks below 4,159 - 4,150, the bearish continuation view becomes stronger. The next downside focus would be 4,055 - 4,065, followed by 4,024 and 3,953.
Entry Conditions
Wait for price to retest 4,249 - 4,283.
Look for bearish rejection before entering sell.
Do not sell directly at the lows without a pullback.
If price breaks and holds above 4,300, the sell setup is invalid.
Overall, the main view remains bearish while XAUUSD trades below the EMA structure and inside the descending channel. The preferred plan is to wait for price to retest the 4,249 - 4,283 liquidity resistance zone, then look for sell confirmation toward 4,055, 4,024, and 3,953.
Do you share the same bearish view on gold, or are you waiting for a cleaner retest of the sell zone first?
NBCC: Pattern Breakout and Key LevelsThe stock of NBCC appears to be showing signs of improving strength on the daily chart, supported by a combination of price structure, volume confirmation, and momentum indicators. Recent chart behaviour suggests the possibility of a constructive trend development after the formation of a noteworthy reversal pattern.
On the daily timeframe, the stock has formed an inverted head and shoulders pattern. Price has moved above the neckline zone which is also equilibrium level and the breakout has been accompanied by healthy trading volume, which adds credibility to the pattern and suggests improving market participation.
Another supportive factor is that the stock has managed to close above the 200-day DEMA, a level often used to assess the broader directional trend. Sustaining above this moving average may indicate strengthening medium- to long-term price structure and improving sentiment among market participants. RSI has moved above 65, indicating strengthening bullish momentum.
Key Levels:
Resistance: near ₹123
Support: Around ₹86 ,
Disclaimer: This analysis is intended solely for educational and informational purposes. It does not constitute investment advice or a recommendation to buy, sell, or hold any security. Financial markets involve risk, and individuals should conduct their own research or consult a licensed financial advisor before making any investment decisions.
Aye Finance – Fresh IPO Momentum BreakoutNSE:AYE
Aye Finance has shown a strong breakout from its recent consolidation zone with a sharp price move and strong volume participation. The stock closed near ₹164 with around 10% gain, supported by a visible liquidity rush and elevated relative volume.
Momentum indicators are improving. RSI is in bullish territory, MACD is turning positive with histogram expansion, and relative strength is also improving. Price is trading above key short-term moving averages, indicating trend continuation strength.
As long as the stock holds above the ₹150–₹155 breakout zone, the structure remains positive. A sustained move above ₹166–₹170 can open further upside momentum. Failure to hold the breakout zone may lead to consolidation or retest.
View : Bullish above ₹150–₹155
Breakout zone : ₹150–₹155
Momentum confirmation : Above ₹166–₹170
Risk zone : Below ₹145
Setup : Fresh IPO breakout with volume expansion
This is an observation for educational purpose only, not a buy/sell recommendation.
Billionbrains Garage Ventures: Post-Breakout Consolidation Near NSE:GROWW
Billionbrains Garage Ventures Ltd — Daily Chart Observation
Billionbrains Garage Ventures had a strong breakout move from the ₹160–₹165 base zone and rallied sharply toward the ₹220+ area. After the breakout, the stock has corrected and is now consolidating around ₹185–₹195.
Current observations:
Price is holding near the short-term moving average zone and has shown a bounce from the recent consolidation area. RSI is recovering from the lower range, indicating early momentum improvement. Volume has cooled down after the high-volume selling day, so fresh confirmation is still needed.
Key levels to watch:
Support zone: ₹180–₹185
Immediate resistance: ₹198–₹205
Higher resistance: ₹215–₹227
Invalidation zone: Below ₹178 on closing basis
Setup view:
This looks like a post-breakout pullback / consolidation setup. A strong close above ₹198–₹205 with rising volume can confirm renewed momentum. Until then, it remains a watchlist candidate.
Bias: Watch / Wait for confirmation
Risk: If price fails below ₹180, the setup weakens.
Disclaimer: This is only for educational analysis, not financial advice.
Navin Fluorine International LimitedThe stock is in a strong bullish (upward) trend.
Trendline Support: The price is climbing sharply along an upward trendline. It is currently testing this line as a support level.
Moving Averages: The stock is trading well above its 50, 150, and 200-day Simple Moving Averages. Because the shorter-term average (50 SMA) is above the longer-term ones, it confirms a healthy, long-term uptrend.
RSI Indicator: The RSI is at 63.31, showing positive upward momentum without being unsustainably overbought.
10 day avg delivery vol more than 500%SUDARSHAN CHEMICALS:
10-day average delivery volume has increased by more than 500%, indicating strong accumulation. The weekly candle has broken above the 200DMA, 50 DMA and 20 DMA and is sustaining above the Supertrend.
Historically, whenever the Supertrend turns green, the stock has delivered strong rallies. With rising delivery volumes and bullish price structure, the stock looks ready for a potential breakout move.
NSE Union Bank Enters High-Probability Reversal ZoneUnion Bank of India remains inside a long-term ascending channel on the 4-hour timeframe, showing that the broader trend structure is still positive despite the recent correction.
The price is now trading near an important Fibonacci retracement support zone between 0.5 and 0.382 . Interestingly, the previous bullish cycle also respected the same Fibonacci region before continuing higher, suggesting a possible historical price reaction pattern.
At the same time, the stock is approaching the lower boundary of the ascending channel, creating a strong technical confluence zone. This area may attract buying interest if market sentiment improves.
Expected Targets: 174 - 182 - 196+
However, traders should remain cautious because the recent bearish crossover between the 50 SMA and 200 SMA indicates short-term weakness and reduced momentum compared to the previous bullish phase. Below 140 , the bullish structure may weaken significantly and the ascending channel setup could fail.
ATH Breakout - KTK Bank - karnataka bank🏛️ KTKBANK (1M & 1D): The Language of Multi-Timeframe Alignment
When you look at a dual-frame setup like this, you realize charts don’t just show prices—they tell a story of accumulation, minor corrections, and powerful technical traps.
**Karnataka Bank Limited (KTKBANK)** is printing a classic high-probability setup where the macro monthly trend perfectly validates an aggressive intraday/daily breakout attempt.
🔍 Deciphering the Blueprint:
1. The Macro Picture (Monthly Timeframe - Left)
* **Testing the Ceiling:** The stock has rallied strongly from its 2022 bases and is currently testing a crucial multi-year horizontal resistance ceiling at **₹272.15**.
* **Fibonacci Confluence:** The horizontal level matches beautifully with the $1.0$ Fibonacci retracement marker. A sustained breakout above this structural pivot clears the path for the long-term extension targets.
2. The Micro Catalyst (Daily Timeframe - Right)
* **Dynamic Support Bounce:** Notice how beautifully the daily candles corrected down into the designated demand zone (yellow block between **₹240.86** and the medium-term moving averages).
* **Strong Intraday Reversal:** The stock aggressively bounced straight out of this value zone with a solid **+6.48% daily expansion**, slicing back above the short-term EMA lines to re-test the major line.
* **Momentum Reset:** The daily RSI cooled off down into the oversold zone and has now triggered a sharp bullish crossover, indicating that the weak hands have been shaken out and buyers are taking back control.
#KarnatakaBank #KTKBANK #PriceAction #TechnicalAnalysis #Fibonacci Trading #SwingTrading #IndianStockMarket #BankingStocks #Nifty #TradingView #tamilshare
⚠️ Disclaimer:
*The analysis provided above is strictly for educational and informational purposes only. It does not constitute financial advice, an endorsement, or a solicitation to buy or sell any securities. Trading in the stock market involves substantial risk. Please conduct your own due diligence or consult a certified financial advisor before making any investment decisions.*
Swing Analysis - Balaji Amines
## 📈 BALAMINES (1M): Major Trend Reversal & Breakout Confirmed!
**Balaji Amines Limited** is flashing a massive bullish signal on the monthly (1M) timeframe. After a prolonged corrective phase from its 2021 highs, the stock has completed a textbook multi-year rounding structure/falling wedge and is breaking out from a critical juncture.
### 🔍 Key Technical Observations:
* **The Breakout Point:** The stock has forcefully breached the downward trendline that has capped prices for years. It is currently sitting precisely at a **Critical Breakout & Trend Reversal Point at ₹1,833.30**.
* **Moving Average Convergence:** Price action is surging above key short-to-medium-term moving averages (blue and red lines), confirming strong bullish momentum and a structural shift from "sell on rallies" to "buy on dips."
* **Stochastic RSI Shift:** Looking at the bottom oscillator, the momentum indicator has successfully hooked up from the oversold territory and is crossing above the 50-level line, signaling that the bulls are firmly back in control.
---
### 🎯 Key Targets & Price Levels:
The swing analysis projects a multi-stage upward trajectory now that the structural reversal is confirmed:
Ultimate long-term target, retesting the lifetime highs of the 2021 bull run. |
**What are your thoughts on Balaji Amines? Are you holding or watching for a clean monthly close? Let's discuss in the comments! 👇**
#BalajiAmines #BALAMINES #TechnicalAnalysis #SwingTrading #StockMarketIndia #TradingView #Investing #ChartOfTheDay #Nifty
### ⚠️ Disclaimer:
The analysis provided above is strictly for educational and informational purposes only. It does not constitute financial advice, an endorsement, or a solicitation to buy or sell any securities. Trading in the stock market involves substantial risk. Please conduct your own due diligence or consult a certified financial advisor before making any investment decisions.
Bajaj Auto resistance to supportThere is confluence of 2 very good setups.
1. Earlier resistance of 10180 is now acting as support.
2. 10180 is also a 20D SMA.
A good low risk high reward swing trace is possible which can play out in few weeks.
Likely target of ATH can be considered.
SL below 10100 would be good.