ITC Approaches Key Support Within Mild UptrendTopic Statement:
ITC is trading in a range with a slight bullish tilt, presenting structured opportunities within a defined channel.
Key Points:
* The stock is moving within a slightly bullish up-trending channel, making it suitable for channel-based trading
* A head and shoulders candlestick pattern is emerging, which may signal potential short-term weakness
* The price is nearing the 180-day EMA, making levels near or below it attractive for long-term buying opportunities
Moving Averages
Engineers India – Technical Analysis & Trade SetupEngineers India Ltd has recently formed a rounding bottom pattern on the chart, a classic bullish reversal pattern that suggests a shift in momentum from bearish to bullish. The key resistance level lies at ₹210-212 price zone, and a breakout above this level with strong volume will confirm the pattern.
📈 Breakout Confirmation & Retest Zone :
A decisive close above ₹212 will mark a technical breakout, putting the stock at its 8-month high. Post-breakout, a retest of the ₹205–₹210 zone is likely
L&T Maintains Bullish Momentum Within a Rising ChannelTopic Statement:
L&T is in a strong bull run, consistently moving higher within a clear uptrending channel.
Key Points:
The stock is moving upwards in a bullish uptrending channel, making channel-based trading straightforward
It continues to gain momentum as it respects the channel boundaries
The price has overextended above the 200-day EMA, suggesting the stock is highly overbought and may face short-term resistance
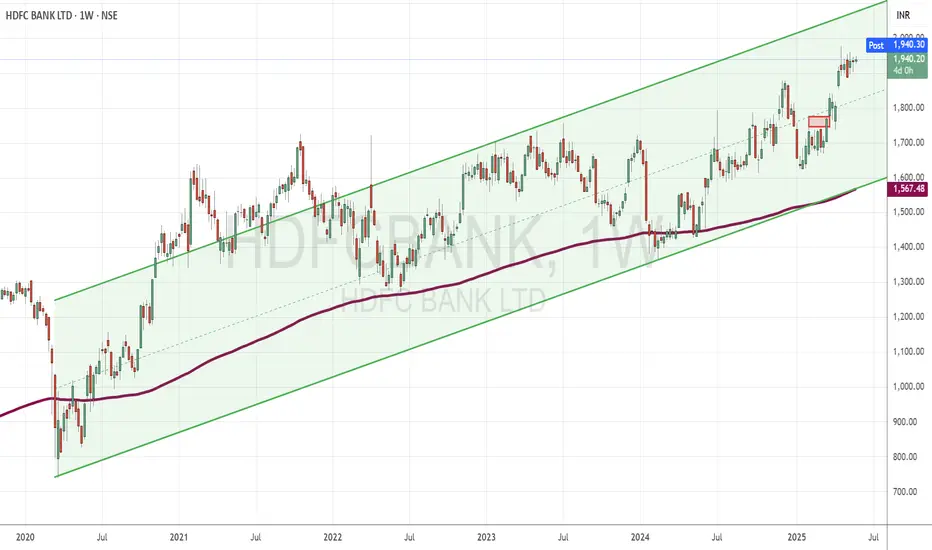
HDFC Bank Surges to Lifetime High Within a Defined Bullish ChannTopic Statement:
HDFC Bank is on a strong bull run, steadily climbing within a well-defined uptrending channel.
Key Points:
* The stock is trading within a bullish uptrending channel, offering clear opportunities for channel-based trading
* It is currently at its lifetime high, reflecting strong investor confidence and momentum
* The price has significantly overextended above the 200-day EMA, indicating the stock is highly overbought and may be due for consolidation or a pullback
Reliance Nears Lifetime High After Rebounding Strongly from TechTopic Statement:
Reliance is in a strong bullish phase, continuing its recovery momentum after a solid technical reversal.
Key Points:
The stock reversed sharply from a double bottom pattern at the 38.2% Fibonacci retracement level, offering strong support.
It received an additional bullish push at the 23.6% level, reinforcing upward momentum.
The price is approaching its lifetime high of 1161, where a double top formation is likely and could act as a profit-booking zone due to expected resista
Infy Attempts Breakout After Rebounding from Key Fibonacci SuppoTopic Statement:
Infosys is showing signs of a steady recovery after a deep correction, though key resistance levels still challenge the upward momentum.
Key Points:
The stock found strong support at the 50% Fibonacci retracement during the recent correction, indicating solid buying interest at lower levels.
As the price recovers, the 23.6% Fibonacci level is acting as resistance, slowing the upward move.
Trading just above the 180-day EMA, Infosys remains technically oversold, hinting at conti
TCS Eyes Recovery After Holding Strong at Key Support LevelsTopic Statement:
TCS has shown signs of recovery after a recent correction, with strong technical support levels reinforcing bullish potential.
Key Points:
The price previously found strong and consistent support near the ₹3000 mark, reaffirmed during the recent market correction.
A full retracement to the 50% Fibonacci level** at ₹3060 attracted significant buying interest, highlighting renewed strength.
Currently, the stock trades just below the 200-day EMA, indicating it remains in oversold
XAUUSD ( Gold ) Chart Analysis (XAUUSD 1H Timeframe) Chart Analysis (XAUUSD 1H Timeframe) – Quick Summary:
Pattern Breakout: A breakout has occurred from a descending triangle (wedge-like) resistance, confirmed by strong bullish candles.
Golden Crossover: Noted clearly on the chart – the 50 EMA has crossed above the 200 EMA, which is a classic bullish signal.
Volume Confirmation: Price surged with volume (assumed from price momentum), validating the move.
Trend Support: Price is respecting the rising trendline and forming higher highs.
Immed
GOCOLORS - Getting ReadyGOCOLORS is getting ready and has been testing the resistance level.
- It is consistently trading above the 20 EMA. Recent high-volume candles suggest clear institutional participation. Although volume is currently drying up, the price is sustaining — a positive sign.
- The stock reversed after touching the 0.5 Fibonacci retracement level, indicating strength.
✅ If you like my analysis, please follow me as a token of appreciation :)
in.tradingview.com/u/SatpalS/
📌 For learning and educati
GMDC: a probable long🔸Trendline breakout
🔸30 EMA breakout
🔸Decent financials with 2nd highest ever sales and 3rd highest PAT
🔸Substantial promoter holding
🔸Increase in FII folding although marginal
🔸Capacity expansion underway would pave the way for the highest ever sales and PAT
🔸PE below the industry PE and PEG below 0.50
Nifty Reversal Watch: Key Demand Zones & Moving Average in FocusAs a pure technical analyst, I rely solely on what the charts reveal, ignoring the noise of news and fundamentals. Charts tell the story in advance.
As a demand and supply zone trader, my primary focus is on identifying key areas where institutional activity is likely to drive price action. Today, we’ll analyze the Nifty 50 through the lens of demand zones and then complement it with traditional technical analysis using moving averages. This analysis aims to provide clarity on potential revers
Trend Reversal setup in BSOFT(Inverted H&S Pattern)!Birlasoft (NSE:BSOFT) – Bullish Reversal on Inverted Head & Shoulders
📌 Technical Pattern: A classic Inverted Head and Shoulders pattern is forming, suggesting a potential reversal from the recent downtrend.
✅ Key Highlights:
RSI Divergence at the head hints at waning bearish momentum and potential reversal.
Price is testing the neckline zone; a breakout could confirm the bullish setup.
50-period EMA (~₹452) remains overhead, acting as a dynamic resistance.
📈 Target: ~₹516, calculated from
Trend Reversal setup in HCLTECH(Inverted H&S Pattern)!HCL Technologies (NSE:HCLTECH) – Bullish Reversal Setup
📌 Pattern Identified: A clear Inverted Head and Shoulders formation is visible on the daily chart, indicating a potential bullish reversal.
✅ Key Observations:
Price has broken above the neckline and also crossed the 50-period EMA, showing strength.
Notable volume buildup at the right shoulder, supporting the bullish move.
RSI is above 60, suggesting improving momentum.
📈 Projected Target: ~₹2,074 based on the pattern's height.
🔻 Stop
BULLISH**Moving Averages – Daily (50, 100, 200):**
I have tested using the daily timeframe with 50, 100, and 200 simple moving averages.
Currently, there’s a huge gap between the CMP (3318) and the 50 DMA (3058).
**Support and Resistance Levels:**
- Resistance: 3500 (All-Time High)
- Support: 3245, 3168, 3058, 2957
Interestingly, 3058 is a strong level — it matches both moving average and support levels.
**Overall View:**
Gold looks bearish, but **don’t short it**.
Either:
- **Buy now**
TCI Swing Trade ( 20% upside)Transport Corporation of India (TCI) has started new up-trend on Weekly and Daily time-frame from strong Institutional buying levels.
It is good time to build positions in this stock. Don't go for hard stop loss. Manage position as it can take 1-2 months for the targets to reach and will shake out week buyers in between.
If nifty holds above 23900, TCI has 20% upside potential with 1:7 Risk Reward.
Follow and connect with me for more such setups.