DMART Oversold with Potential for ReboundTopic Statement: Avenue Supermarts (DMART) has corrected severely and is oversold, trading under the 180-day moving average near the accumulation zone, with gaps from the correction likely to be filled.
Key Points:
1. Company posted an acceptable profit growth of about 5% QoQ for the 3rd quarter.
2. Price is under the 180-day moving average, indicating oversold conditions.
3. Trading near the accumulation zone.
4. Gaps created during the correction are expected to be filled.
Moving Averages
cipla trend?cipla took 5 times support at 1440,
two time at 1330
formed a head and shoulder but failed , made fake out but a dark cloud cover was formed at 1690-1700
now breaking below and closing below 1440 can go to 1330
Disclaimer- Just my view and opinion trade at your own risk not an investment advice these are only for educational purposes
Cesc double topMade double top at 209
broke trendline , broke 200 dma,
bearish triangle breakout
and retest or pullback to 200 dma is shorting opportunity
closing above 200 dma can be taken as SL
however rsi is little over sold ,short term might have pull back so pefer lower time frames to trade , usually triangle broader length would be target
Disclaimer- Just my view and opinion trade at your own risk not an investment advice these are only for educational purposes
canfinhomescanfinhomes took 5 times support at 700 zone now broken
before breaking formed a triangle retested around 860
now can go to 600 strongly bearish also below 200 dma, a strong down trend in between pullbacks might happen but is still sell on rise
Disclaimer- Just my view and opinion trade at your own risk not an investment advice these are only for educational purposes
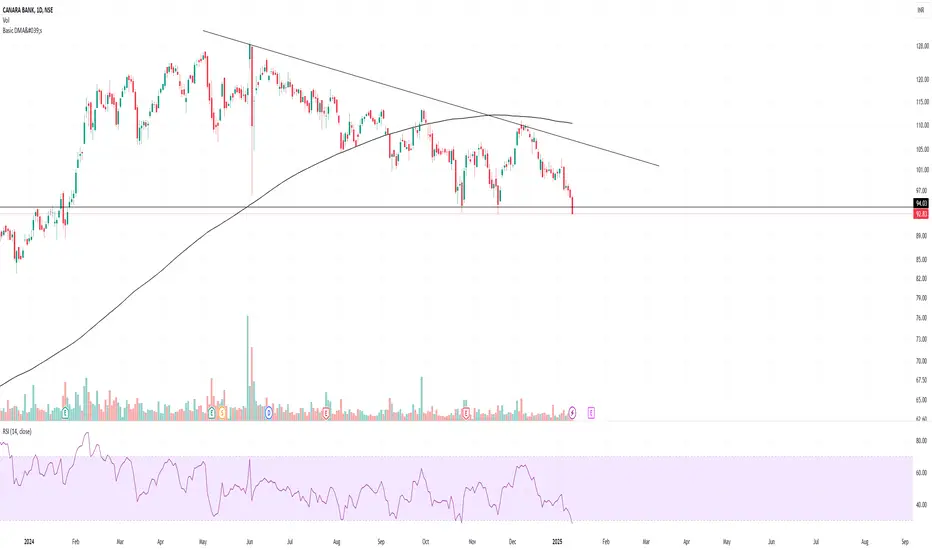
CANARABank took two times support at 92 what next ?canarabank bounced two times at 92 around ,more times the support is tested it will be broken however we can see it did made lower highs and is below 200 dma i think this time it will continue to be bearish
every time on closing basis did not close below support we can see in past two points but this time closed almost at days low strongly bearish
Disclaimer- Just my view and opinion trade at your own risk not an investment advice these are only for educational purposes
Delta Air Lines (DAL) - Breakout Play with Strong Volume ConfirmKey Observations:
Breakout Zone:
DAL has broken above a significant resistance level at $67.87, with a strong bullish candle and a 9% gain in one day.
Volume Spike:
A substantial volume increase indicates strong buying interest and institutional participation.
Risk/Reward Setup:
Entry Price: $67.87 (breakout level)
Target Price: $95.07 (potential upside of ~39.6%).
Stop Loss: $55.45 (below support zone).
Risk/Reward Ratio: 2.14
Moving Averages Support:
The stock is trading above key moving a
VST Looks good for 180-200TA shows volume bottoms for support, 3 LARGE bottom wicks on daily chart, weekly chart has a bullish hammer. Not to mention the monthly moving average 4 bounce we had today.
Feb21 expiry $200 Strike calls are constantly being loaded every day. Seems like accumulation to me.
Momentum can bring this up really fast, and the overall strength as markets turn red are a great sign too.
NFA - Watch this
TCS Surges 6% Post Q3 ResultsTopic Statement: TCS has surged 6% following its third quarterly results, with the stock creating a gap.
Key Points:
1. Stock has created a gap during the recent upward move and the price has crossed over the 180-day moving average.
2. Heavy support at the 4000 level.
3. Frequent resistance at the 4500 level.
Nifty analysis for 09/01/2025.Nifty is trading around the major support zone and today it has formed a hanging man candle near the support.
On the daily charts, there is a dual support i.e. 200 EMA and a support zone.
A Head and shoulder Pattern is also being formed in charts. If the pattern is confirmed a good bearish move can be seen in the Indian market.
Bullish trades can only be initiated only when there is a confirmation pattern near the support
Major support zone :- 23146-23500
Resistance levels :- 23675, 240
Vraj Iron And Steel - Daily - Short TermVraj Iron and Steel is trying to cross 20 EMA daily line.
if it closes above 20 EMA line with and close above small resistance then one can enter consider entry. Price is moving around 220-226 since few days.
Entry above 226 on daily closing basis
SL : 220, 212
Target 1 : 240++
Target 2 : 270++
NIFTY: Oversold with Potential for a Big MoveTopic Statement: NIFTY has corrected severely, trading below the 180-day moving average and forming a wedge pattern that signals a potential big move.
Key Points:
1. The price is under the 180-day moving average, making NIFTY oversold.
2. Candles are forming a wedge pattern, indicating a significant move upon breakout.
3. Gaps at the 25000 level suggest the market may eventually rise to fill them.
Stock Analysis: #AEGISLOGHello, Traders! 👋
I’m currently tracking #AEGISLOG for a potential swing trade. Here's what I see:
📈 Technical Overview:
🔹 The stock is approaching key levels, which I’ve marked on the chart.
🔹 Watching for a breakout or reversal to confirm the next move.
🔹 Volatility seems manageable, making it suitable for a swing setup.
⚠️ Disclaimer:
🔹 I am not a SEBI-registered advisor.
🔹 This analysis reflects my personal views and is not a recommendation to buy or sell.
🔹 Shared for learning purpos
Stock Analysis: #LLOYDSENTHello, Traders! 👋
Let’s dive into #LLOYDSENT, a stock I personally hold and continue to monitor closely. Here’s what I see:
📈 Technical Overview:
🔹 The stock is trading near key levels that I’ve marked on the chart.
💡 Current Position:
As a holder, my view might be biased, but I believe these levels could define the stock’s next major move. Watching closely for confirmation before making any adjustments.
⚠️ Disclaimer:
🔹 I am not a SEBI-registered advisor.
🔹 This analysis reflects my
flag pattern breakout Pitti Engineering has broke the flag pattern. This trade is little risky because the candle next to breakout candle has shown resistance to bulls and also the volume is very high but since it is Doji candle there is indecisiveness. To swing high in this trade entry could be made tomorrow or we can wait for this week's closing. Breakout candle has good volume.
ZOMATO: Pullback trade📊 Analysis:
Good bullish candle form on 21EMA with good volume.
📈 Trading Plan:
Entry: Buy above 290 (wait for a breakout above candle at least 15-30 min with strong volume confirmation).
Target 1: 320
Target 2: 345
Stop-Loss: 275 closing basis
ZLong
HIMADRI SPECIALITY CHEM LTD TRADING IDEA!📊 Analysis:
HSCL is trading above its key EMAs (20, 50, and 200), indicating a strong bullish trend.
The stock has broken a critical resistance level at ₹590, supported by rising volumes, signaling potential for further upside.
The price structure reflects bullish continuation with solid support below ₹565.
📈 Trading Plan:
Entry Point: ₹595 (enter on a breakout confirmation with good volume).
Target 1 (T1): ₹620
Target 2 (T2): ₹650
Stop Loss (SL): ₹565
🛑 Risk-to-Reward Ratio: Approximately 1:2
AZAD ENGINEERIN TRADING IDEA!📊 Analysis:
AZAD ENGINEERING is trading above key EMAs (20, 50, 200), indicating a strong uptrend.
The stock recently broke above a key resistance level of ₹1,850 with significant volume, confirming bullish momentum.
The price action suggests a continuation of the upward movement.
📈 Trading Plan:
Entry Point: ₹1,885 (after confirming a breakout with sustained volume).
Target 1 (T1): ₹1,950
Target 2 (T2): ₹2,050
Stop Loss (SL): ₹1,800
🛑 Risk-to-Reward Ratio: Approximately 1:2
Trading Idea For Kingfa
📊 Analysis:
KINGFA has shown strong momentum, breaking above key moving averages (EMA 50 and EMA 200).
Increased volume indicates accumulation and a potential breakout continuation.
The bullish candlestick formation supports further upside movement.
📈 Trading Plan:
Entry Point: ₹3,600 (confirm entry above this level with good volumes).
Target 1 (T1): ₹3,800
Target 2 (T2): ₹4,000
Stop Loss (SL): ₹3,450
🛑 Risk-to-Reward Ratio: Approximately 1:2
💡 Note:
This trading idea is for educational pu
AVALAND - Breakout above Falling Window Resistance ?AVALAND - CURRENT PRICE : RM0.335
AVALAND is bullish as the price is above 50 and 200 day EMAs. Take note that the stock made a Falling Window on 05 August 2024. Then the stock accumulate approximately for four months. Last Friday (03 JANUARY 2025), the stock closed above the Falling Window resistance level with a bullish Long Marubozu White Candle . Technically this is a buy signal.
ENTRY PRICE : RM0.330 - RM0.335
TARGET PRICE : RM0.380
STOP LOSS : RM0.300
Notes : AVALAND is a property c
Trading Idea: Kalyan JewellersCurrent Price: ₹777.80
💡 **Key Levels to Watch:**
- **Resistance Zone**: ₹794.70
- **Target**: ₹874.20
- **Stop Loss**: ₹758.95
📈 The stock is showing bullish momentum with strong volume and staying above key EMAs (746.22, 723.67). A breakout above ₹794.70 could signal further upside toward ₹874.20.
💡 **Strategy:**
1️⃣ **Buy Zone**: Above ₹780 for confirmation of the breakout.
2️⃣ **Stop Loss**: ₹758.95 to manage risk.
3️⃣ **Target**: ₹874.20 for a potential upside of ~12%.