Colgate-Palmolive: Oversold and Poised for Reversal Topic Statement: Colgate-Palmolive's stock has faced a severe correction but shows signs of reversal with strong support at 2700.
Key Points:
1. The stock has very strong support at the 2700 level.
2. The price is trading below the 180-day moving average, indicating it is very oversold.
Moving Averages
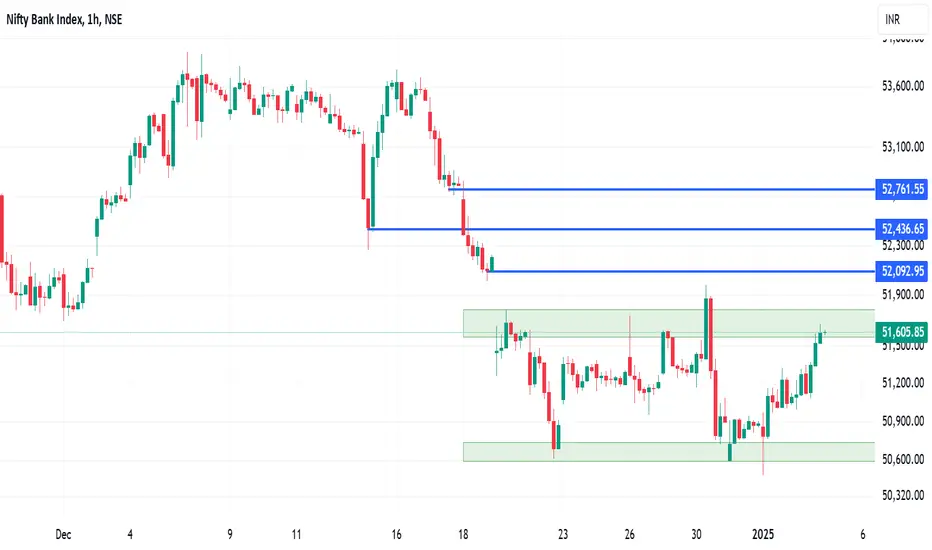
Banknifty analysis for 03/01/2025.Banknifty is trading in a range is trading around the resistance zone.
If their is a upside break out in the index, a trending move can be seen in it. Otherwise, another side way market will be there.
Moving averages are around the closing price and EMA strategy may also be implied in capturing the move.
Major levels
Resistance :- 51835, 52090
Support :- 50650, 50000
Wait for the pirce action near the levels before entering the markets.
Nifty weekly expiry analysis for 02/01/2025.Tomorrow is nifty first weekly expiry of the year.
A consolidation is going on in the index and today also it closed in a range.
If there is break out of the trendline on the upper side, chances of market retesting 24k levels are high.
In case of a fail and market trading downside, a trend downside possibilities are there.
20-EMA and 50-EMA are acting as a resistance and once cleared higher EMAs can be tested.
Option buyer be cautious of the expiry premium decay. Only trade the momentum
DMart: Oversold and in Accumulation Zone Topic Statement: DMart stock has been beaten down, becoming very oversold, with heavy support at 3500 offering a prime accumulation opportunity.
Key Points:
1. The stock price is trading below the 180-day moving average, making it extremely oversold.
2. The 3500 level acts as a strong support within the accumulation zone.
3. The stock can be accumulated now and sold near 4800, which is the distribution zone and a key resistance around 5000.
360ONEThe chart is self-explanatory and shared for educational purposes.
This stock is trading above the 50-day, 150-day, and 200-day moving averages. The 200-day moving average over the past three months indicates consistent growth, and the stock is also forming higher highs, suggesting the potential for further upward movement.
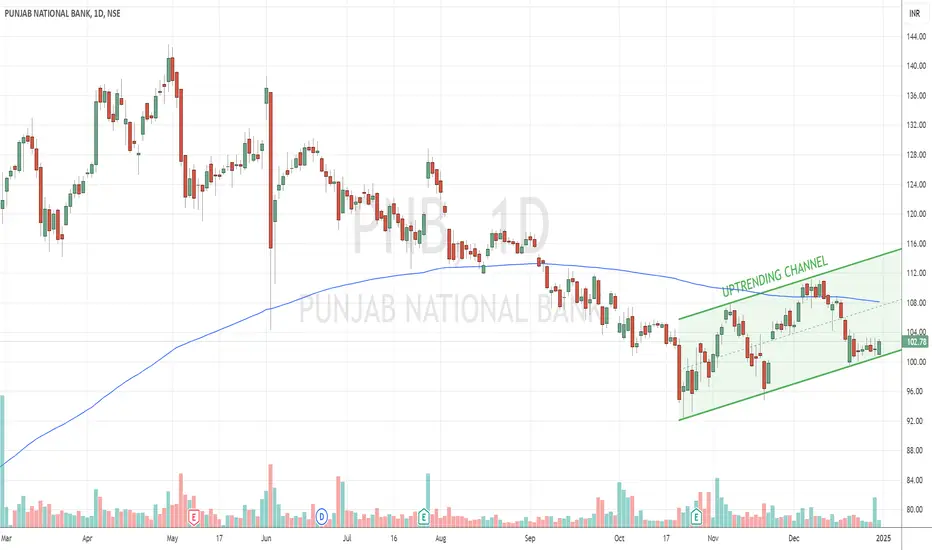
PNB: Oversold Stock with inherent bullishnessTopic Statement: The stock has become oversold but shows recovery potential as it moves in an up-trending channel following a recent breakout over the downtrend line.
Key Points:
1. The stock recently broke out over its downtrend line, signaling a reversal.
2. It is moving in an up-trending channel, indicating bullish momentum.
3. The price is currently below the 180-day moving average, making it oversold and a potential buying opportunity.
Balkrishna Industries (BALKRISIND) Monthly Chart AnalysisThe technical setup combines Fibonacci retracements, trendlines, and moving averages to reveal key insights into future price action.
The following analysis covers key support and resistance levels, bullish and bearish scenarios, and potential trade opportunities.
Trend Overview :
The stock is in a long-term uptrend, supported by a rising trendline that has acted as a strong base.
Recent corrections indicate a healthy retracement within this uptrend.
Fibonacci Retracement Levels
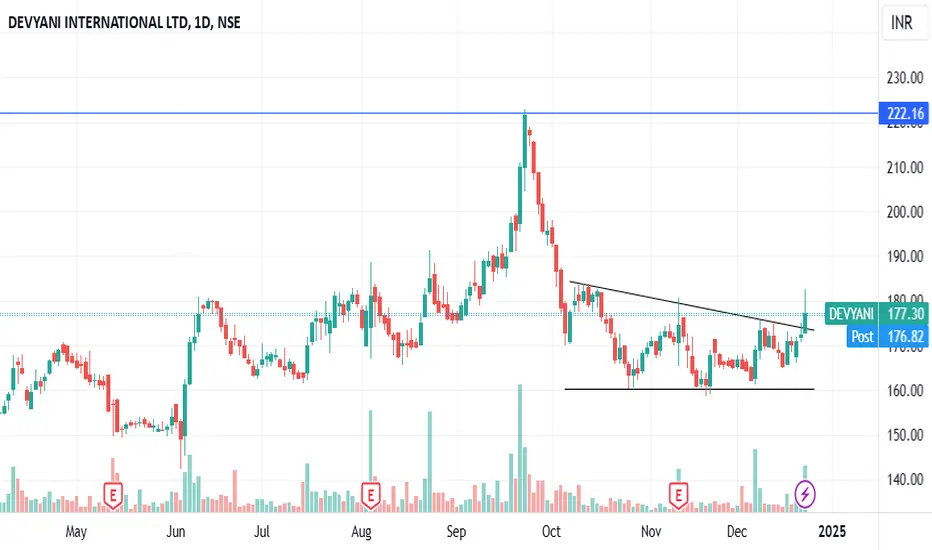
About to breakout swing trading!!🔍 Key Observation:
The stock is currently trading near a critical resistance level at ₹170. A breakout above this level can trigger further bullish momentum 📈.
🎯 Trade Setup:
Buy Above: ₹170
Stop-Loss: 3% below the entry price (₹165) 🔐
Target:
🎯 First Target: ₹187
📊 Technical Signals:
Resistance: ₹170 is a key breakout level to watch 🚀.
Volume: Look for increasing volume to confirm breakout strength 🔥.
🧠 Action Plan:
Wait for the stock to close or trade convincingly above ₹170 before enterin
Apollo Tyres: Range-Bound Opportunity for TradersTopic Statement: Apollo Tyres is trading in a range of 440 to 570, offering distinct accumulation and distribution zones ideal for swing trading and option writing strategies.
Key Points:
1. The stock is confined within a defined range of 440 to 570.
2. Clear accumulation and distribution zones provide opportunities for swing trading.
3. The range-bound nature makes it suitable for option writing strategies.
Voltas: Bullish Momentum with Key Support at 1600 Topic Statement: Voltas is on a bullish trajectory, moving in an up trending channel with crucial support at 1600, offering a buying opportunity near the 180-day moving average.
Key Points:
1. The stock is steadily moving in an up trending channel, reflecting a bullish trend.
2. 1600 is a critical support level where the price has stabilized.
3. Accumulation is recommended when the price nears the 180-day moving average.
Trading Idea: EMudhra Ltd📊 Pattern Formation:
eMudhra Ltd is showing a retest of a breakout level, confirming support at the previous resistance zone.
The stock is trading above the key EMAs (20, 50, and 200), suggesting continued bullish momentum.
💡 Entry Zone:
A bounce from the current level (₹932) provides a buying opportunity.
🎯 Target:
Upside target around ₹1,001, based on the measured move from the breakout.
🛑 Stop Loss:
Stop-loss set at ₹912, below the key support zone, to minimize risk.
📈 Volume Confirmation
Trading Idea: Gravita India Ltd (NSE) 📊 Pattern Formation:
Gravita India is forming an ascending triangle pattern on the daily chart, a bullish continuation setup.
The stock is consolidating above key EMAs (20, 50, and 200), indicating strong momentum.
💡 Entry Zone:
A breakout above the resistance at ₹2,260 could present a buying opportunity.
🎯 Target:
Upside potential target at ₹2,600, aligning with the triangle's breakout projection.
🛑 Stop Loss:
Set your stop-loss at ₹2,186, just below the lower trendline, to manage risk.
📈 V
LICI: Oversold at Key Accumulation Zone Topic Statement: LICI's stock price has taken a severe beating, now oversold and trading in an accumulation zone around 900, which aligns with the 50% retracement level and lies below the 180-day moving average.
Key Points:
1. The stock is trading in an accumulation zone around the crucial 900 level.
2. 900 corresponds to the 50% retracement level, indicating a potential support zone.
3. The price is below the 180-day moving average, signaling oversold conditions.
ZOMATO: On A Steady Bull RunTopic Statement: ZOMATO is on a steady bull run within an up-trending channel, offering accumulation opportunities near the 180-day moving average despite struggling to sustain above 300.
Key Points:
1. The stock is moving steadily in an up-trending channel, reflecting bullish momentum.
2. Accumulation is recommended when the price approaches the 180-day moving average.
3. The 300 level remains a critical resistance, with the price unable to hold above it.
ZLong
POWERGRID - very bearish after breaking out of double top
DOUBLE TOP BREAKOUT -
price of NSE:POWERGRID has recently broken out of a perfect double top pattern indicating strong downward pressure for the stock
MORNING STAR CANDLESTICK -
price has formed a morning star candlestick pattern at the last peak indicating bearish momentum for the stock
CROSSED BELOW 200D SMA -
the price has also recently crossed below 200D sma which is an indicator of strong downside pressure for the stock.
TARGET -
the price will go till 301.9 le
Trading Idea for Nuvama!📊 Technical Setup:
The stock is in an uptrend, respecting the rising trendline (📈 marked with arrows).
EMA indicators (20, 50, and 200) are well-aligned ✅, confirming a bullish bias.
The price has recently bounced from the trendline support, showing strong buying interest 🛡️.
💡 Entry Point:
Buy Zone: Around ₹6,800–₹6,850 (current levels) 📍, aligning with the trendline and EMA support.
⛔ Stop-Loss:
Place a stop-loss below the recent swing low at ₹6,730 ❌. This level invalidates the setup if br
LTIM: Post-Breakout Dive Nears Key Support Levels Topic Statement: LTIM recently broke out above 6500 but faced a sharp dive during last week's market correction.
Key Points:
1. The stock's breakout over 6500 was reversed by a significant price crash during the market correction and the price has created a gap as it moved downwards.
2. Trading under the 180-day moving average signals oversold conditions.
3. Selling pressure may persist, with critical support levels marked on the chart.
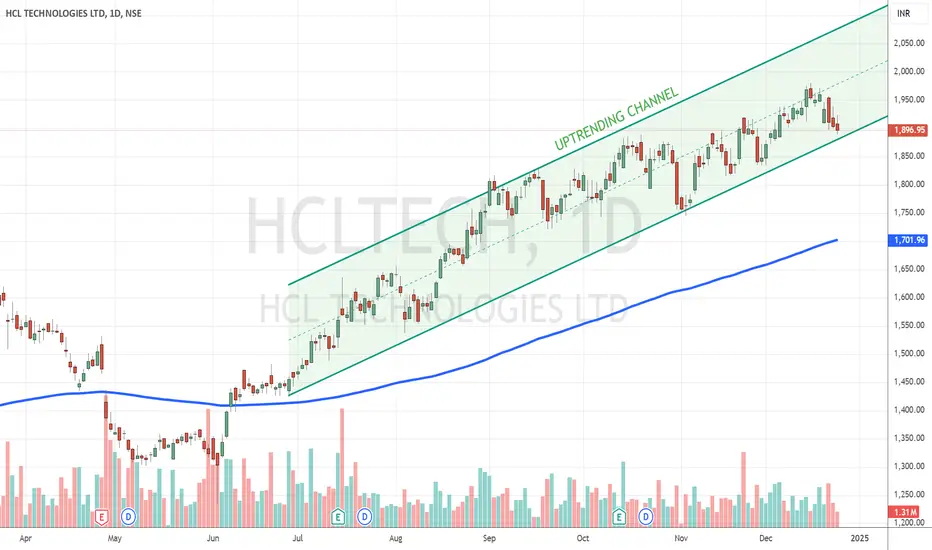
HCLTECH: Bullish Momentum Awaits Quarterly Results Topic Statement: HCLTECH is on a bull run, moving in an up-trending channel, but overbought conditions may lead to a correction pending upcoming quarterly results.
Key Points:
1. The stock is rising within an up-trending channel, indicating strong bullish momentum.
2. The price is overextended above the 180-day moving average, signaling overbought conditions.
3. The sustainability of the bullish trend depends on the outcome of the upcoming quarterly results.
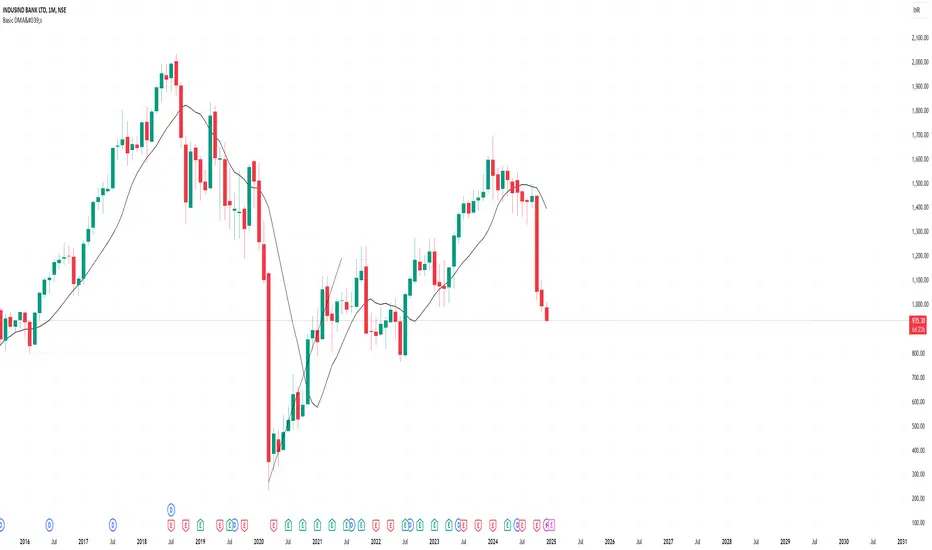
just the beginning of the fall much more left INDUS IND BANKfundamentally in the past also indus ind has internal issues
management is not good (hinduga group )
better stay away from it can go below 700-500 also
below 790 can go to covid low
Also stay away from Rbl Bank and Bhandhan Bank
Disclaimer- Just my view and opinion trade at your own risk not an investment advice
these are only for educational purposes
Bullish Breakout on Indian Renewable Energy LtdThe stock of Indian Renewable Energy (NSE: INDIANRE) is showing strong bullish momentum, with a breakout above the descending trendline that has been acting as resistance for several weeks.
Key observations:
Trendline Breakout: The price has successfully closed above the descending trendline, signaling a potential trend reversal.
EMA Support: The stock is trading above the 200 EMA (currently at ₹190.05), confirming a shift in long-term sentiment to bullish.
Volume Spike: A significant