Moving Averages
#GLENMARK Setting Up for a Pre-Breakout!💊 Stock Alert: #GLENMARK Setting Up for a Pre-Breakout! 💊
📈 Ready for Another Run: After a previous breakout attempt was halted by market volatility, #GLENMARK is now showing renewed strength, rebounding off support as the pharma sector gains momentum. This time, the stock is forming a Darvas Box—a strong indicator of continued bullish momentum. With these signals aligning, #GLENMARK is set for another bullish run, making it a prime candidate for a swing trade. 🔥
💡 Don’t miss this chance to po
#PCJEWELLER Offering a Re-Entry for Another Bull Run!💍 Stock Alert: #PCJEWELLER Offering a Re-Entry for Another Bull Run! 💍
📈 Rebound in Motion: #PCJEWELLER is showing renewed momentum, rebounding after finding support at the 50-day moving average. With jewelry stocks recently seeing a massive bull run—even as the broader market struggles with volatility—this is an ideal re-entry for those looking to catch the next bullish wave. The setup is strong, making it a top candidate for a swing trade. 🔥
💡 Don’t miss out on this chance to position early
#ADSL Gearing Up for Another Bull Run!🚀 Stock Alert: #ADSL Gearing Up for Another Bull Run! 🚀
📈 Golden Pre-Breakout Opportunity: This tech stock is showing strong momentum, even with the broader market facing volatility. #ADSL presents a pre-breakout entry, making it an ideal time to get in early! With #CNXIT indicating bullish momentum across IT stocks, #ADSL looks set to follow the uptrend. This is a prime opportunity to capture the potential bull run ahead of retail investors, positioning it as a strong candidate for a swing tra
#JSWSTEEL Primed for a Bull Run!🚀 Stock Alert: #JSWSTEEL Primed for a Bull Run! 🚀
📈 Golden Pre-Breakout Opportunity: Today’s session saw a solid candle with huge volume build-up, even as the overall market remains weak due to volatility. With Q2 earnings just out and looking strong, #JSWSTEEL presents a safer trade amid market fluctuations—just remember to keep a tight stop loss during these volatile conditions. This is a pre-breakout entry, making it a golden chance to get in early!
With #CNXMETAL showing momentum in metal
Channel breakout with strong bullish candle in JSW Steel(Hindi)NSE:JSWSTEEL A strong channel breakout with a big bullish candle has emerged in JSW Steel with strong volume support. 44 EMA is also about to cross the bullish candle reaffirming the bullish signal.
A SL of 945-947 with a target of ATH and above is recommended.
The rest of the video is explained in Hindi
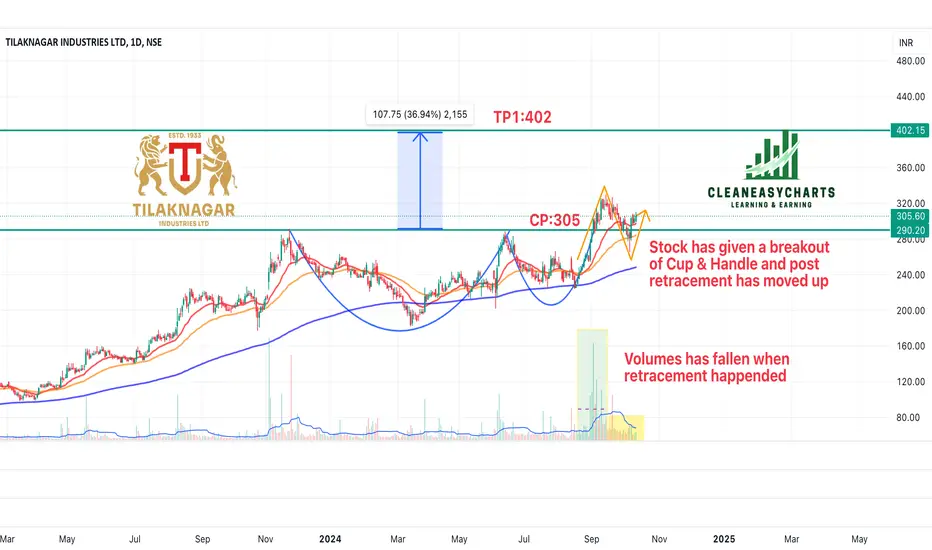
TilakNagar Industries - Cup & Handle BreakoutTilakNagar Industries has given a breakout of Cup & Handle with good volumes. This is heading to 400+ as first target. Other factors:
1. Breakout of Cup & Handle and then retested but with lesser volumes shows strongness of stock.
2. RSI is good and moving towards above 60
3. MACD is becoming positive
4. One of the best Quarter results
5. Becoming a debt free company by March'25
6. New launches in next 18 months
7. Venturing into luxury segment as well.
Keep following @cleaneasycharts as we p
MN HOLDINGS - Potential of making Bullish Symmetrical Triangle ?MN HOLDINGS - Current Price RM0.920
In long term the stock is still UPTREND as it is above 200-day EMA. In short and medium term, the stock is in sideway/consolidation.
The declined from 12 Aug 2024 (high RM1.12) to 29 Aug 2024 (low RM0.820) is due to weak market sentiment and profit taking activity. At current situation, the stock have a potential of making Bullish Symmetrical Triangle. If price made a breakout above the pattern, then it will trigger a buy signal (as it is viewed as Bullis
Stock Update: HALHAL is showing promising signs, reversing from the 200 EMA, which has historically acted as a strong support level. Additionally, the 4050 zone provides a solid foundation, reinforcing this level as a potential launching pad for a bullish reversal.
Key Points to Note:
1) 200 EMA Reversal: Often viewed as a strong technical indicator for possible trend changes.
2) Support at 4050: Providing a cushion for potential upside movement.
3) This setup could be interesting to watch for anyone trackin
Bank Nifty - Formation of Bearish Head and ShoulderBank Nifty index is forming bearish head and shoulders pattern. Here are the key levels mentioned below:
Neckline : 50000 (activation point for the pattern)
Immediate Support: 49700 (200 EMA)
Potential Target: 46500 (if price pierces below 200 EMA)
Trend Breakdown: Noted breakdown of the uptrend line since October 23.
Make sure to keep an eye on these levels and monitor price action closely as it approaches them! If you have any more insights or questions about trading strategies, feel
ASTRAL NSE DTF SWINGASTRAL SWING Analysis
TRADE PLAN
ENTRY : 1890 50%Qty. ADD 50% Abofe 2050 DTF Close
SL : 1860
TGT- 2000
Time frame @1 to 3months
ASTRAL on DTF had a RESISTANCE trendline on breaking this and Retest make entry.
Price is trading below the 20EMA and the the sequence of 200 to 20EMA is inverted indicating a bearish Trend is prevalent.
The stock currently trading is at the base of proable Wyckoff accumulation Phase.
A bearish Orderblock is seen at 2050 levels. Add 50% when price BO and close
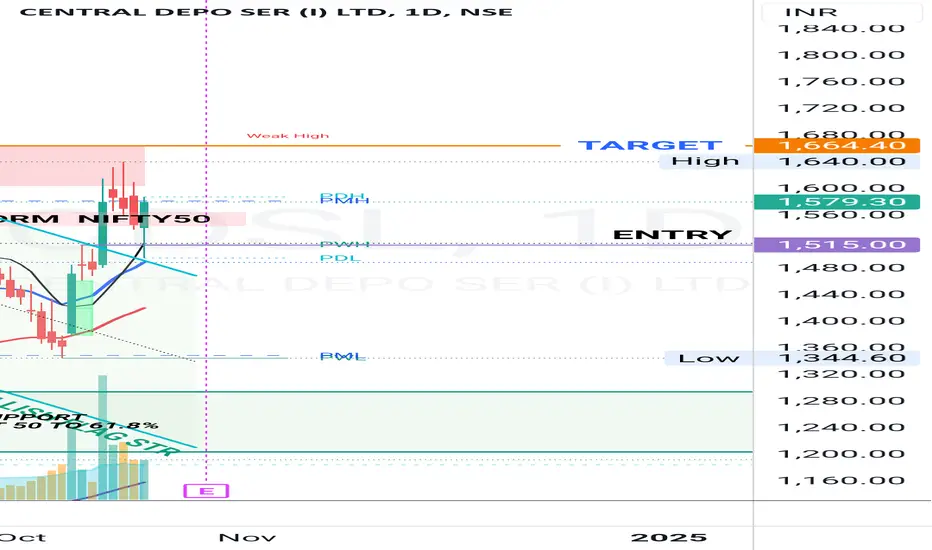
CDSL BULLISH FLAG&POLE BO DTF/WTF SWING/POSITIONAL Refer the chart for details
The stock after a bullish streak has retraced to just above the 50% FIBO/R level.
Its has broken out of the Flag a week ago and now retraced to form a bullish candle indicative of a bullish reversal.
ENTRY can be at current price. Keep SL below the previous week Low.
the standard disclaimer in my other analysis apply.
Lets have a tea Technical Analysis of Aditya Birla Sun Life AMC Ltd. (ABSLAMC)
Background:
Aditya Birla Sun Life AMC Ltd. is one of India's leading asset management companies, offering a wide range of mutual fund schemes.
Technical Analysis: Rounding Bottom Pattern
The chart indicates a potential Rounding Bottom Pattern formation for ABSLAMC. This is a bullish reversal pattern that suggests a potential uptrend after a period of decline.
Key Characteristics of the Pattern:
* U-Shaped Bottom: The price action f
Lets have a tea Technical Analysis of Aditya Birla Sun Life AMC Ltd. (ABSLAMC)
Background:
Aditya Birla Sun Life AMC Ltd. is one of India's leading asset management companies, offering a wide range of mutual fund schemes.
Technical Analysis: Rounding Bottom Pattern
The chart indicates a potential Rounding Bottom Pattern formation for ABSLAMC. This is a bullish reversal pattern that suggests a potential uptrend after a period of decline.
Key Characteristics of the Pattern:
* U-Shaped Bottom: The price action f
GICL has a potential to move up?This is purely technical, on a daily chart, GICL has formed a bullish cypher pattern, also it took support at 200 day moving average, and its RSI is also about to breakeven. All this indicate a positive move upwards.
Disclaimer: Kindly consult your financial advisor before taking any trade..!
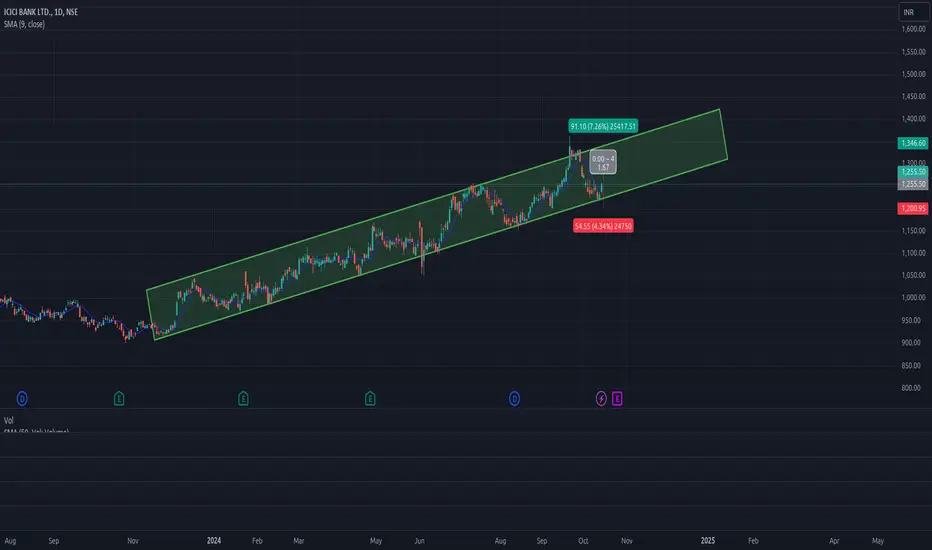
ICIBANK: Swing: 1D 16-Oct'24ICIBANK: Swing: 1D 16-Oct'24
ICICI Bank is trading in a channel (marked) for the last several months and is in a uptrend. ADX is 21 (>20).
The ADX slope is -ve but seems like the slop is reducing and will turn positive in the coming days.
The stock hit the bottom of the channel on 11-Oct24 with a red candle and then on 14-Oct'24 bounced back with green candle. Ideally the close of the 14-Oct'24 candle should have been our buy price but on 14-Oct'24 the stock was trading below 9 SMA
Godrej Consumer Ltd#stocks #investing #trading #trade #invest #swingtrade #bullish
Key Observations:
1. W-Pattern Formation (Hourly Timeframe): The stock is forming a bullish “W” pattern, which typically signals a potential trend reversal, indicating possible upward movement in the short term.
2. Bullish Divergence in MACD: A bullish divergence in the MACD indicates that momentum is strengthening despite previous price weakness, further supporting a potential uptrend.
3. Trendline Breakout with Rising Volume:
IRB After Giving Great Runup attempting to take supportNSE:IRB after giving great runup attempting to take support at 200 EMA with somewhat good volumes.
Disclaimer: This analysis is intended solely for informational and educational purposes and should not be interpreted as financial advice. It is advisable to consult a qualified financial advisor or conduct thorough research before making investment decisions.
Stock Analysis: CampusDowntrend: Campus had been in a steady downtrend since October 2022, reaching a low of ₹213 in March 2024.
1) Trend Reversal: Recently, the stock broke its previous lower high of ₹300 with a strong bullish candle and high volume, indicating a potential trend reversal from downtrend to uptrend.
2) EMA Confirmation: The stock also crossed above the 200 EMA on the daily timeframe, providing additional confirmation of a bullish trend.
3) This dual confirmation suggests that Campus may be entering