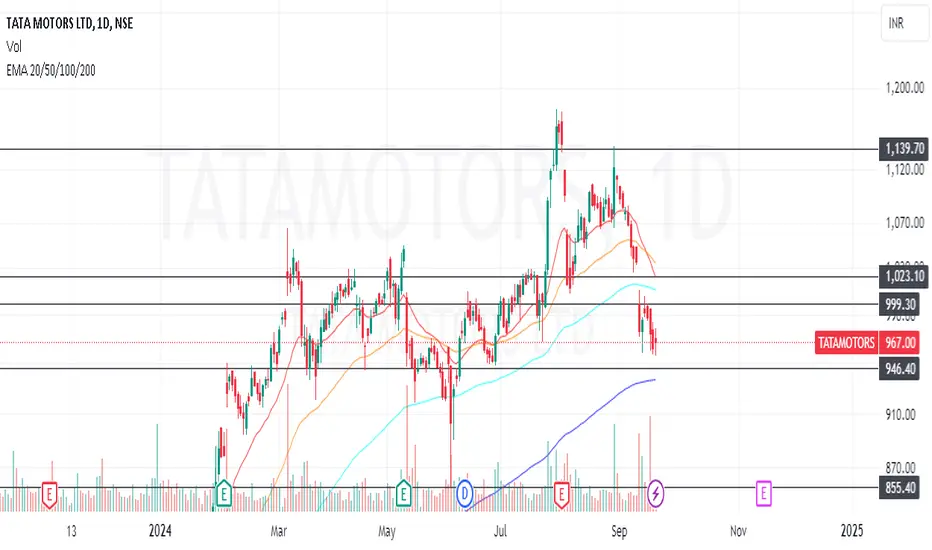
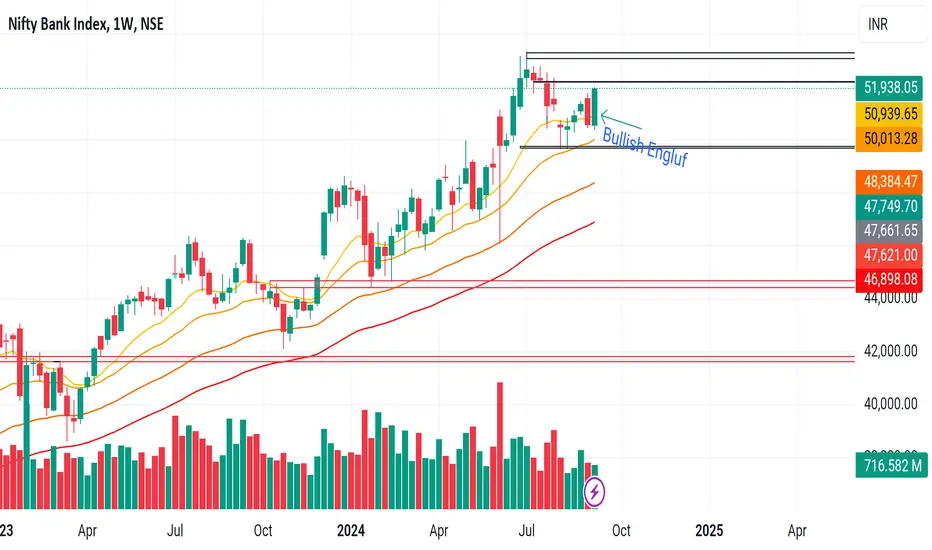
Moving Averages
TATA CHEMICALS Swing Idea (Long)Tata chemical is preparing for breakout in upcoming weeks due to following technical reason:
1) Breakdown failure of M pattern
2) Previous resistance for breakdown will act as support now
3) Asymmetrical tringle pattern formation
4) On Daily candlestick chart trading above 20,50&
200 ema
On Weekly candlestick chart trading above 20 &
50 EMA
On Monthly candlestick chart dragonfly doji
formation indicating buyers in control
(Note: I am neither responsible for anyon
Cummins India Swing Idea (Long)Cummins India is looking for breakout due to following reason :
1) Swing Low are shifting upper side
2) Double Bottom pattern / W pattern
3) Ascending Triangle pattern formation
4)Trading above 20,50 & 200 EMA on daily chart
(Note: I am neither responsible for anyone's profit or loss nor I'm a sebi registered RA, this only for educational purpose. Please do your own due diligence before taking any trades.)
SHRIRAMFINThe chart is self-explanatory.
SHIRAMFIN STOCK has shown a gradual upward movement since June, trading above the 50, 150, and 200 moving averages with a steady increase. After the breakout, this stock has formed higher highs. Considering these factors, it is possible for the upward movement to continue.
Banknifty analysis for weekly expiry 01/10/2024.Banknifty weekly expiry can be seen taking market towards another round number figure of 52500 levels.
There was a good bearish movement on the daily charts, market closed 850 points lower. Chance of a follow through can be seen as both the index are moving in tandem.
Watch banknifty breaching 52780 levels as there will be double support break down.
Major levels to look for tomorrow :- 53060, 52780, 52625
Wait for the price action near the levels before entering the markets.
Tech Mahindra Monthly Expiry (Short)Tech Mahindra can correct itself due to following technical reason:
1) DoubleTop Formation/ M pattern
2) Swing low are broken
3) On Daily chart trading below 20 EMA
On Hourly chart trading below 20 & 50 EMA
4) Tried breakout yesterday failed today marubozu
seller on daily candle representing seller's in
control
5) Can correct further since it's breaking channel.
(Note: Author is neither responsible for anyone's profit or loss, nor a sebi registered RA, this only for educat
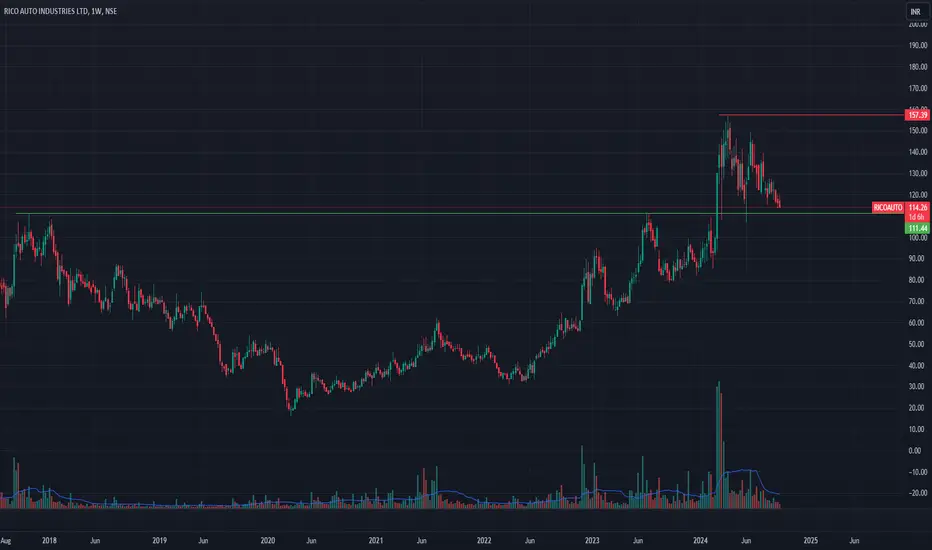
Stock Analysis: Rico Auto🚗 Multi-Year Breakout Alert!
Rico Auto has shown significant strength with a multi-year breakout, surpassing its 2005 all-time high. Let’s break it down:
Historical Resistance: The stock tested its 2005 all-time high two times:
In 2017, it reversed from these levels.
In 2023, it made another attempt but failed to break through.
February 2024 Breakout: This time, the stock finally broke the strong resistance with good volume in February 2024. This breakout suggests a potential long-term trend
Bank Nifty Monthly Expiry (Short)Bank Nifty might give some correction due to following technical reason
1)Swing high are shifting and swing low are being tested
2)Triple top/ Double top Formation on 15 min chart
3)Trading below 20 EMA on 15 min
(Note: Author is neither responsible for anyone's profit or loss, nor a sebi registered RA, this only for educational purpose. Please do your own due diligence before taking any trades.)
Pullback With Good Volumes Testing 100 EMANSE:MAHLIFE has given today's pullback with good Volumes and is now testing 100 EMA on a daily timeframe a close above 616 and 100 EMA will be Crucial.
Disclaimer: This analysis is intended solely for informational and educational purposes and should not be interpreted as financial advice. It is advisable to consult a qualified financial advisor or conduct thorough research before making investment decisions.
HDFC BANK ( Looking goog to invest); small stoploss is enough;For short term investment ;
Leave a " Like If you agree ".👍
.
Wait for small retracement & daily candle to close above - "1650".
Trade carefully untill ENTRY level.
.
Entry: 1655 / 1640
target: 1675- 1700- 1750
sl: 1640 / 1630
major stoploss/ support: 1600
.
.
Enter only if market Breaks
"Yellow box" mentioned.
.
.
Don't make complicated trade set-up.📈📉
Keep it " simple, focus on consistency " 💹
Refer our old ideas for accuracy rate🧑💻
Follow for daily updates👍
.
Refer old posted ide
Stock Alert: Mazagon Dock Shipbuilders Ltd.🚢 Reversal Pattern Alert 🚢
Mazagon Dock Shipbuilders is showing strong signs of a reversal near its support zone, accompanied by a significant volume breakout! 📈
This indicates potential buying interest and could present a great opportunity for those looking to capitalize on the momentum.
Key Observations:
📉 Support Zone: Price held firm around a critical support area, indicating strength.
💼 Volume Spike: Sudden increase in trading volume suggests growing investor confidence.
🔄 Reversal Signa
Tata Technology now changing its course .As we have been observing for a long time, Tata Technology was stuck inside a parallel channel, now it has broken out of the channel and has also been successfully retested, and now Tata Technology can touch new heights. in my opinion, we can tread above 1135 with the SL of 1043
for the long term 1st target is 1200 ,2nd 1290, 3rd1400
Tube Invest of India NSE:TIINDIA is trying to break major levels after consolidation and taking 100 EMA Support with good volume today. Keep in Watchlist.
Disclaimer: This analysis is intended solely for informational and educational purposes and should not be interpreted as financial advice. It is advisable to consult a qualified financial advisor or conduct thorough research before making any investment decisions.
CVNA bullish to 180/200CVNA Loves the MAs. This stock will scare you straight, and still have you rushing back for more.
Patience and expiry are key here. I like January expiry on calls.
Look at the chart and you'll see the bottom volume strength, as well as the buyer strength over sellers
Looks good. NFA
Adani Power - Perfect Fibonacci Trade SetupAdani Power Trade Setup
The fibonacci setup is giving a very good trade setup for this stock.
the MACD trend lines are about to move up showcasing the end of downward cycle and it's perfectly setting on the fibonacci setup.
Wait for a day or two for the movement in the upward direction and take an entry in the stock with a price target of 895.
the trade is having a ratio of 1:3.6
Devyani International Potential Bullish MomentumFollowing a notable consolidation phase that commenced in January 2024, Devyani International has exhibited promising technical signals, suggesting a potential shift towards a bullish trend. Last week, the stock successfully breached the pivotal resistance level of 185 on the weekly timeframe, which is a critical psychological and technical milestone.
The 20 EMA has crossed above the 50 EMA on the weekly chart, a classic indicator of bullish momentum known as a "Golden Cross." This crossover ty