CNXIT BULLISH !
1. Resistance Breakout:
- The index has historically faced selling pressure at 38,653 - 38,405 Zone, causing it to reverse or pause its upward movement.
- When a stock breaks above a strong resistance level, it means that buying demand has overwhelmed the selling pressure at that price point. This breakout is a positive sign, indicating that the chart may move higher, especially if it is a clean break (i.e., it closes significantly above the resistance level).
- The **strength of th
Moving Averages
Kotak Bank Swing Idea (Long)Kotak Bank is stuck in parallel channel range for awhile & might make a move in coming weeks due to following reasons
1)Trading above 20 EMA & 50 EMA on daily chart
2)Inverse head & Shoulder formation on weekly chart
3)Double Bottom pattern formation on daily chart
4)Swing Lows are not broken on weekly
(Note: Not responsible for profit & Loss nor a sebi registered RA, this only for educational purpose. Please do your own due diligence before taking any trades.)
Nazara TechnologyWe are closely following Nazara Technologies and believe itโs poised for a breakout based on its technical patterns. Consolidation near resistance often suggests a potential for a breakout if the price action confirms it. If Nazara Technologies breaks through the 1020 level, it could indeed pave the way for further upside, potentially reaching your targets of 1350, 1500, and 1650+.
Itโs always good to keep an eye on broader market conditions and any company-specific news that could impact the s
Banknifty Spot Daily Chart AnalysisBanknifty Spot CMP@50576 Chart Pattern Looks Bearish
Basis For Analysis
Closing Below 20. & 50 DEMA
Stock Below Monthly CPR
NEXT Support @100 DEMA@50200 Closing Below that will lead the Banknifty Towards 200 DEMA@48700
Chart Pattern will Negate if Banknify Spot Closes Above 51100
Coal India showing a break down on the daily and weekly charts.Coal India has been trading in a parallel channel from Feb 2024 and the range has been broken and closing below it has been given on the daily and weekly basis.
The stock is trading around a support zone of 480-485. It is trading around the 100 ema levels on the daily charts and closed below 20 ema on weekly charts.
Entry in a bearish trade can be made once the market take a retest around the round number figure of 500 and forms a negative price action.
Clear pattern break down is there in t
Banknifty weekly analysis for 09/09/2024.Banknifty is trading below the 50k levels and the weekly bearish engulfing candle signifies some bearishness coming.
The market has reversed from 50% fib levels and the pattern formation is also negative.
Index seems to give a follow through candle in the same direction as it has been trading silently for past few days.
Major levels :-50400, 49940, 49670
If market starts trading below 49700 levels, a bearish trend will be confirmed and sell on rise will be the market cycle.
Resistance leve
Nifty weekly analysis for 09/09/2024.The index after a long time has given some momentum on intraday basis and closed below the psycological number of 25k.
A bearish engulfing candle on the weekly time frames shows some weakness on the charts. If the market starts trading below the 24800 levels, there are chances of testing lower levels.
Hourly 200 ema is also around the support zone, while the daily candle closed below the 20 ema.
Major support levels :- 25800, 24600, 24230
Resistance levels :- 24960, 25100
The level and the
UTIAMC-DO NOT MISSLogic-Simple weekly resistance breakout, retest and continuation.
Weekly closing above 910 will be a confirmation. 1000 will be immediate resistance.
A good investment stock for long term as well available at a fair valuation with more than 2% dividend yield. I am expecting similar rally as HDFC AMC in this stock but move would be slow.
Not a recommendation, just my personal opinion!
#PRESTIGE Poised for a Bull Run!๐ Stock Alert: #PRESTIGE Poised for a Bull Run! ๐
๐ Momentum in Play: The recent session saw a huge volume build-up, and #PRESTIGE is now trading above the 50-day moving average. It's nearing its all-time high again, with momentum suggesting a bullish run ahead. This makes it a strong candidate for a swing trade. ๐ฅ
๐ก Keep #PRESTIGE on your watchlist for potential opportunities! ๐
๐ข Disclaimer: This post is for educational purposes only. Always do your own research before making any investment
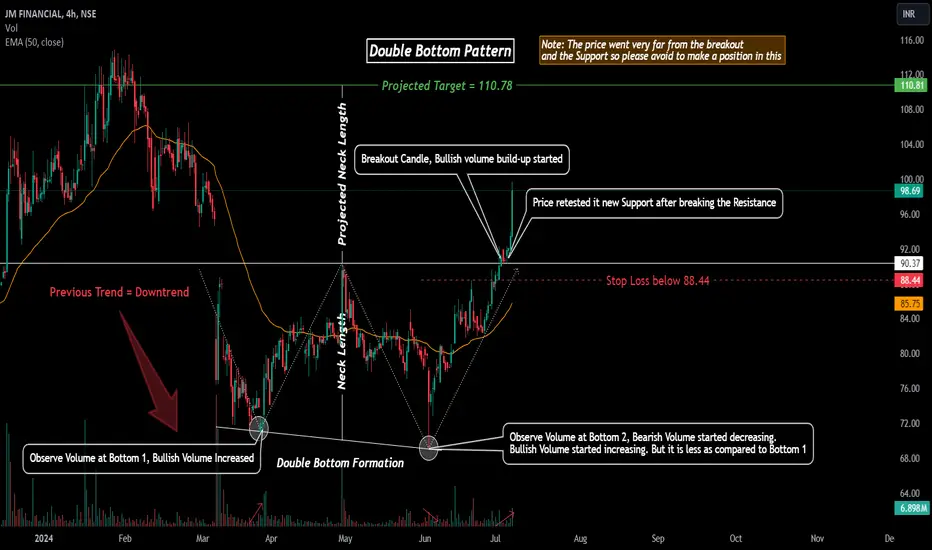
JMFINANCIL Analysis!NSE:JMFINANCIL Analysis on a 4H Timeframe!
Short Term Movement Analysis on JMFINANCIL!
Double Bottom Pattern Formation in JMFINANCIL!
Double Bottom Neckline breakout at JMFINANCIL!
Analysis:
JMFINANCIL was in the Downtrend since 29 Jan 2024. We can clearly see it has made a Double Bottom Pattern. It also given the breakout to its resistance level which is nothing but pattern's neckline. After that it has retested the resistance level which becomes the new Support level. The bullish mom
XAUUSD 2560Golden Information
Gold prices fell during the North American session as traders returned to their desks following the Labor Day holiday. Data from the United States (US) hinted that business activity contracted, though traders bought the Greenback. The XAU/USD trades at $2,490, down 0.34%.
Gold prices fall despite stronger US Dollar amid economic slowdown signs.
US ISM Manufacturing PMI remains in contraction; employment sub-component improvement offers market some relief.
Despi
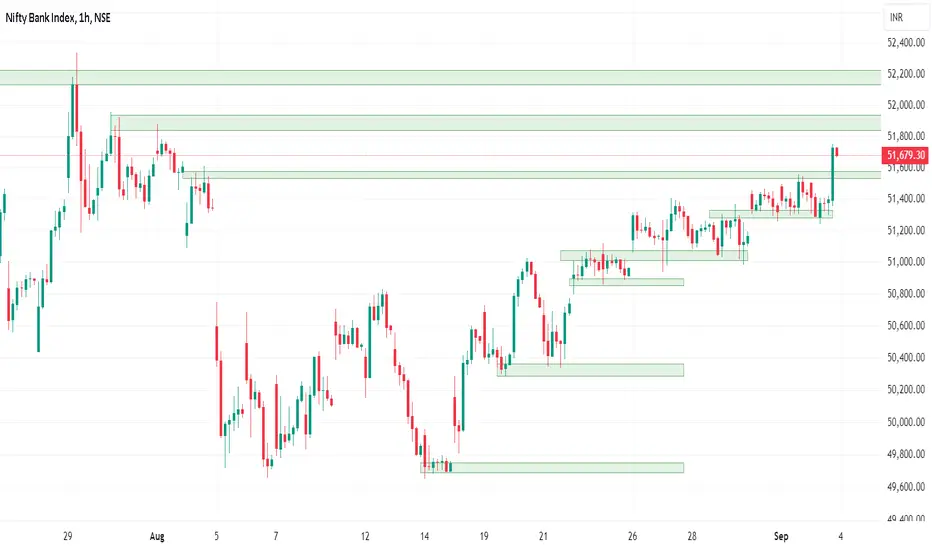
Banknifty weekly expiry analysis for 04/09/2024.Banknifty has been lagging behind and is still 1500-1700 points lower from its all time high.
The market in the final hour has given a nice upside rally and closed above the round number levels and the resistance zone.
An engulfing candle is formed on the daily charts and tomorrow is weekly expiry in the index. If there is a gap up opening there are chances of it giving a nice upside rally.
In case of a flat to slight gap down opening, a slaggishness can be seen as the makret is behaving now
Aarti Drugs - Fibonacci Retracement ToolWe have used fibonacci retracement tool to check the retracement of price. The price has reached 0.382 and once cross this, we can see change of trend. We can also see the EMA20 about to cross EMA200, which will show bullishness in the stock. The fibonacci at 0.5 level, 0.618 as resistances, and on crossing each resistance we can see price moving up.
Other factors:
1. MACD about to be positive
2. RSI is a bit down, however, we can expect it to move above
3. Volume candles; buy candles are bigg
#GIPCL on the Rise! Pre Breakout entry#GIPCL on the Rise! ๐
๐ Gearing up for a Breakout: The last two three trading sessions have shown significant momentum with good volume, and #GIPCL is now trading above the 50-day moving average. The momentum is strong, signaling a potential bullish run ahead. ๐ฅ
๐ก This makes #GIPCL a top candidate for a swing trade. ๐ If you're looking for opportunities, keep an eye on this one! ๐
๐ผ Trade smart, and stay ahead! ๐ช
#StockMarket #Trading #InvestSmart
Target: 270-280
Stop Loss: 230
Greenpanel Industries LtdGreenpanel Industries Ltd, (small cap)
Since 2022 April price is consolidating in triangle format,
it must breakout 450 with high volume...( 5th E W remaining to shoot up)
golden cross happened in day chart means where
the 50-day MA crosses above the 200-day MA,
is considered a bullish breakout pattern that indicates a potential upward trend in the market.