Cup & Handle Formation in DEEPENRA cup and handle pattern is being formed in weekly time frame of DEEPENR. Watch for close above 195. Sharing only for educational purpose.DLongby an_TradeTiger11
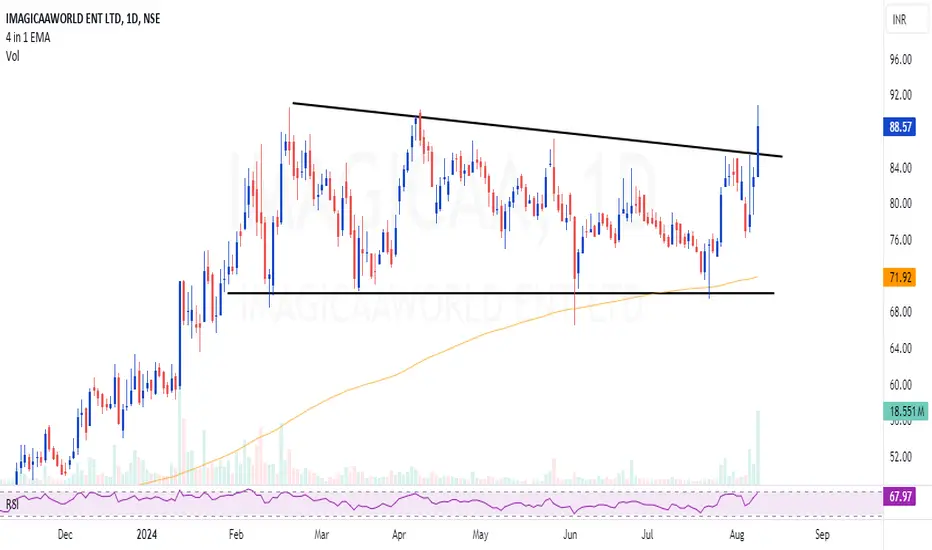
IMAGICAA | Simple channel breakout - Looks potential for 35-40%IMAGICAA | Simple channel breakout - Looks potential for 35-40% CMP : 88 (Dip : 75) SL : 65 Target : 140, 160 Longby srikartiram8
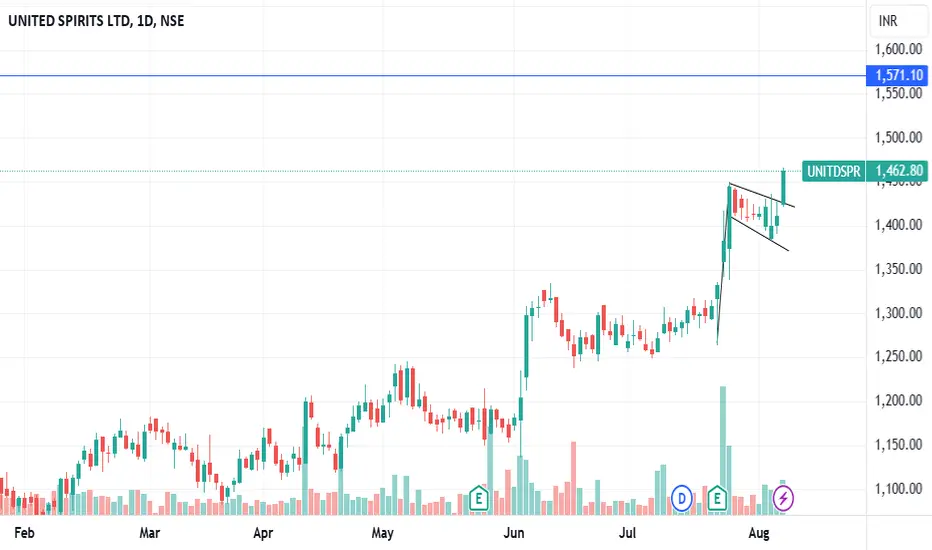
UNITEDSPIRIT F&P BREAKOUTUnitedspirit breaking f&p pattern with good volume building up strong rsi,trading above 20 ema #target can be 1570 sl 1375 EDUCATIONAL IDEALongby NeetikaSri8
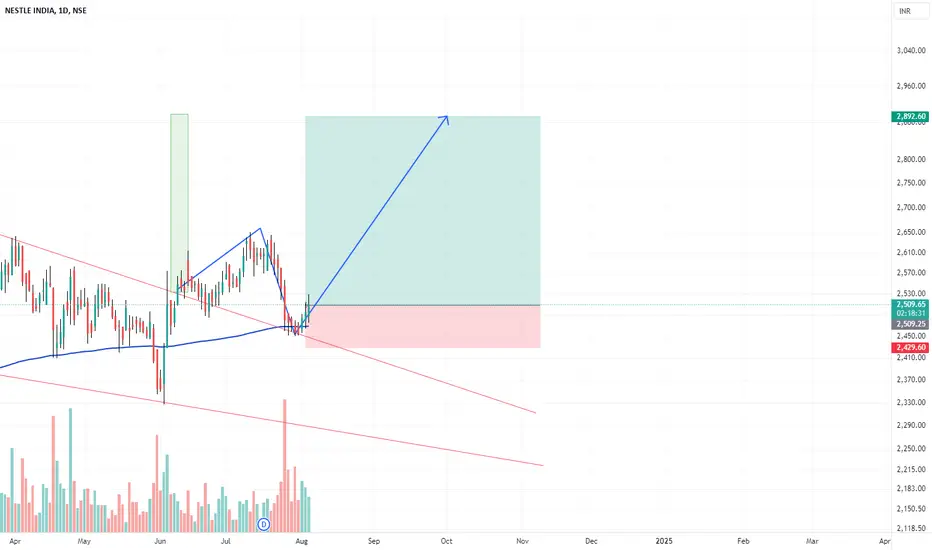
Buy Nestle India: Bullish Wedge Retest OpportunityTrade Idea: Nestle India recently broke out of a bullish wedge pattern and is now retesting the breakout level. Additionally, the stock has been rejected from the 200 EMA , which adds to the significance of the current setup. Entry Point : Buy at ₹2500 Stop Loss (SL) : ₹2427 Target Price : ₹2890 The setup offers a small stop loss relative to the potential upside, making it an attractive trade. Ensure to manage your risk and stay updated on market conditions. Disclaimer : This trade Longby kausar13n1
GMRINFRA weekly swing ideaBreakout and retest with good volume seen in this stock.. consistent support above 20 week moving average.. Bullish engulfing on weekly chart.. Entry around 98-100 Stop below 91 weekly closing basis Target 5 times risk Longby abhaychakravarthi4
PRICOLLTD Weekly chart for SwingConsistent support on 50 Week Moving Average.. Price action very strong.. Entry around 500 Target 1:3 RR 625++ SL 460 weekly closing basis Longby abhaychakravarthi1
MOTHERSONThe chart is self-explanatory and shared for educational purposes. The MOTHERSON stock trades above the 50, 150, and 200 moving averages. With a strong consolidation zone in stages 1 and 2. The stock could continue its upward momentum.Longby NK-PK7
ZYDUSLIFEThe chart is self-explanatory and shared for educational purposes. The ZYDUSLIFE stock is trading above the 50, 150, and 200 moving averages. The resistance level has been broken with a small correction and is now sustaining above it. This resistance could now act as support. Considering the current aspect, the stock could move further upward.Longby NK-PK3
Bajel Project, its reaction from 50 emaWhenever market weakness take it to 50 ema, it bounce back strongly : showing big players buying at so called "dip" And now after budget day shakeout it gapped up showing urgency and accumulating near old BO level. Check vols: Green > RedLongby takmanish0071
TATAMOTORS F&P BREAKOUT WCBTataMotors breaking f&p pattern on weekly basis with good volume RSI strong trading above 20 ema #target can be 1400+ EDUCATIONAL IDEALongby NeetikaSri7
DLF Chart set up and my trading strategyDLF We are looking at daily charts of DLF - the stock looks like trading in down trend channel since Apr 2024 - the stock is trading below both 21 day and 63 day EMA - 21 day EMA is below 63 day EMA - channel resistance around 840 Chart structure is looking weak - likely support zone around 200 day EMA which is currently around 769 Given the set up and my view, my trading strategy Sell DLF 29 Aug 2024 850 Call option currently around 19.5 Review point if DLF sustains above 842 on closShortby indiamarketoutlook15
Sonata Software - Breakout Strategy with volumes !!!Sonata Software has given a breakout of the price range with huge volumes. We can see price moving towards ATH. Other factors: 1. Tech sector is moving upwards 2. RSI is above 60 showing bullishness 3. MACD is positive 4. Fundamentally stock is great "Clean Charts, Easy Charts" Learning & Earning!! Cheers!!!Longby CleaneasychartsUpdated 4
SUZLON ENERGY 1 MONTHResistance Levels (Red Dashed Lines): Around 363.15 Around 278.55 Around 114.77 Recent Price Movement: The stock price is currently 57.83. The price has shown a significant upward movement recently, indicated by the blue candlesticks. The stock has broken above the 200 EMA, which is a bullish signal. The stock has also broken its 52-week high, further indicating a strong upward trend. ***Please note that this analysis is based on a limited time frame and should not be considered as finanLongby vinitsugandh28
Analysis of Hindustan Copper Chart (15 MIN Timeframe)The Hindustan Copper chart presents potential trading opportunities based on key resistance and support levels, coupled with the 50 and 200-period moving averages. #### Key Levels: - **Resistance Zones:** 335-347 and 355-375. - **Support Level:** 301.95. #### Trade Ideas: 1. **Long Trade:** - **Entry:** On a breakout above 325, confirming the bullish momentum. - **Target:** The immediate resistance zone around 335, providing a potential gain of 9.45 points (2.90%). 2. **Short Tradeby vinitsugandhUpdated 4
Budget day trading levels BN 23/07/24.Banknifty prior to the budget day closed flat and there are chances of a trending market owing to the news. On the hourly charts, the market has consolidation after the first hour candle. Consolidation is good to make the break out/ down to travel. Market is trading around the 20 ema and above 200 ema. If the market break below the moving average, trade using MA strategy can be entered. Major support levels :- 52160, 51940 Resistance levels :- 52420, 52630 Wait for the price action near theby TheMamboMomentum0
Bullish break out in the stocks for this week 08/07/2024.. ONGC is a government sector company is trading around the resistance zone. If there is a break out of the consolidation zone good returns can be captured in the stock. The stock has taken a good support from 20 ema which also gives a confidence to hold the stock for a swing trading. Even on the daily charts, the stock has test the 200 ema and chance of it clearing the resistance level is high. A round number figure of 300 can be seen as the next resistance as the stock will be trading in anby TheMamboMomentumUpdated 8
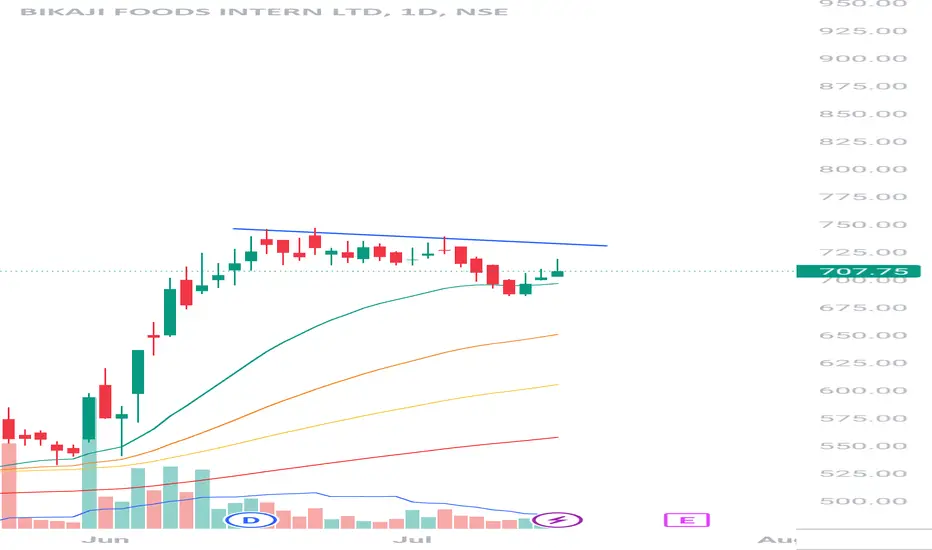
Bikaji foodBased on price moving and Ema positions Up move possibility is higher This is only for educational purposes. Longby selvat070
GODFRYPHLP Trade ideaWe are seeing a Double TOP of 44 Ma signaling a further uptrend. We get more confidence by seeing RSI taking support and also showing Double Bottom. Your buying point is The green candle that touches 44 Ma at number two. Buy above the High and stoploss below the low. A target of 1:2 or 1:3 should suffice. This is only for educational purposes as I myself am a trading studentLongby Sohamkarandikar1
WIPRO C&H BREAKOUT WCBWIPRO breaking c&h pattern weekly basis with good volume good rsi ,trading above 20ema #target 613-730 EDUCATIONAL IDEALongby NeetikaSri11
BRITANIA TRENDLINE BREAKOUT WCBBritania breaking resistance trend line on #weekly basis with good volume rsi is good,trading above 20 ema #target 6200 EDUCATIONAL IDEA Longby NeetikaSri5
OIL F&P BREAKOUT WCBOIL breaking f&p pattern on weekly basis with good volume and rsi, macd crossover done #target 580 soon EDUCATIONAL IDEA Longby NeetikaSri25
IIFL Finance - Perfect recovery candidate!!!!IIFL Finance is a perfect recovery candidate. Out of accumulation phase, it has given breakout and showing bullishness. Moving towards 650+. Others factors: 1. Breakout with volumes from accumulation phase 2. Volumes are building up 3. RSI postive 4. MACD positive 5. 20EMA crossing 200EMA "Clean Charts, Easy Charts" Learning & Earning!!! Cheers!!!Longby Cleaneasycharts4
SUN PHARMA, Technical Outlook and LevelsDuring the crossover of bands the price has been trading in the upper zone. The breakout of 1,525 will open the higher levels. Keep this stock on the radar. Disclaimer: This is my pre market analysis and my trading journal. Not a suggestion to buy or sell.by ssvirdiUpdated 311