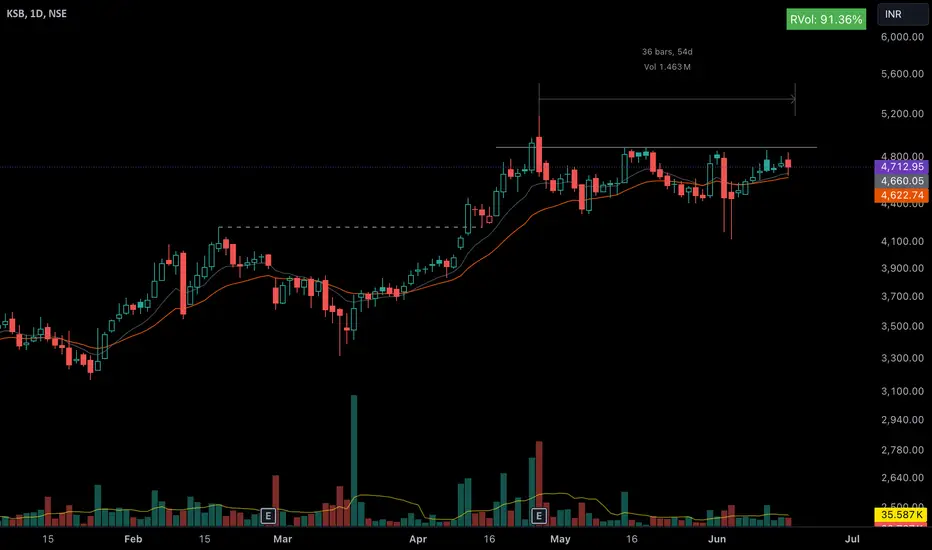
Moving Averages
MANKIND PHARMA, Fresh breakdown with a strong momentum.After the break of structure the price has successfully retested the upper levels now we have a fresh breakdown with a strong momentum. The price could test the lower levels of 2,056 and on my probability scale it is more than 55%.
Disclaimer: This is my pre market analysis and my trading journal. Not a suggestion to buy or sell.
ADANIGREEN, Technical OutlookWith a bearish cross of bands the price has been trading in the negative zone. From these levels the price could give a short trade of 9% to 10%. The level of R1-1,870 can be used as a maximum stroploss level.
Disclaimer: This is my pre market analysis and my trading journal. Not a suggestion to buy or sell.
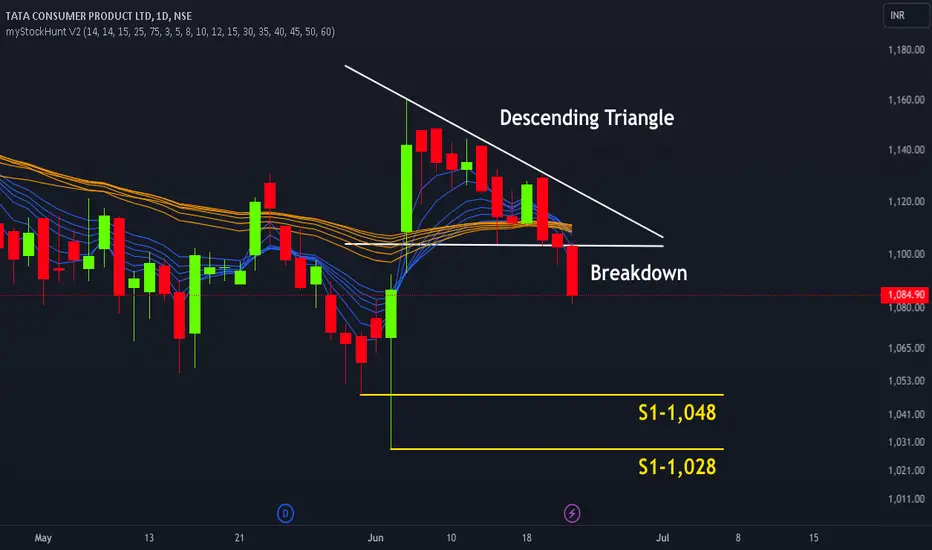
TATACONSUM, Breakdown of Descending Triangle PatternThe price has given a strong breakdown of Descending Triangle pattern. Also the degree and nature of separation in bands also indicates a downtrend. Hence we are in a downtrend and the price could test the lower levels of 1,048 and if broken then 1,028.
Disclaimer: This is my pre market analysis and my trading journal. Not a suggestion to buy or sell.
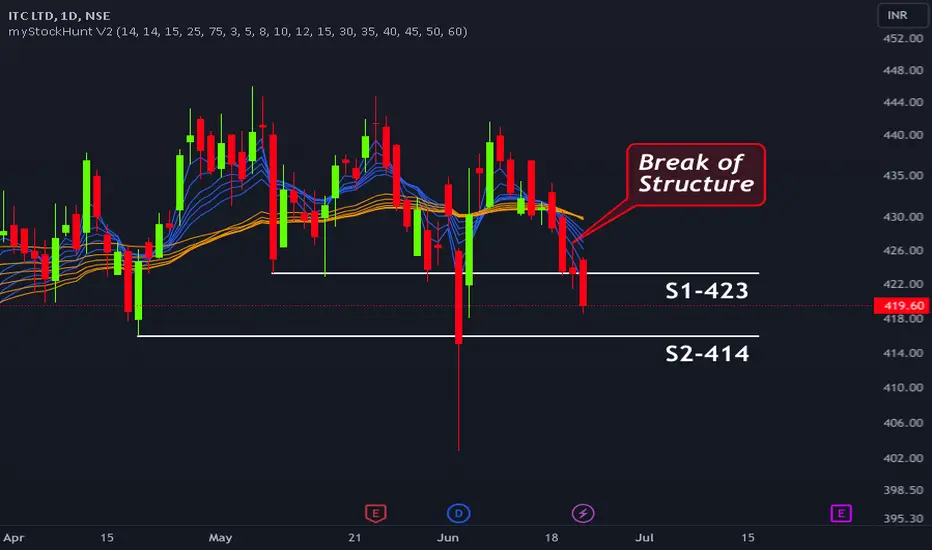
ITC Technical Outlook, Support Broken with a strong momentumToday an important support of 423 has been broken with a strong momentum having RSI below 40. The price could test the next support level of 414 and if broken then we go for 400.
Disclaimer: This is my pre market analysis and my trading journal. Not a suggestion to buy or sell.
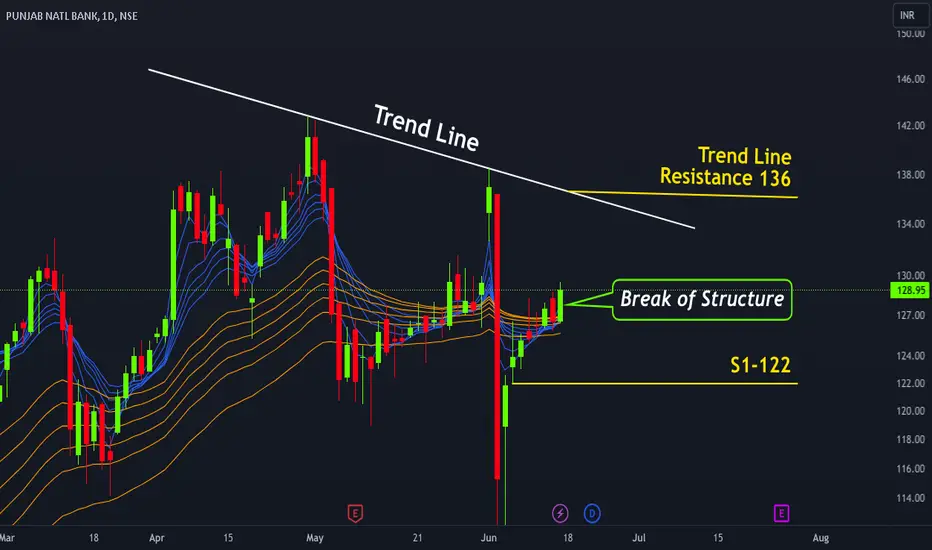
PNB, Intraday View for 21-JuneFor 3 consecutive trading sessions the price is strongly rejected by the level of R1-130. Still the price is trading in the positive zone. There is no change in the structure and in levels.
For tomorrow the intraday range is 130 to 136 and 126 to 122.
Disclaimer: This is my pre market analysis and my trading journal. Not a suggestion to buy or sell.
Nifty on Radar, View for 21-JuneThe price has been following a divergence pattern between rsi and price.
Today the price is rejected by the previous candle high. The breakdown of the level 23,334 could start a downtrend.
Disclaimer: This is my pre market analysis and my trading journal. Not a suggestion to buy or sell.
STEELXIND Channel & Falling Wedge BreakOutSteelxind had earlier given a channel breakout on 1D timeframe with higher volumes. It started consolidation after breakout and is now attempting to breakout from a falling wedge pattern on 1D timeframe. Go long after bullish closing confirmation. Follow stop loss rules.
Nifty on Radar, View for 20-JuneAfter making a new high the price has closed below the trend line. Also the formation of divergence between the price and rsi has formed. The probability of a retest is very high.
Disclaimer: This is my pre market analysis and my trading journal. Not a suggestion to buy or sell.
PNB, Intraday View for 20-JuneToday we have an indecisive candle in the positive zone. The probability of gap up or gap down is very high. But there is no change in the structure.
For tomorrow the intraday range is 130 to 136 and 126 to 122.
Disclaimer: This is my pre market analysis and my trading journal. Not a suggestion to buy or sell.
Radico Khaitan, Long Base BreakoutRadico Khaitan, a major alcohol manufacturer in a very long base(~200 days)
Long base = Big Breakout (check recent example Gravita India)
-Kind of Inverted Head n Shoulder too
-Good shakeout of 200 dema too
-Recovered fast from 4th june fall with good vol and price action.
PNB, Intraday View for 19-JuneThere is no change in the structure and the price has failed to close above 130.
But the price is still in the positive zone.
For tomorrow the intraday range is 130 to 136 and 126 to 122.
Disclaimer: This is my pre market analysis and my trading journal. Not a suggestion to buy or sell.
Nifty on Radar, View for 19-JuneToday we have a small hanging man candle on the top of the trend and with this we have a breakout of the trendline.
But still I will go for the Intraday trade, I will not carry any overnight position.
Disclaimer: This is my pre market analysis and my trading journal. Not a suggestion to buy or sell.
"๐ Castrol Stock Analysis: Bullish Signals & Targets๐ NSE:CASTROLIND Technical Analysis (Week Ending 16th Feb 2024)
Closing Price: ๐ต 207.70
Parabolic SAR: โ
Buy Signal @ 186.55
EMA & MA Crossover: ๐ Pending (Bullish Trend Support Expected Soon)
MACD:
MACDR: ๐ 6.95 (Crossing Signal)
Histogram: โ Positive @ 0.05
Stochastics RSI: ๐ K51.90 โก๏ธ D35.58 (Oversold Zone Exit)
%R (Williams Percent Range): ๐ Upward Trend @ 21.52
Fisher Transform: ๐ 0.58 (Bullish Crossover Mid-Range)
๐ฏ Targets:
First Target: ๐ฏ 213.55 (Recen
PNB, Intraday View for 18-JuneDuring the convergence of bands the price has given the break of structure on the upper side. For tomorrow the intraday range on the upper side is 130 to 136 and on the down side is 126 to 122.
Disclaimer: This is my pre market analysis and my trading journal. Not a suggestion to buy or sell.
Thomas Cook, one simple horizontal line setupTraveling is booming in India post covid.
And travel companies are enjoying this piece of pie.
-Posted growth YoY EPS growth, OPM% also improving.
-Near Major resistance, under which it is consolidating for 50 days (good consolidation)
-Good Shakeout, when price went below major ema (here 21 dema) and rally back (also known as MAU&R: Moving Avg Undercut and Rally)
-Tightness near resisantance.
-Signal Candle (5th n 7th June candles are white dot, which is more than 5% move with 1M vol) suggesti
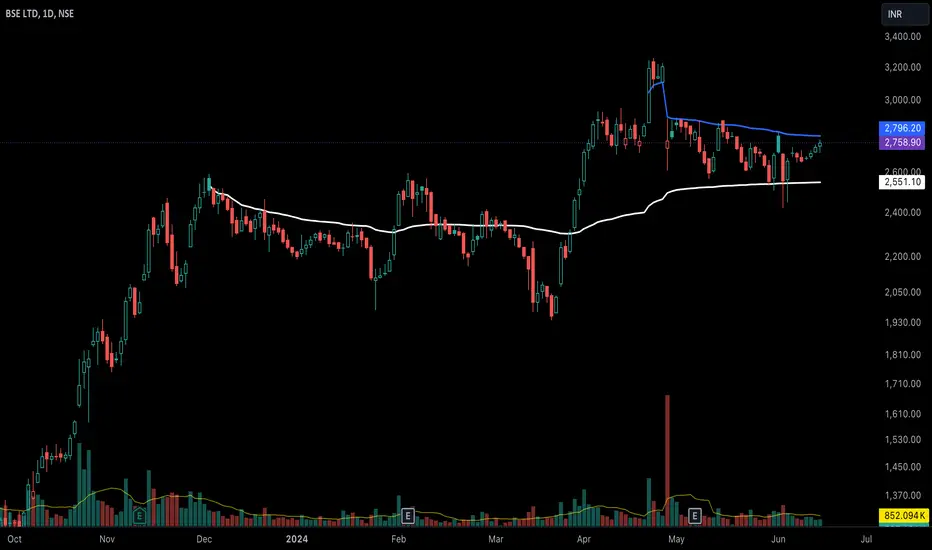
BSE, will it breach this AVWAP?Lets learn new thing:
AVWAP (stands for Anchored Volume Weighted Average Price): the average Price of a stock weighted by Volume from an Anchored point (swing low or swing high are good anchor points). Think like moving average but volume also include (not entirely true but to keep easy you can think like that) so it become more powerful as it involves both price and volume.
Now come to BSE, check white AVWAP how it was major resistance and gave fake breakout too. But when it breaches, it ga
JINDAL STEEL & PWRThe chart is self-explanatory and is shared for educational purposes.
Jindal Steel and Power stock has been trading above the moving averages, which have indicated a rising trend. It has strong trendline support and there are consolidation zones; post that, this zone has acted as strong support. Considering these factors, there could be an uptrend