AESI / ATLAS ENERGY SOLUTIONS INC | Cup and Handle PatternNYSE:AESI (Atlas Energy Solutions Inc)
Operates as a proppant and proppant logistics company.
It offers services to the oil and gas industry.
Entry Price :- 23.93
Entry Trigger Price :- 23.88
CMP
Stop Loss Trigger Price :- 23.18
Stop Loss Price :- 23.13
Moving Averages
Banknifty weekly analysis for 13/05/2024.Banknifty has been trading in a rising parallel channel which is a bearish pattern. The support trend line has been tested 4 times and it is testing it again, closing around it.
Even the weekly 20 Ema is around the closing of the candle. If there is a break down on the weekly candle after 2-3 days of consolidation or halt, there is a high chances of bearish momentum is the markets.
Major support/target levels:-46600, 45800
Let the market decide the trend and trade accordingly.
For last 8
ABB India LtdThe chart is self-explanatory and shared for educational purposes.
1. ABB India Ltd Stock: The stock of ABB India Limited is being discussed.
2. Technical Indicators:
o Moving Average: The stock is trading above its moving average.
o Breakout: It has broken out from the stage 2 consolidation zone, indicating potential upward movement.
3. Risk Management: The recommendation to trade with a stop loss is essential to manage risk effectively.
Remember to make informed decisions and consider risk man
Data Patterns Ltd: Analysis & Trading InsightsAnalysis:
Data Patterns Ltd. boasts a market capitalization of 15,747 crore with a high PE ratio of 94.90 and a beta of 1.09. Its 52-week high/low is 3,208.95/1,512.00.
The stock is currently exhibiting a descending channel pattern, finding support at the 200 EMA while facing resistance from the 20/50/100 EMAs. Friday's trading session, on 10/05/2024, closed with a doji pattern, indicating indecisiveness among buyers and sellers.
Despite its strong fundamentals, including a high PE ratio, PB
Zomato !!!!Hi Traders !!!
Zomato is good on the chart. The stock has taken support from 20 EMA and small swing trade of 52W high of 201 can be achieved with SL of 180.
Thank you !!!
ZLong
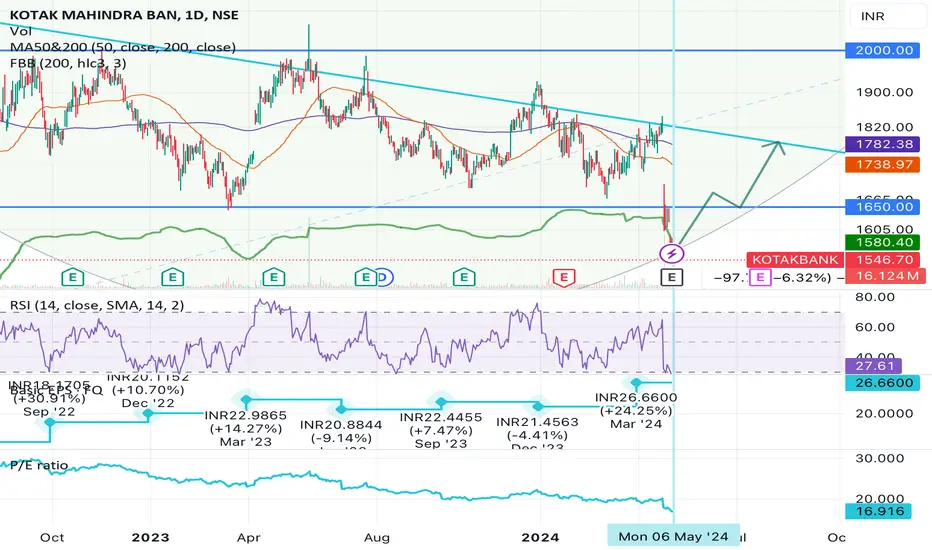
Kotak: Short term reversal (6 May onwards)On this Daily Chart, we can see that Kotak has made a recent swing low of 1546 on Friday after losing support from its 1650 level. The results were out yesterday and Kotak has announced 26% increase in profits beating the market estimates. This should potentially cause a reversal in price going forward. In the short term, price is likely to touch the 200D SMA (purple line) which also coincides with a trend line (in blue) creating an upside of about 15% from current levels.
Indicators:
1. The
Coal India-Intraday for 29-04-2024- Wait and watch trades.
Bullish
50 EMA has reacted last time and also golden crossover found in the recent trend.
Bounced from support
Buy May be above crossing strong resistance above 465.
Bearish
Trend-Over all downward to sideways range
Already rejection candle found at Resistance level.
Sell if any bearish signals found after rejecting from resistance level and
below 50 EMA and below 453
Leading indicators should give confirmations while taking trade(RSI, Stoch, Isolators, Volume)
UPL Intraday-Wait and Watch trades
Trend
15 Min-Uptrend
1 Day and Week TF- Downward
Key Level: 3rd Time Resistance retesting zone
50 EMA is key level which reacted many times
Bearish
Long Downtrend
Price Rejection from channel and Horizontal Resistance
Sell Below 50 EMA and 501.7
Bullish
15 Min Uptrend
Buy-After retracement and 50 EMA Reaction
200 EMA is bullish
Target and stoploss
5Points
Risk: Reward(1:1)
Leading indicators should give confirmation
while taking trade(RSI, Stoch, Isolators, Volume)
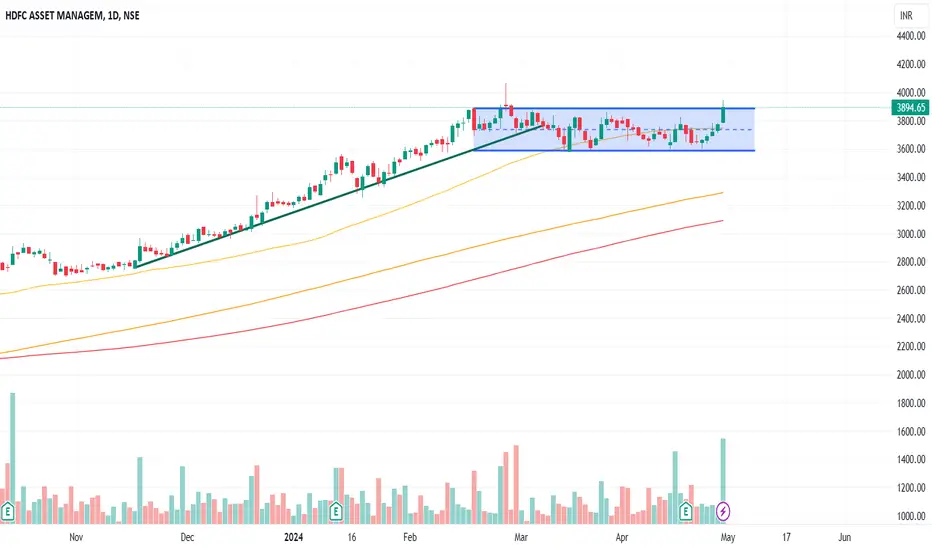
HDFCAMCThe chart is self-explanatory and is shared for educational purposes.
HDFCAMC stock is currently experiencing a prolonged consolidation phase, accompanied by high volume breakouts. Additionally, it is trading above the moving averages of 50MA, 150MA, and 200MA. Considering these parameters, it is expected to move in an upward direction.
Crude Oil Week April 29 to May 03
Time Frame: 1 Day
1. Rejection candles from Support zone and 50 EMA. Price has not allowed to break these key levels
2. Previous trend is bullish. Level breakout and under retracement
3. 50 and 200 EMA golden crossover
Time Frame: 4 Hr
Crude oil has bounced from previous key level(Resistance converted to support zone)
1. Trend is Bullish
2. Filled FVG and taken support for 50 EMA
3. Bounced from 200 EMA.
Entry above : 7046
Target: 7257 ( 211 Points)
Stoploss:6916 (130 Points)
Jb chemicalsChart form cup with handle pattern
Price move above the Ema 21,50 and 200
Stock in uptrend
JLong
Biocon-An underperforming pharma stockBiocon is among few stocks which did not participate in Pharma bull run.
However stock has recently given a big volume bounce from its demand zone.
295-300 is an important zone to watch out for as it is a confluence of trendline resistance as well as 200 Week EMA.
1st breakouts are normally traps so use pyramiding to save your capital.
If stock posts good results , we might see good move in stock.
Keep your eyes stuck on this if you like support bounce trades.
Network18 Media - Bullish Signals on the Horizon!Attention to all savvy investors! If Network18 Media & Investments Limited has been on your radar, here's why now might be the right time to consider making a move:
Strong Support on 200 EMA: Network18 continues to hold strong on its 200-Day Exponential Moving Average (EMA), a key indicator of long-term stability and a potential platform for growth.
RSI Above 50: Adding to the bullish sentiment, the Relative Strength Index (RSI) for Network18 is currently above 50. This is a crucial indica
Nifty monthly expiry levels for intraday trade 25/04/24.The index for last 2 trading session is consolidating in a range between 22350-22480 and is sustaining above the moving averages.
A halt candle has been formed after a gap down opening which signifies that the market may give a trending move in coming days.
The drop in the VIX has killed the option premiums and there was option buyers are waiting for a buying opportunity in the market.
Tomorrow is the monthly expiry for the index and as the market is behaving a move can be seen, if there is a