making higher highNSE:APARINDS small cap d a stock hai higer high banaya hai but linear movent nahi hai nale stop loss technically door lagda peyaLongby off2gaurav0
FinNifty intraday trading levels for weekly expiry 23/03/24.Finnifty has given a gap up opening and closed around the opening price forming a dragon fly doji. If there is a gap up opening, chance of filling up the gap is highdn even testing higher levels are high. Major resistance levels :- 21500, 21630 Tomorrow is the weekly expiry for the index and it has consolidated today. A trending move can be there in the index. Gap down opening in the market may take some opportunities in intraday and there can be a consolidation as today. Watch for the leveby TheMamboMomentum2
Nifty intraday levels for 23/04/24.Nifty has been trading in the bearish zone and might be this is the retest as it has closed around 61.8% fib level. Market has taken support from the previous low of around 21800 and recovered closing around 22300 levels. There was a consolidation after a gap up opening and it closed around the opening price. If the market gives a gap down opening, there will be chance of bearish move as the market recovered quickly from the low. Major support levels :- 22160-230, 22000 (round number) The maby TheMamboMomentum1
Shree Cement looking slight bearish on weekly charts.Shree cement has been in a bearish move and a retest to 38.2% fib levels is also there on the weekly charts. The stock is trading around 25500 levels and the price action formation is looking bearish. Bearish engulfing candle and rejection from 20 ema adds on to the confluence. Though the markets are trading at ATH and chances are there of a profit booking. If the stock start trading below the support zone around 24400 levels, a shorting opportunity may be captured in the stock. The stby TheMamboMomentumUpdated 1
Axis bank looking bearish on higher time frame. Axis bank has been trading around the higher level and is forming a base near 1030 zone. Both side movement can be there in the stock and confirmation is need for the entry to trigger. But the stock on the weekly chart is showing some bearish RSI divergence and the dropping strength can be the initial signal of a bearish move. On the daily charts, it is around the 200 ema. Either it will breach the levels or take support from the same. Watch for the levels and price action. If the stock staby TheMamboMomentumUpdated 12
Beam shortKRAKEN:BEAMUSD SHORT AS ITS HIT THE EMA 200, at is preparing for a descent.BShortby Manan_Bansal1230
Positional Trading Idea on Cantabil RetailNSE:CANTABIL If stock crosses above 220 which is above Super Trend reversal level as well as Break Out level then the 1st target is around 233 level and 2nd target near 248 level on 1 Hour chart. Trailing Stop Loss below 20 period Moving Average and Super Trend support whichever is low.Longby RKMAURYAUpdated 4
Indus Tower Ltd Stock AnalysisThe chart is self-explanatory and shared for educational purposes. 1. Indus Tower Stock: The stock of Indus Towers Limited is being discussed. 2. Technical Indicators: o Moving Average: The stock is trading above its moving average. o Trendline Support: It has support from a trendline. o Breakout: There has been a breakout, indicating potential upward movement. 3. Cautionary Note: While the technical analysis suggests a positive outlook, it’s essential to conduct thorough research, consider broaLongby NK-PKUpdated 5
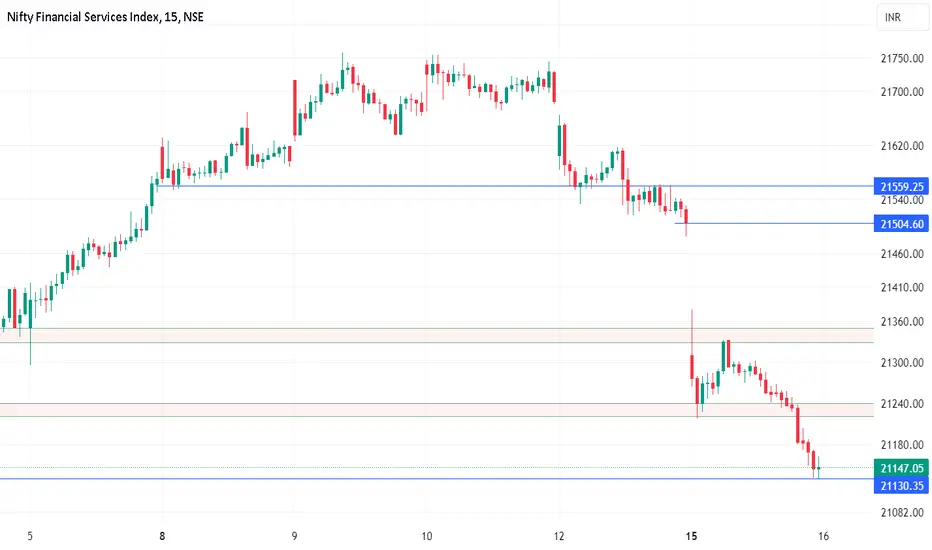
FinNifty weekly expiry analysis for 16/04/24.Finnifty weekly expiry levels Major support levels :- 21130, 21000 Resistance :- 21330, 21500 The market is looking bearish and chance of a gap down opening is there as the closing is around the day's low. On the hourly charts, the market is trading between both the moving averages. A support around 200 ema can be seen. In case of a flat to slight gap down opening, a consolidation in a range and break down in the second half can give a nice trending move this expiry. Wait for the price acby TheMamboMomentum4
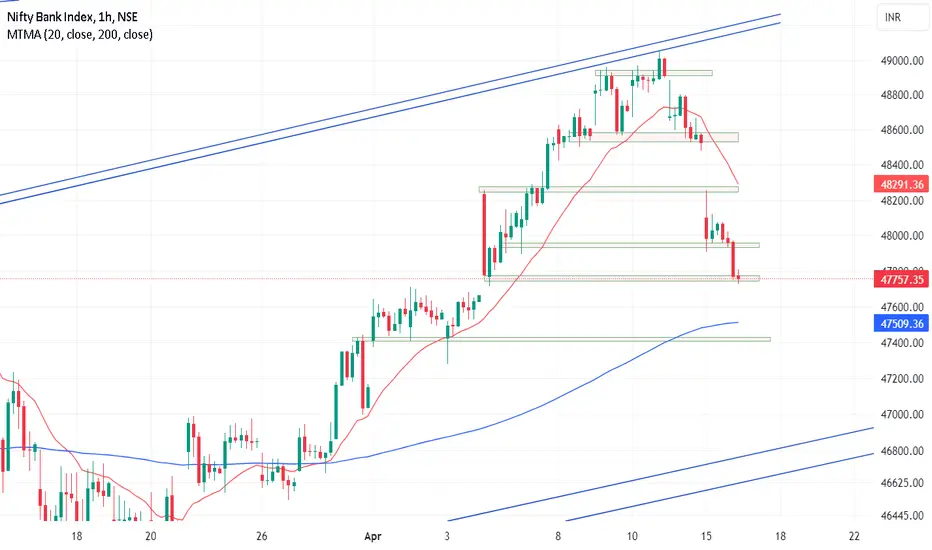
Banknifty weekly expiry analysis for 16/04/24.The market has reacted to the war situation and has given a fall of around 800 points. Banknifty has taken support from the 20 ema on the daily charts and the support zone around 47740 level. Even on the hourly charts, the market is trading between both the moving averages and chances of taking support around 200 ema is there. Tomorrow is weekly expiry and there is chance of a trending expiry move in the market as last few expiry were side ways. Major support level :- 47750, 47400. The marby TheMamboMomentum6
EBAY | Looks high probable setup for 60%EBAY | Looks high probable setup for 60% CMP : 51 SL : 45 Target : 80 Longby srikartiram12
Nifty prediction for tomorrow 12 APR 24As we discussed NIFTY yesterday, it ended sideways. If we look at the chart now: the market is trading ATH in the zone where it got heavy selling from this region. NIFTY is going to be sideways unless it breaks the GREEN trendline to the downside. The inside marked region (22617-22766) is sideways. If we look at the OI data: PCR = 1.21, which indicates the bullish market. 23200 CE have been written heavily. Other strike prices do not have significant writing. Everyone is in the wby finnova_Updated 439
All time high breakoutGood volume buildup in the past few candles both in daily and weekly timeframe. All time high breakout with good volume, if breaks the high of current candle then good opportunity for long or else wait for retest conformation. Price has taken support twice from 200EMA, good sign for bullishness. NOTE: i do my analysis, do your before trade.Longby GreyandWise2
#Escorts about to fly 🚀 🔥 #Escorts about to fly 🚀 🔥 -CMP 3072 - monthly resistance broken -trendline breakout -rising volume -Tgt 3200|3430|++Longby PivotXplorer6
GNFC Best Swing Idea! 🔥Greetings traders!📈 Today, I'm thrilled to present an intriguing setup on GNFC, showcasing a positional breakout scenario complemented by volume analysis. Here's a closer look at the setup: 📈 Setup: HORIZONTAL BREAKOUT SETUP 🔍 Analysis: Extensive analysis across various timeframes confirms the breakout potential. 📊 Indicator Support: Momentum indicators are providing robust backing to the bullish momentum. 📈 Keywords: Strong volume participation, comprehensive multi-timeframe analysis, bolstereLongby Uday_Mandal1
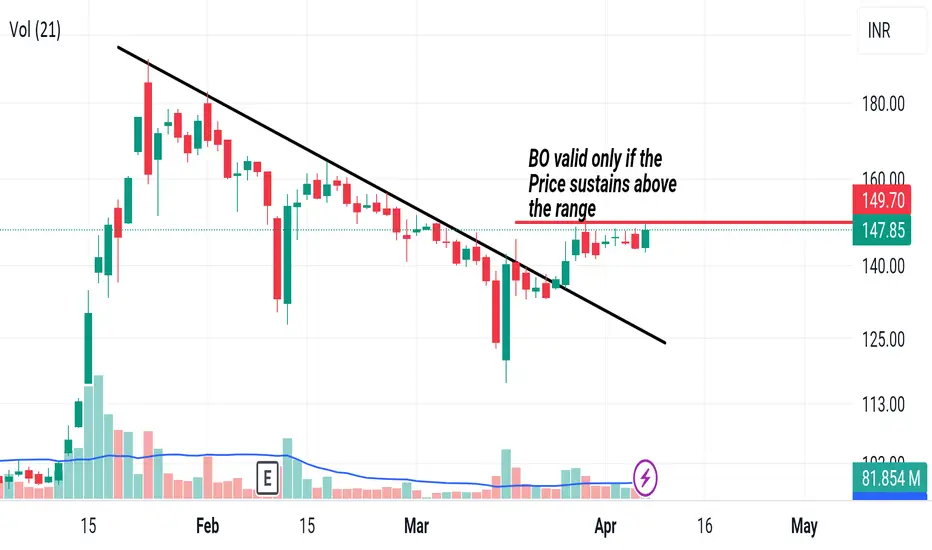
#IRFC on the verge of breakout🚨🔥 #IRFC on the verge of breakout🚨🔥 -CMP 147.8 -Trendline breakout -consolidation after breakout -volume risingLongby PivotXplorer125
 LongLong


 Long
 Long

 Long
 Long
 Long
 Long
 Long