Opening Short on one of IT - INFOSYS.Hey Folks,
I have been tracking an opportunity in Nifty IT ( Check out - related published idea on Nifty IT).
Today all Index fell again. and a very Hopeless fall could be seen in NIFTY IT as well.
So the support level of 1325 on Infosys broke today. and I opened a position with a put option on INFY 30MAR 1300.
the Target on the underlying is 1185.
SL is 3% of the capital used.
Moving Averages
MMTC Monthly ChartMMTC is broadly in uptrend formation, price has taken a support of Trendline and Monthly 50 EMA (blue line).
Price of MMTC may rally upto the marked red zone on the chart (tested supply zone) in the upcoming months, strict SL at 44.50 (previous low of the price as marked by red line on the chart).
Only for educational purposes, not a trade recommendation.
Short Trade – HPCL
• Instrument: Hindustan Petroleum Corporation Limited (NSE)
• Timeframe: 125-minute
Technical Setup
• Confluence Zone:aligned with the 21-period DEMA.
Higher time frame suggest bearish continuation
• Price Action: The stock has rejected the confluence zone, showing weakness below resistance.
Trade Plan
• Bias: Short (bearish)
• Entry Zone: Near 447–449 resistance confluence
• Target: Retest of recent lows around 431 and potentially lower if momentum continues
• Stop-Loss: 25%DATR above th
CIE Automotive India (D): EMA Golden CrossoverThe 50-Day EMA has crossed (or is actively crossing) above the 200-Day EMA around the ₹426–₹427 zone today. This is a significant trend-reversal signal.
Since the price is sustaining above this crossover zone (trading at ₹467+), it confirms that buyers are defending the average price of the last year.
The Context: The stock is trading near ₹466–₹469 , reacting positively to fresh news.
Petronet Lng Ltd (D): EMA Golden CrossoverThe 50-Day EMA is crossing above the 200-Day EMA (both converging around the ₹288–₹290 zone) right now on the Daily timeframe. This is a premier long-term bullish signal, confirming a shift from a downtrend to a structural uptrend.
The Price Action: The stock is trading strong near ₹306, comfortably above all key short-term and long-term moving averages.
HEG Ltd–Strong Reversal with Volume Expansion| Breakout Brewing?NSE:HEG
HEG has printed a strong bullish candle with above-average volume, showing clear demand absorption near short-term moving averages.
What I’m Observing:
Price holding above 20 / 50 EMA cluster
Strong bullish candle after minor pullback
RSI bouncing from mid-zone (bullish reset, not overbought)
Volume expansion on upside candle
This looks like a continuation attempt inside a broader higher-high structure.
Key Levels
Immediate Resistance: ₹575–585 zone
Support Zone: ₹520–525
Invalida
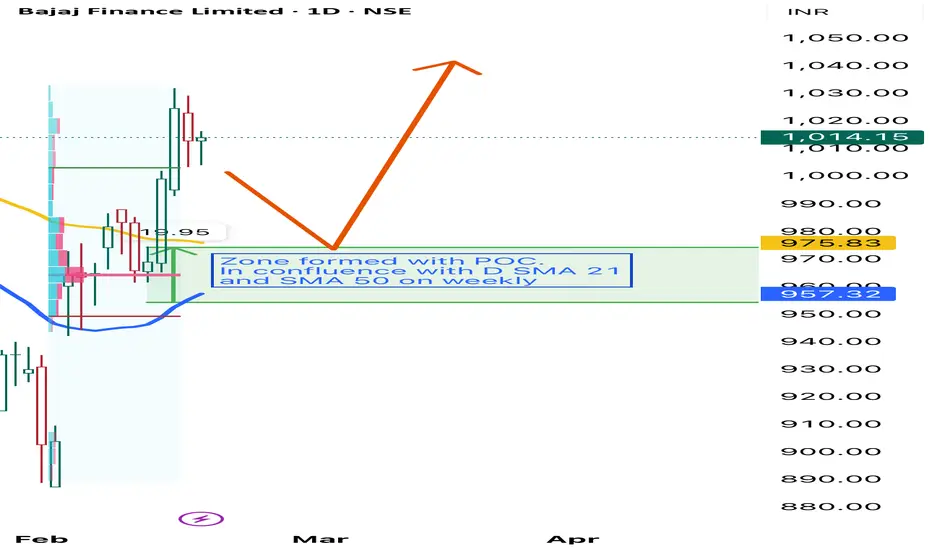
Long Trade Setup: Bajaj Finance• Zone Highlighted: marked as a demand zone with POC.
Trade Thesis
• The highlighted zone acts as a support area, aligned with both the 21-day and 50-SMAs on the weekly chart.
• Price has bounced above this zone, suggesting buyers are defending it.
• The upward arrow indicates potential continuation of the bullish trend.
• Risk–Reward Ratio: 1:3 (favorable).
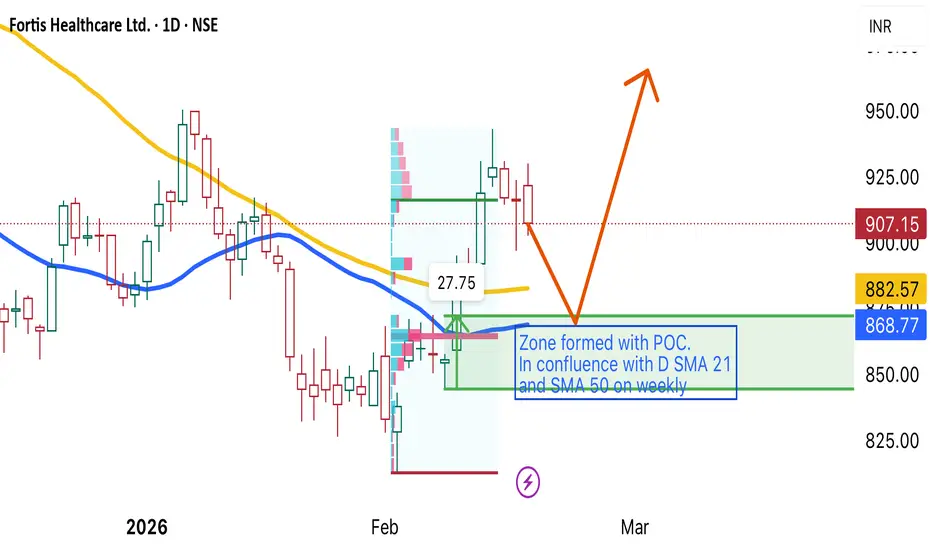
Fortis Healthcare Ltd : Long Trade SetupEntry Zone:
Price has pulled back into a strong demand area formed around ₹882–₹868, which aligns with:
• Point of Control (POC) from volume profile
• Daily SMA 21 support
• Weekly SMA 50 confluence.
Rationale:
The confluence of moving averages and volume profile support suggests institutional buying interest. The recent corrective move appears healthy within the broader uptrend, offering a favorable risk-reward setup for long trade.
Torrent Power (D): Aggressive Bullish(Timeframe: Daily | Scale: Linear)
Overall View: 🐂 Aggressive Bullish (Catalyst-Driven Breakout Attempt)
The stock is challenging the upper boundary of a year-long consolidation phase. Backed by a major acquisition and robust earnings, the current test of the ₹1,490 resistance has a high probability of succeeding.
🚀 1. The Fundamental Catalysts (The "Why")
The technical surge is heavily backed by recent corporate actions:
> The L&T Deal: Acquiring Nabha Power (1,400 MW capacity) expand
ABCAPITAL – Ascending Structure | Range Breakout Loading? NSE:ABCAPITAL
Aditya Birla Capital is showing a strong higher-high, higher-low structure after a clean trend reversal from sub-₹170 levels.
Technical Observations:
Price trading above 21 & 50 EMA – bullish structure intact
EMAs aligned positively (21 > 50)
Healthy consolidation just below resistance
Volume stable during consolidation phase
Key Levels:
Resistance: ₹365–370. (Above 370, Breakout Entry)
Support Zone: ₹330–335 (For pullback Entry)
Trend Support (50 EMA area): ₹320
Invalida
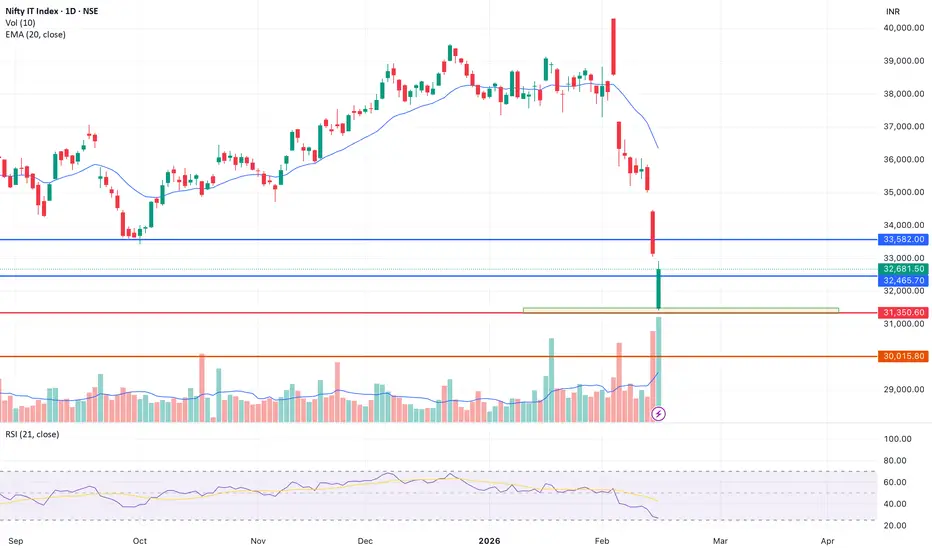
Nifty IT in trouble? An Opportunity to make quick buck?Hey folks,
Today I am talking about the NIFTY IT 's massive sell-off in past 10 days. and yesterday session was with a huge gap down.
Major IT stocks that has crashed in this sell of are -
TCS : slipping to its 52-week low
Infosys : 6% drop in last trading session, to hit new 52-week low
Wipro : 4% drop to also hit 52-week low.
L&T : dropped to its 52-week low.
Considering huge selling, bringing these stocks to a cheaper rates could attract buyers in next few session, as we alrea
ETH on to the reversal.Hey folks,
I am seeing 4h TF of ETH. the coin is testing the price of 2100 from a quite time now.
50EMA support can be noticed now on the current 4hr candle. i.e after the downward rally ended first time 4h tf candle closed above 50ema.
there is a potential reversal to the true value of ETH soon.
My Trade Setup :
Early Entry : 2050 to 2100
confirmation Entry : above 2100
SL : 1990
TP : 2375
R:R = 1:3
:) Thanks. Happy Trading.
Trade Catalyst Series // Episode 3 // MOTHERSONI am back here with another episode of Trade Catalyst with another Stock -- Samvardhana Motherson International Ltd.
It is one of the world's Largest and most diversified auto component manufacturers.
In past one year the company has shown a strong financial recovery, aggressive acquisitions and significant re-rating of its stock.
last quarter - Q3Dec25 :-
Revenue Growth : +13.5% YOY
EBITA Margin : improved 9.7%
PAT : up 9% yoy
The growth was majorly fueled by acquisitions of Nexa
NIFTY50 // BULLISH ENGULFING // 4HR TFHey folks,
I am looking here at the 4hr TF of Nifty 50 with EMA 50.
A visible Bullish engulfing on the 4hr tf has formed today above 50EMA, confirming the support of the moving average.
I know it is not a perfect bullish engulfing some of you might say, because of current 4hr candle open was not below previous one close. But in Chart analysis there is a rule that you to be versatile and flexible regarding these patterns, so it can be said that the two said price points are marginally close
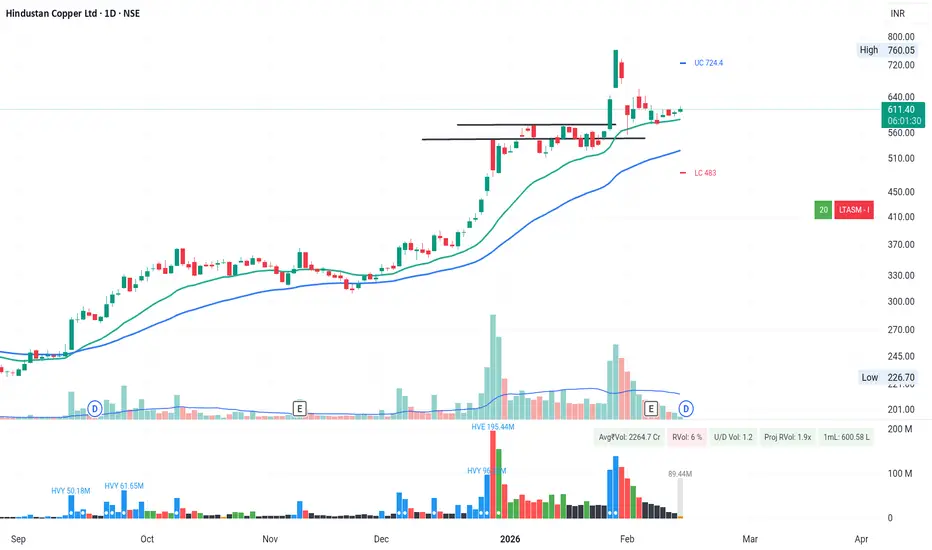
Hindustan Copper – Breakout, Retest & Bullish Continuation SetupNSE:HINDCOPPER
Hindustan Copper has delivered a powerful breakout followed by healthy consolidation near highs — indicating strength rather than exhaustion.
Technical Observations
Breakout zone: ₹570–₹590 area (now acting as support)
Current structure: Flag-type consolidation near highs
Volume: Expansion during breakout, contraction during pullback (healthy)
EMA alignment: 21 EMA > 50 EMA (bullish structure intact)
Momentum is cooling slightly but price is not breaking down — this indicates
TITANThis analysis is for educational purposes only. TITAN stock chart shows strong bullish momentum, with price trading well above the 50, 150, and 200-period moving averages (MAs), and the MAs stacked bullishly (50 > 150 > 200). This alignment indicates sustained upward trend strength, as shorter-term MAs are above longer-term ones, confirming positive short, medium, and long-term biases. always use a stop-loss to mitigate risk
LTIM — Corrective Rally Exhaustion, 3-Wave Decline in FocusThe advance in LTI Mindtree Ltd (LTIM) from 3,802 is interpreted as a corrective ABC structure , rather than the start of a fresh impulsive trend.
Wave A advanced to 5,554.50
Wave B corrected lower within a falling channel , ending near 4,939.50
Wave C unfolded in five waves and terminated at 6,429.50, accompanied by bearish RSI divergence , signaling momentum exhaustion
Price has now closed below the 50-DMA , indicating weakening bullish momentum. However, Wave (a) is still ev