HCLT - Buy - Technical Analysis#HCL Technologies Limited - Technical Analysis
Price: 1,683.00 |
#Trade Setup - Bullish Reversal
#Outlook
Strong bullish setup with 4-35% upside potential. The failed bearish head & shoulder pattern combined with monthly demand zone bounce suggests institutional accumulation. Breakout above 1,745 opens path to 1,951 and beyond.
Pattern Analysis:
1. Bounced from monthly demand zone - Strong support established
2. Made higher low in monthly chart - Trend reversal signal
3. Failed Bearish Hea
Multiple Time Frame Analysis
Nifty 50 Price Structure Analysis [08/12/2025: Monday]Top-Down Nifty 50 Price Structure Analysis for 08th December 2025. The day is Monday.
(1) Monthly Time Frame:
Red paper umbrella candle. The body is smaller compared to the lower wick. So far, it is an indecisive market. The main trend is bullish, but the present scenario is indecisive. The major support zone is at 26100 and 26000. Major resistance is at 26300. The view is bullish to indecision.
(2) Weekly Time Frame:
Red paper umbrella candle. The body is smaller compared to the lower
Chambal Fertilizers: Exhibits Short-Term WeaknessChambal Fertilizers has recently displayed signs of short-term weakness on its daily chart. The price action indicates a struggle to maintain a position above the 200-day EMA, a widely recognized long-term trend indicator. Despite multiple attempts to close above this crucial level, the stock has been unable to sustain any significant upward momentum, suggesting a prevailing bearish sentiment among market participants.
From a momentum perspective, both the RSI and MACD indicators are curren
Coforge (D): Strongly Bullish, Triple Top BreakoutTimeframe: Daily | Scale: Linear
The stock has confirmed a major breakout from a 6-month consolidation structure. By closing above the triple-test resistance zone, the "bearish" triple top pattern has been invalidated and converted into a bullish breakout .
📈 1. The Long-Term Structure (The Reversal)
> The Cycle:
- Peak: ATH of ~2,005 in Dec 2024.
- Correction: A downward spiral until April 2025 .
- Turnaround: Since April, the stock has shifted structure to Higher
Is this a sign of REVERSAL!?As we can see NIFTY has formed more like a doji candle which shows immense indecision despite the strong weakness. It can also be been that this candle has been formed around the trendline hence unless this candle's low is broken and sustained below, every dip can bought. So, plan your trades accordingly and keep watching everyone.
Will NIFTY take support at 26000 !?As we can see finally fell from our level as soon as it broke and fell unidrectionally as analysed. Moreover we can see it is trading around important psychological level of 26000 which is also a important demand zone, moreover it is also trading at important trend line support so any signs of rejection from this trend line could show strong reversal so plan your trades accordingly and keep watching everyone.
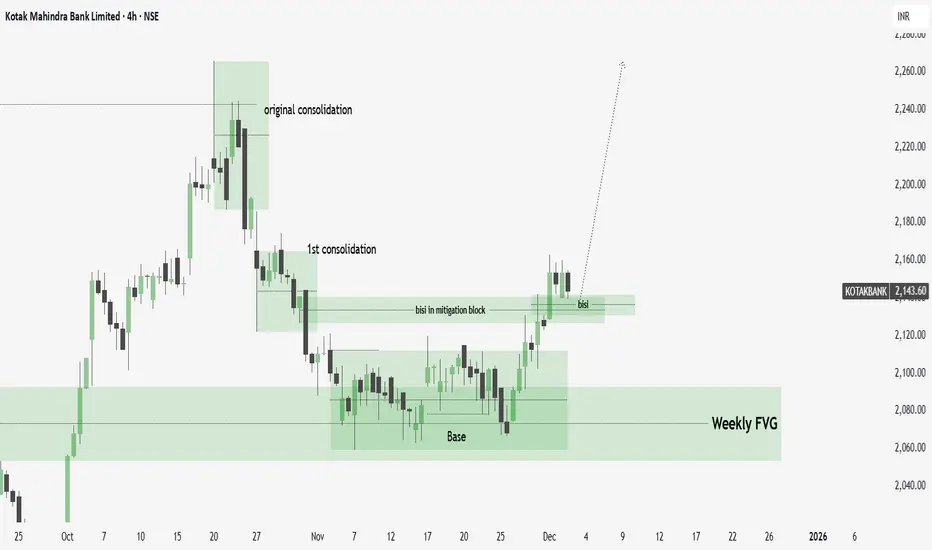
KOTAK Bank: Weekly Liquidity Sweep → H4 MMBM Signals Buy-Side ExI am sharing a trading idea on Kotak Bank based on Smart Money Concepts (SMC).
Price has already taken weekly ERL (External Range Liquidity) and then moved back into IRL (Internal Range Liquidity), indicating a higher-timeframe liquidity grab and potential rebalancing phase.
On the H4 timeframe, price is forming a Market Maker Buy Model (MMBM).
The sell-side curve has been completed, suggesting downside liquidity has been fully taken. After this, price has started transitioning into the buy-si
Still INDECISION despite the unidirectional fall!As analysed NIFTY did fell and had been unidirectional despite its strong opening as it couldn't sustain itself above its ATH which was well anticipated and has been analysed in our previous post. Now, despite the fall, it couldn't close itself below 26150-26100 level which could have confirmed to weakness. so, one must trade once these levels are breached and sustained.
Nifty 50 Analysis (Based on Your 4H+1D Chart ) Key Observations from Your Markups (ICT Style):
1. Price is sitting inside a 4H FVG (26,110–26,170 zone)
This is acting as intraday demand / discount region.
Price bounced here previously and is testing it again.
2. Multiple PDH levels above + Weak High at ~26,320–26,350
This cluster suggests **liquidity resting above.
If price reclaims PDH → expect a sweep toward the weak high.
3. PDL is protected (~26,070–26,090)
Clean liquidity pool below.
A sweep into PDL + FVG confluence gives high-pr
NIFTY can show unidirectional move from here!As we can see NIFTY is showing signs of indecisiveness from its ALL TIME HIGH and as per previous post, we also discussed previous swing can act as a resistance. We can expect NIFTY to show strong upmove above 25300 based on strong GDP quarterly posting hence we must keep these levels under observation and plan our trades accordingly.
1-Day (Daily) & 4H Chart — What It Says Now🔎 1-Day (Daily) Chart — What It Says Now
📌 Moving Averages Extremely Supportive
All key moving averages — 5, 10, 20, 50, 100, and 200 DMA — continue to trend upward, with price comfortably trading above them.
This alignment reflects:
strong underlying demand
a sustained uptrend
buyers active on dips
Trend structure: Clean, bullish, and stable.
📌 Momentum Indicators Point Upwards
RSI (14) hovering in mid-60s → bullish but not overbought
MACD remains in positive territory, signal line cros
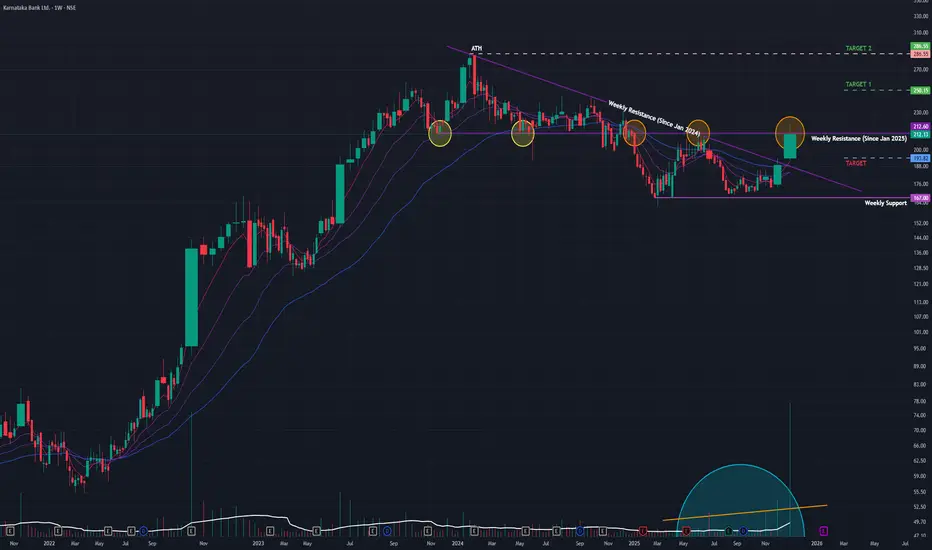
Karnataka Bank (W): Bullish, Vol-Backed Breakout at ResistanceTimeframe: Weekly | Scale: Logarithmic
The stock has confirmed a breakout from a 10-month angular downtrend. This move is backed by the highest weekly volume in years, driven by smart money entry. However, the stock is currently pausing at a critical horizontal supply zone.
🚀 1. The Fundamental Catalyst (The "Why")
The massive 149 Million volume is a direct reaction to a major news event:
- The Catalyst: Reports indicate that high-profile investors have picked up a significant stake (a
ATH is here for NIFTY! What's next!?As we can see NIFTY has finally achieved new ATH which also a previous swing and as per technical POV, this swing can act as a RESISTANCE. Hence any signs of rejections from here can be considered an opportunity to short. moreover, no fresh positions should be made at current levels.
Strong PSU Bank - Indian Bank - Strong BuyIndian Bank - Swing to Short-Term Investment Report
Current Price: 653.10
TECHNICAL SETUP OVERVIEW
Analysis Type: Monthly Chart | Investment Horizon: Short to Medium Term (6-18 months)
Key Observation: After a historic breakout from multi-year resistance, Indian Bank has established itself as a solid structure for accumulation with exceptional return potential.
BREAKOUT TIMELINE & PATTERN
Historical Resistance Battle (2018): Successfully tested 5 consecutive months.
Major Breakout (January
Cholafin Long - Investment Ideas & AnalysisTechnical Analysis : Cholamandalam Investment and Finance Co. Ltd.
Current Price: 1,610.30
Multi-Timeframe Technical Analysis
Weekly Timeframe Pattern
The stock has formed a **Cup and Handle** pattern on the weekly chart, which is traditionally considered a bullish continuation pattern. This pattern suggests potential accumulation and a possible breakout scenario.
Daily Timeframe Analysis
On the daily chart, a * *Bullish Pennant* * formation has developed, indicating consolidation after a
Strong RECOVERY and CLOSING! What's next!?As we can see NIFTY showed strong upmove but we still need confirmation of weekly candle for bull run continuation hence following the structure, we may see a continuation of upmove but will only be confirmed if candle closing is seen in weekly time frame so plan your trades accordingly and keep watching everyone.
SHARP recovery coming up above 26000!?As we can NIFTY closed below 26000 which was against our expectations and was only valid if we were above 26000 levels. Now as long as we are below 26000, we are bearish until we sustain above 26000 for another strong upmove so plan your trades accordingly and keep watching everyone.
26000 will act as a SUPPORT now!As we can see NIFTY managed to close itself above 26000 level which was both a strong resistance and psychological level and closes both in daily as well as weekly time frame. Hence, following the structure we can confirm the NIFTY’s breakout and we can expect NIFTY to take support at 26000 levels which previously acted as a resistance. So, one can plan their trades accordingly keeping SL on closing basis below 25800 .
Strong upmove coming up above 26100!As analysed, following the structure, we can still see NIFTY in more like an inverted head and shoulders pattern which is a strong bullish pattern. Hence now that it has managed to close above 26000 which has already been tested multiple times before can now show a very strong upmove above 26100 which is a neckline of the structure so one can go long if breaks above given level so plan your trades accordingly and keep watching everyone.