XAUUSD LongFriday ending session setting the Directional bias for next week. Monday it can start with retracement to the demand zone and then continue to push up to target the external liquidity, which is Daily high or prevision trading day as well as day before that. Since both previous day made Equal high.
1. Daily closing with Big price rejection.
2. We have change of character in 1min, Leaving behind imbalance as well as Equal low.
Multiple Time Frame Analysis
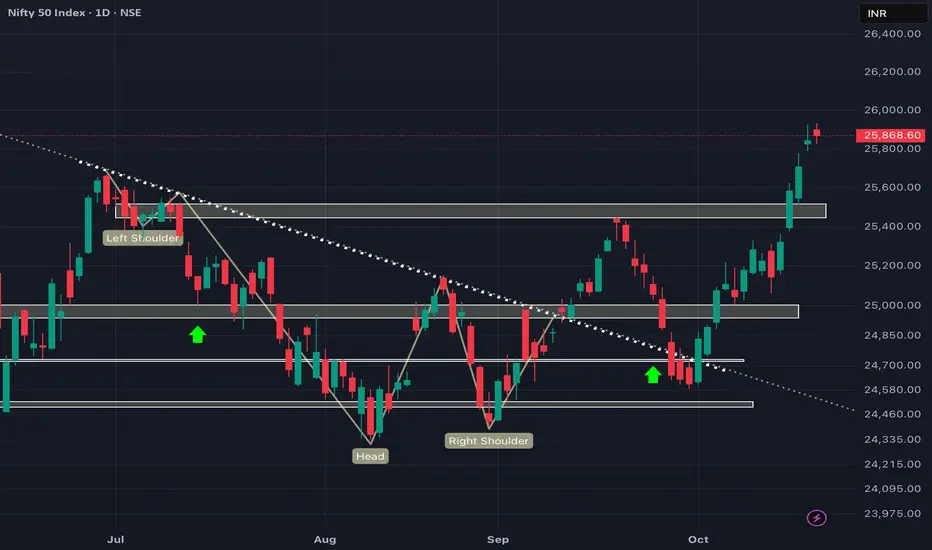
Signs of REVERSAL!!? As we can see NIFTY showed strong rejection forming marabozu candle in daily time frame showing rejection from 26000 levels as explained in previous post. Moreover, we can see NIFTY has filled the pending gap and hence we can expect NIFTY tp show weakness from here and hence until and unless NIFTY sustains itself above psychological level of 26000, every rise can be sold so plan your trades cautiously and keep watching everyone.
Torrent Power - Short Term Investment IdeasTorrent Power Limited - Technical Analysis Report
Current Market Price: 1,328.40
Opportunity: The Stock is Trading at 40% discount to intrinsic value, presenting a potential value investment in the #Integrated #powersector.
Technical Setup: Stock testing critical 20 #EMA support on monthly timeframe after forming #HiddenDivergence #pattern. Recent decline suggests caution but oversold conditions emerging.
Technical Snapshot
Trend: Monthly chart shows trend continuation pattern with classic d
NIFTY looks strong but not STRONG ENOUGH!!?As we can see NIFTY has finally breached its previous swing but is showing signs of rejection around 25900-26000 levels as it is now trading at important GAP which has been filled and cam act as a resistance as long as NIFTY doesn't sustains itself above 25900-26000 psychological level every rise can be sold as it could be a possible trap leading to sharp fall. Moreover one who had been rallying this uptrend from our zones should start booking partially and wait for signs of reversal or sustainm
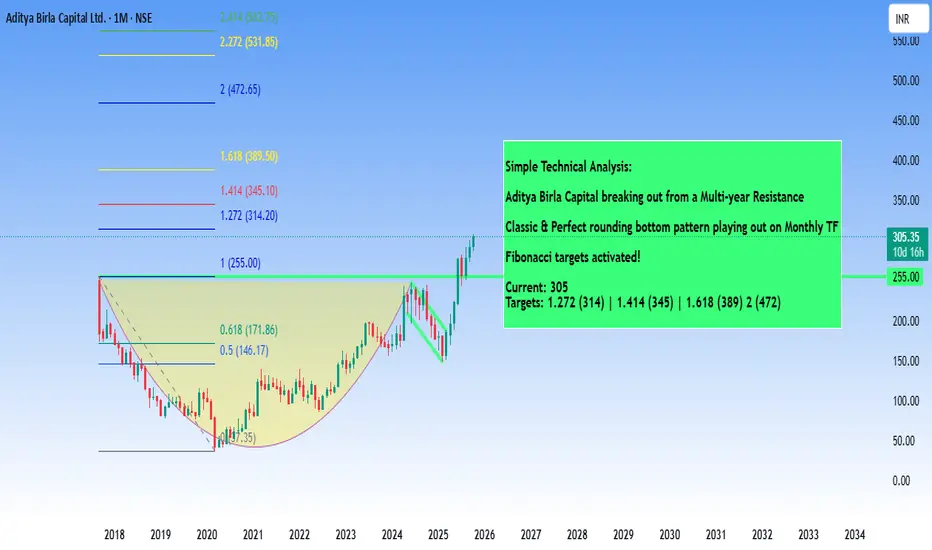
AdityaBirlaCapital - Investment IdeasAditya Birla Capital Ltd - Technical Analysis
Simple Technical Analysis Summary
Aditya Birla Capital is breaking out from a multi-year resistance zone with a classic and perfect rounding bottom pattern playing out on the monthly timeframe.
Fibonacci targets have been activated!
Key Technical Observations
1. Multi-Year Rounding Bottom Pattern
The stock has completed a textbook rounding bottom formation spanning multiple years. This is one of the most reliable bullish reversal patterns in techn
#Cipla - #ShortTerm #Inveatment IdeaCipla Ltd - Technical Analysis
Current Price: 1,639.10
Timeframe: Monthly Chart Analysis
This analysis utilizes:
- Monthly and Weekly timeframe analysis
- Fibonacci extension and retracement levels
- Support/resistance identification
- RSI momentum analysis
- Price action patterns
Technical Structure Overview
1. Monthly Consolidation Phase
After making a higher high, Cipla is currently in a consolidation phase on the monthly chart, forming a strong base. This consolidation suggests preparati
Long Term Buy #GMRCurrent market Price: ₹153.35
Key Technical Analysis Points
"Major Breakout Achievement"
The stock has successfully broken out of a 16-year resistance level around ₹101.73, which had been a significant barrier since the 2009 highs.
Previous ATH : ₹111.17
- Target 1: ₹125.86
- Target 2: ₹153.35
Key support : ₹101.73 (former resistance, now support)
**Long-term Pattern**: The chart shows a classic long-term consolidation pattern from 2009-2023, followed by a strong breakout and retracement
SchaefflerInd - Technical Analysis#Schaeffler India - Technical Analysis Report
Current Price: 4,141.10 / Prev ATH @4951.
Trade Setup Overview
Basic Dow Theory : Stock is making Higher High - Higher Low by Breaking previous ATH decisively and stock is down to strong Demand Zone for retracement.
Stock is in consolidation before breaking previous ATH & currently forming Flag & Pole Pattern.
Entry on breakout above resistance 4,200-4,300
Conservative Stop Loss at 3,800 | Tight SL near 4,000
Tgt 1: 4,602
Tgt 2: 4,776
Tgt 3: 5,0
Hindpetro Long - Investment IdeaHindustan Petroleum (HINDPETRO) - Monthly Chart Analysis
Current Price: 441.75
Major #Breakout in Progress
**Timeframe:** Monthly (Long-term View)
Key Technical Event:
🚀 Historic Breakout - Stock has broken above 2017 all-time high after 8 years of consolidation
- Breakout Level: 325.55
- Retest Zone: 410-420 - Currently retesting breakout
Hindpetro is Brewing for fresh new highs above ₹441
Target Projections based on #Patterns and #Fibonocci levels.
Interim Targets:
- Support holding at ₹
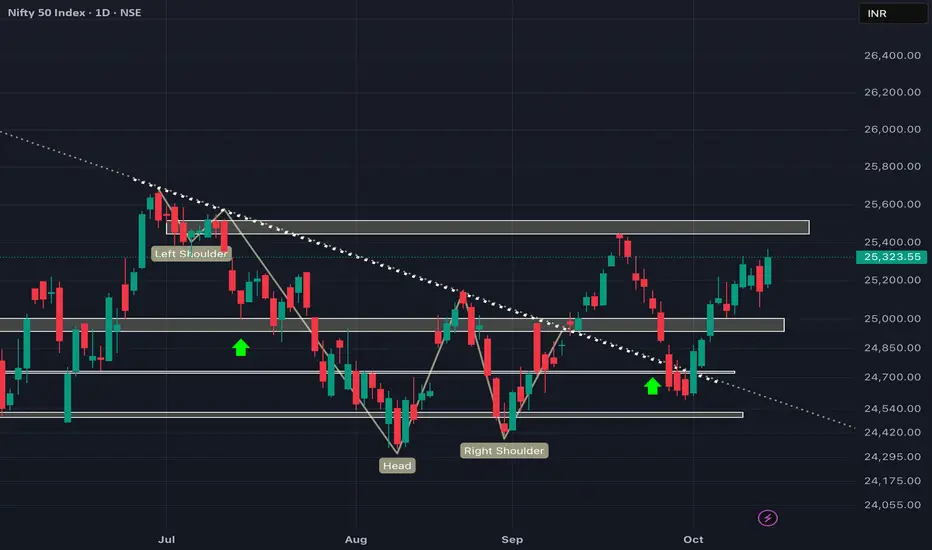
NIFTY might start facing RESISTANCE from here if!! EXPLAINEDAs we can see NIFTY has shown unidirectional rally ever since it took support from our demand zone and now has reached its resistance which is also a previous swing which could act as a resistance. Moreover in a holistic view, we can see NIFTY filling the gap till 25800 which has not been filled before making it an important supply zone. Hence, we can expect NIFTY to show strength till 25800 and show signs of rejection but if it manages to sustain itself above 25800 then ATH is coming up anytime
Pause for the Gold Rally#Gold Technical Analysis Report - USD
**Chart Analysis: Gold Spot / U.S. Dollar - 3M**
**Current Price Level:** $2,618 USD
Key Observations:
Gold is currently testing a critical resistance level at 4380.399, which aligns with major Fibonacci extension levels identified on yearly and quarterly charts. The price action shows a consolidation phase after the recent rally, with the market displaying indecision around this significant technical barrier.
Technical Levels:
The Fibonacci retracemen
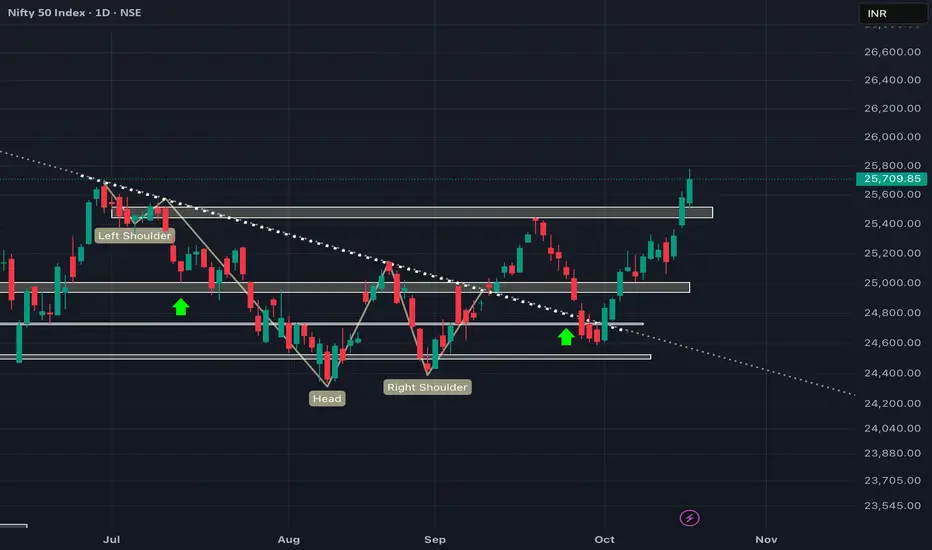
25500++ is here!!! heading towards new ATH!!??As we can see NIFTY finally achieved our target and also broke above the important supply zone and psychological level of 25500 with ease and managed to close above. Moreover, it has formed a strong bullish candle with volume and if tomorrow it manages to close above 25550, we will see a strong weekly candle too hence tomorrows day and closing can be crucial for deciding upcoming rally in market so plan your trades accordingly and keep watching everyone.
Goderaj Properties Technical analysisGodrej Properties has formed a triple bottom pattern at the demand zone (₹1,850–1,900), signaling strong accumulation and reversal from support. Price has broken above the CISD neckline (~₹2,100) with strong bullish candles and volume confirmation — indicating breakout strength.
Outlook:
Momentum remains bullish; next resistance lies near the supply zone ₹2,450–₹2,500.
Support: ₹2,080
Target: ₹2,400–₹2,500
Bias: Bullish above ₹2,100
We are getting closer to our TARGET!As we can see despite closing extremly weak previous day NIFTY managed to reverse sharply exactly as analysed. Hence we always say that we should always stick with our analysis and should not get distracted or lose hope with minor corrections or retracements until it is our structure. So, following our structure, we can still expect NIFTY to remain strong and head towards 25500 in near future so plan your trades accordingly and keep wathcing everyome.
BACK on track towards 25500!!As we can see despite the weak opening in first half, NIFTY managed to recover and ended up closing strong with a green candle which shows NIFTY can absorb such shocks and can withstand any if comes in unforseen future which shows self sustaining power of indian economy. Following our analysis, we can expect NIFTY to continue its rally towards 25500 which its next supply zone so plan your trades accordingly and keep watching everyone.
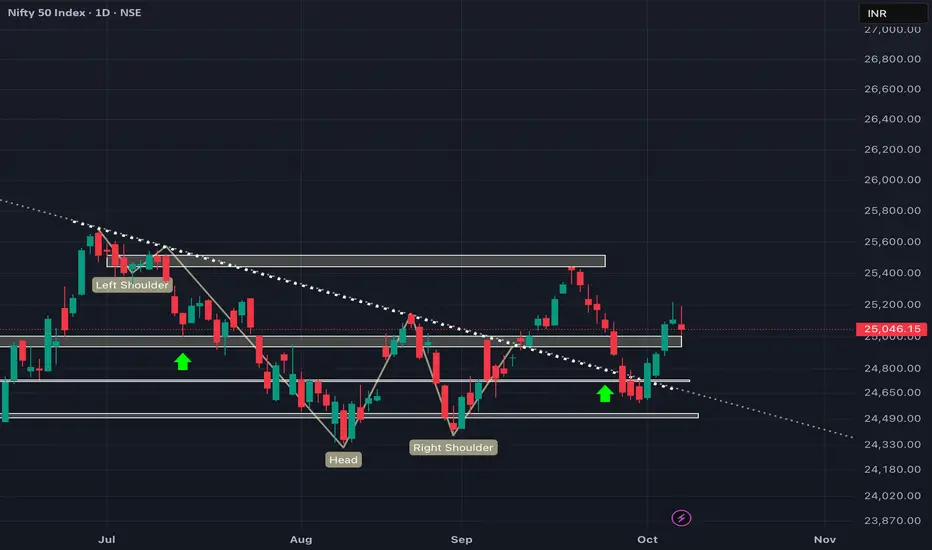
We are heading towards 25400++ no matter what!!!Following the global cues, we may expect NIFTY to open gap down but no matter what we would stand by our analysis and keep buying the dip as long as it doesnt breaks below 25000 level hence believe in our analysis and keep buying for targets 25400 --- ATHHH. So, keep watching everyone and plan your trades accordingly.
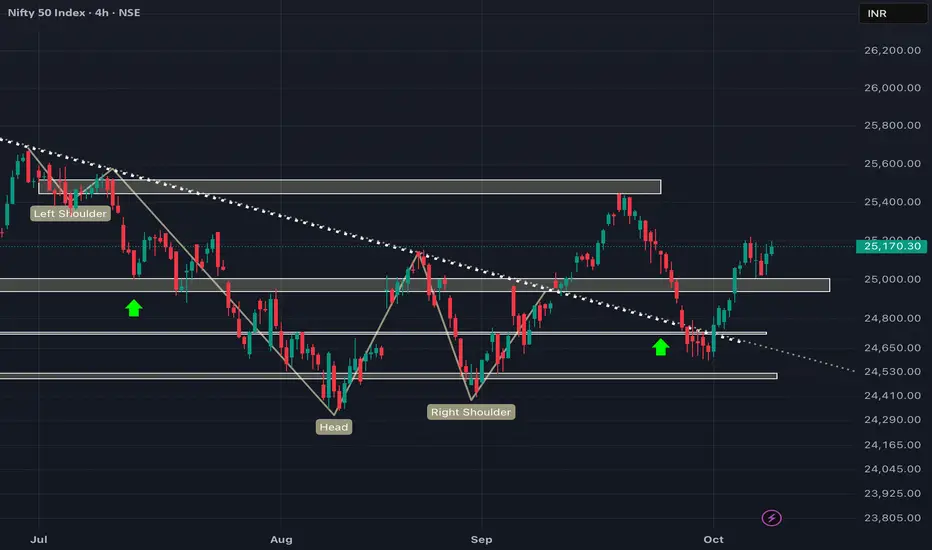
RETEST DONE!! Heading towards 25500 now! EXPLAINED!!NIFTY did showed strength exactly as analysed which was followed by a RETEST which can add fuel to the fire to the rally. We have also asked to BUY at important demand zones as we stood by our analysis. Now that it has also taken SUPPORT at important demand zone, we can expect NIFTY to continue its rally towards 25500 which is its next SUPPLY ZONE. So, keep watching and plan your trades accordingly.
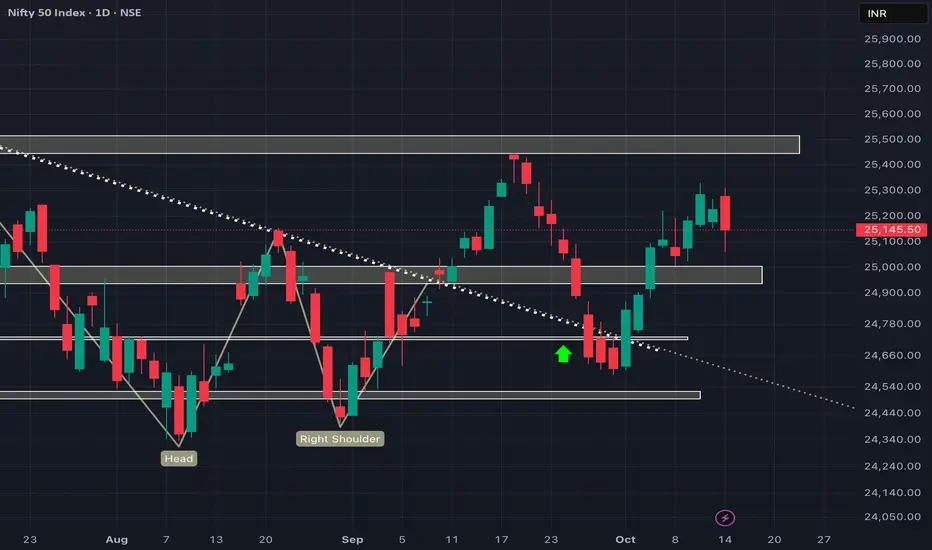
WE are still bullish above 25000!!As we can see NIFTY has shown weakness despite its strong opening but we can stand by our analysis following our previous post meeting criterias hence as long as we are above 25000 levels with minorn deviation of +/- 100 points we are still strong and enter around strong demand zones so plan your trades accordingly and keep watching everyone.
JSL TECHNICAL ANALYSISStructure: Price is currently in a corrective phase after a strong bullish rally.
Support Zone: The chart highlights an unmitigated Fair Value Gap (FVG) in the discount zone (~₹700–₹720), which aligns with a strong previous resistance turned support area.
Current Price Action: Price is trading around ₹747, slightly above the FVG zone, showing mild bearish momentum.
Expectation: If price dips into the FVG in discount zone and holds, it could act as a high-probability demand zone for a bullish
25500 is yet to be achieved!Despite forming a negtaive bias candle, we can still stand by our analsysis and buy the dips as it has not only taken support from strong demand zone with multiple congruences but also broke above 25000 level which is both a psychological level and important supply zone with ease showing strong bullish bias. So, one can plan their trades positionally if comes at lower levels i.e our demand zones for better better risk to reward.
NIFTY getting ready for new ATH now!!!?As we can see NIFTY showed rejection from our demand zone and had been bullish ever since. Now that it has also breached 25000 level which was both a psychological level and important supply zone, we can expect NIFTY to achieve 25500 easily in coming trading sessions and further head towards new ATH so plan your trades accordingly and keep watching everyone.