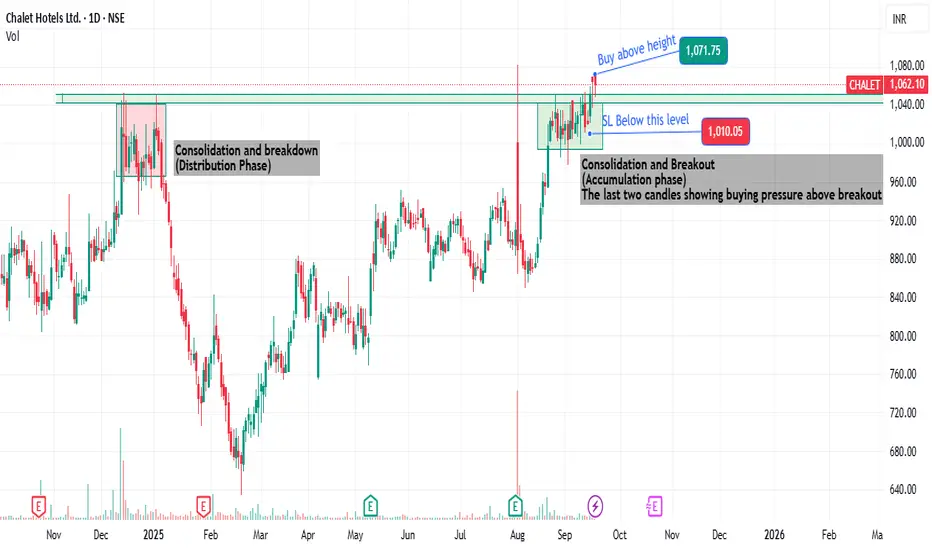
How to trade in the Right Trend - Beginners guide
How to Identify a Trend in a Chart?
Here's a practical breakdown of trend identification methods:
1. Price Structure Method (Most Fundamental)
Uptrend:
- Series of Higher Highs (HH) and Higher Lows (HL)
- Each peak is higher than the previous peak
- Each trough is higher than the previous trough
Downtrend:
- Series of Lower Highs (LH) and Lower Lows (LL)
- Each peak is lower than the previous peak
- Each trough is lower than the previous trough
Sideways/Range:
- Price oscillates between
Multiple Time Frame Analysis
WELL anticipated REVERSAL! Heading towards 25000 now!!As we can see as analysed we saw a strong REVERSAL before hitting our demand zone and is now expected to continue its short covering for 25000 level forming a reversal kinda pattern in weekly time frame. So for short term basis we can make positions for 25000 and if manages to sustain itself above 25000, we can target towards ATH so plan your trades accordingly and keep watching everyone.
ShalbyLtd - Investment Doubler - High Conviction Trade Setup#Shalby Ltd - #Technical Analysis Report
Current Price: 264.50
Key Technical Signals
Bullish Confirmation from Multiple Timeframes:
- Monthly chart shows a confirmed range breakout with uptrend validation
- Previous high broken on monthly chart, establishing higher highs
- Powerful RSI Bullish Divergence observed in monthly timeframe
Weekly Chart Analysis:
- Supply zone has been invalidated by price trading above 246-250 Levels
- Stock is now in an active swing trade setup
- Expected Immedia
EXPECTING REVERSAL ANYTIME SOONER!!As we can see despite the weakness, NIFTY is unable to sustain itself below the last swings and getting constantly rejected around our demand zones which brings us to a conclusion considering various factors including strong psychological level and demand zone, we can expect a strong green candle anytime sooner and there is a high probability of forming a green weekly candle so plan your trades accordingly and wait for signs of reversal for buying.
MFSL Multi time frame AnalysisMulti-timeframe confluence analysis offers traders a robust edge through straightforward yet highly effective methodology.
Based on that MFSL is a strong Buy on dips stock based on powerful breakout of previous ATH and the current market structure.
Targets are derived from #Pattern #breakout and #Fibonacci levels.
Bullish Pennant in formation.
Disclaimer: Above analysis shared for educational purpose only.
NIFTY will REVERSE from here!!?? EXPLAINED !As we can see NIFTY CLOSED below our demand zone showing signs of bearishness. Despite the weakness, we may expect NIFTY to REVERSE from here as technically this zone has been conincided by multiple demand zones being both a psychological level and the neckline of inverted head and shoulders pattern which can act as an important point of REVERSAL. Hence any flat to strong opening which doesnt breaks below previous low can show strong upmove from here so plan your trades accordingly and keep watc
GET ready for making new LONG positions!! EXPLAINEDAs we can see NIFTY had been fealling over 400++ points since pastt week from our supply zone exactly as analysed. Now that it is heading towards our important demand zone and psychological level of 25000, we can expect a REVERSAL from given levels. Hence we should keep watching keeenly and wait for signs of REVERSAL around our demand zone and make fresh positions for atleast recent swing as the target.
YET to take SUPPORT at DEMAND ZONE!! EXPLAINED!As we can see NIFTY did fell unidirectionally in the first half which was well anticipated but couldnt sustain itself below and recovered slightly forming a DOJI candle. following our analysis, we are yet tp take support at 25000 psyhological with deviation of 50+- points for a perfect entry. so we will wait for NIFTY to come at our zone which can be expected if the low is broken of DOJI so plan your trades accordingly and keep watching everyone.
Nifty Technical Analysis – 23 September 2025🕒 1-Day Chart
Support Levels:
25,200: Immediate support; bulls need to defend this level.
25,050: Critical support; a break below this could lead to further downside.
Resistance Levels:
25,300: Immediate resistance; a breakout above this could lead to a rally.
25,450–25,500: Key resistance zone; bulls need to reclaim this for a bullish trend.
Technical Indicators:
RSI is below 60, indicating weakening momentum.
MACD shows a bearish crossover, suggesting potential downside.
Market Senti
We are heading back to 25000 again!!! EXPLAINEDAs we can see NIFTY again fell strongly which was fueled by Trump's new policy for IT companies which led to this weakness. Further, viewing technically we can also see space for correction till 25000 level which is its next important demand zone which would also be a great area to buy for POSITIONAL view. so plan your trades accordingly as market is now trading at NO TRADING ZONE area which would lead to immense volatility. Better idea would be to wait for price to come at our demand and suppky
Infosys: Technicals Align with H-1B HeadwindsInfosys (NSE: INFY) has been moving within a larger corrective structure after topping near ₹2006. The weekly Elliott Wave count suggests a possible W–X–Y correction, where the Y-leg may be unfolding as a 3-3-5 flat. With prices currently hovering in the mid-1500s, the bigger picture hints at unfinished business on the downside.
Weekly Chart – The Bigger Picture
The weekly count shows:
Wave W completed near ₹1185,
A strong bounce into Wave X topping at ₹2006,
And now Wave Y in play, pote
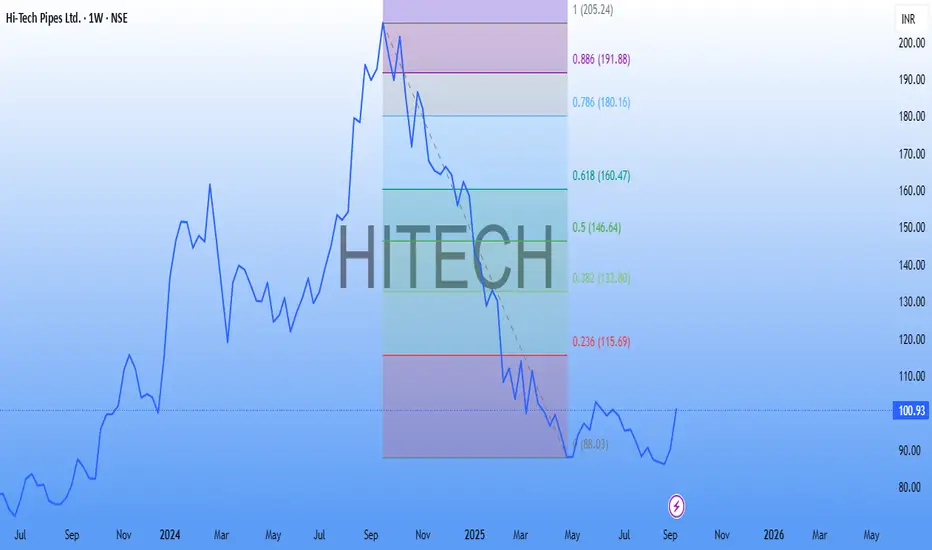
Hitech Pipes Long
📊 Hi-Tech Pipes Ltd (NSE: HITECH) – Weekly Technical Analysis
The stock has witnessed a prolonged downtrend from its highs and recently formed a strong bullish reversal candle, signaling a potential short-term trend reversal. Key indicators are also turning positive, supporting the possibility of an upward move.
🔎 Technical Observations
Price Action:
After a steep fall from ~₹140 levels, the stock took support near ₹88–90.
A strong green weekly candle has appeared with good momentum, suggesting
Paras Defence Technical Analysis🚀 Paras Defence & Space Technologies Ltd – Weekly Chart Analysis
The stock is showing signs of a potential reversal after consolidating near key support zones.
🔎 Technical Observations
Price Action:
After a prolonged decline from the highs, the stock has stabilized around the ₹640–660 support region. The recent weekly candle indicates buying interest, with bulls defending key support levels.
Sustained strength above the ₹700 zone can accelerate momentum towards higher levels.
Risk–Reward Setup
Cochinship AnalysisCochin Shipyard Limited (COCHINSHIP) Bullish Bet
The chart presented indicates the formation of an Inverse Head and Shoulders pattern, which is considered a bullish reversal pattern.
Left Shoulder: Formed around early August 2025.
Head: Formed during mid-August 2025 at a lower price level.
Right Shoulder: Formed towards late August 2025.
Neckline: Around the ₹1,750–1,765 range.
This suggests a potential trend reversal from bearish to bullish.
Current Price (CMP): ~₹1,745.70
Neckline Resistance
Well anticipated REJECTION!! Will this continue? EXPLAINED!As we can see NIFTY showed strong rejection from our supply zone as analysed despite forming hammer kinda pattern in daily time frame. Following our analysis, unless NIFTY sustains itself above 25450, every rise can be sold till 25150 levels. So, one should not make any new fresh position at current levels and wait for either levels to break for continuation of trend. So, plan your trades accordingly and keep watching everyone.
EXIDE INDUSTRIES LTDPrice has formed a Cup and Handle pattern, a classic continuation signal.
Breakout level is around ₹475, which if crossed, can trigger a strong rally.
Target zone after breakout is projected near ₹620.
Support lies around ₹350–370 (previous demand zone).
👉 In short: Bullish structure, breakout above ₹475 could open upside towards ₹620; strong base at ₹350.
usha martinPrice has formed an inverted Head & Shoulders, a reversal pattern signaling strength.
Breakout above neckline near ₹398 has triggered upward momentum.
Current price is around ₹410, with next resistance/target near ₹447.
Stop loss area is around ₹367 to manage risk.
Trend remains positive as long as it sustains above breakout zone.
👉 In short: Bullish bias with target ₹447; support at ₹367.
Will 25350 act as a RESISTANCE !? EXPLAINED!!As we can see NIFTY has shown unidirectional upmove as expected and analysed in our previous multiple posts but now it can be seen closing at very crucial area which is 25350 zone. As discussed earlier there is a pending GAP which was yet to be filled has finally been achieved but can show rejection as these zones has multiple unfilled orders of big volumes hence we can expect NIFTY to reject at this zone until it forms some kind of flag-pole pattern for bigger break towards 25500. so plan your
NIFTY is heading towards 25500 !! EXPLAINED!As we can see NIFTY finally showed unidirectional upmove as expected and analysed in our previous posts as it managed to sustain itself above 25000 levels. Now that it has managed to close above 25200, there is no immediate strong noticeable resistance other than 25300 levels which is a GAP which needs to be filled can act as a resistance. break of which we can see 25500 being next important resistance and swing so even if we may see a temporary retracement, we may expect long term bullishness s