Multiple Time Frame Analysis
Exact REVERSAL from our demand ZONE!!As analysed NIFTY showed more than 200++ points REVERSAl from our demand zone, now our view has been changed from selling the highs to buying the dips unless NIFTY breaches 25000 level and sustains below which could be our SL hence any dip could be a buying opportunity from here so plan your trades accordingly and keep watching everyone.
25000 is here! READY TO REVERSE!!?As we can see NIFTY has taken support in the important demand zone as analysed being both a demand zone and a psychological level hence from now we can wait for NIFTY to show signs of REVERSAL as any signs of REVERSAL from this demand zone can show new ATH so plan your trades accordingly and keep watching everyone.
the much awaited FALL is here!! Just as analysed!! Whats NEXT?As we can see NIFTY seems to be following our analysis. Now since it has entered our demand zone of 25150-25200, we can expect NIFTY to reverse as not much downside is available now. We can see 24950-25000 to act as a strong demand zone which is also a psychological level hence any signs of REVERSAL around this zone could show strong UPSIDE so plan your trades accordingly and keep watching everyone.
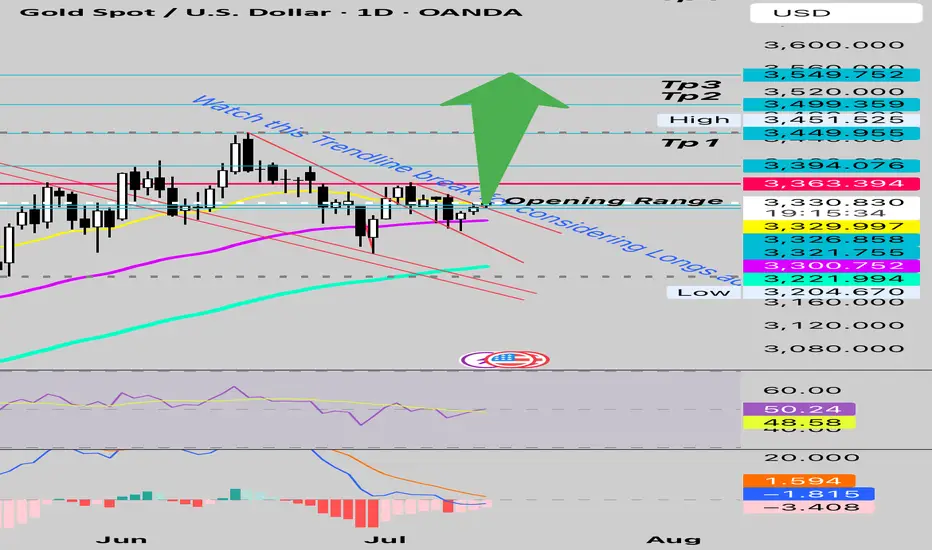
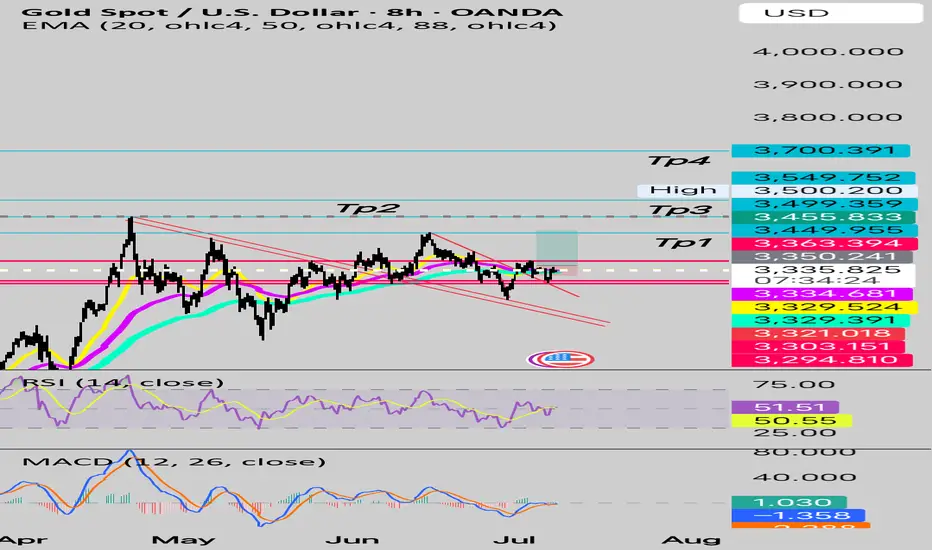
Trendline broken Buying pressure continuous and flooding Gold is gaining from strength to strength
After breaking the falling trendline It is trading above the opening range.
As long as above this. More upside towards 3366 and more could follow
Comfortably above weekly support 3300
Tp remaining same as before
STRONG REJECTION exactly as analysed!!As we can see NIFTY showed directional downward move exactly as analysed. Now that NIFTY has closed again at important demand zone from where it got rejected previously, but now the formation of this candle shows the strength of bear over bulls, Hence any closing below 25300 should lead to another strong downfall so plan your trades accordingly and keep watching everyone.
HSCL to Fly Very Sooon!So here's another chart that’s quietly showing signs of strength — NSE:HSCL just kissed its falling trendline drawn from September 2024 highs.
After almost 10 months of lower highs, the stock is now trying to push above the trendline with volume backing it. That giant green candle on June 27 with a volume burst was the sign of Smart Money stepping in. And now it’s consolidating just below the breakout point — classic pre-breakout structure.
This is what we call a volatility contraction near
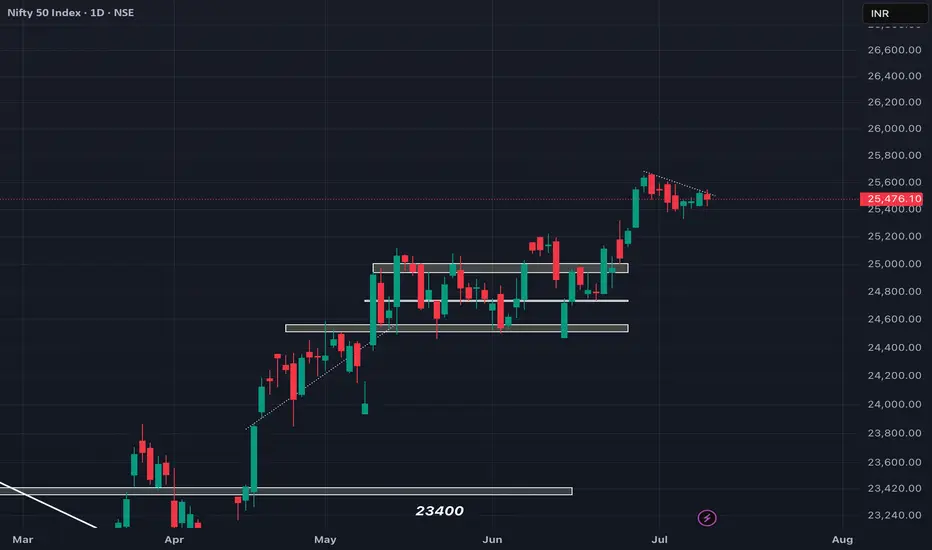
BEARISH till now! View might change above 25550!!As expected NIFTY got rejected exactly from our given trendline resistance but since it tried breaking the trednline, its candle high is of immense importance. Any break and sustainment above 25550 can result in strong unidirectional upmove, but below the trendline, it can remain sideways to negative so plan your trades accordingly and keep watching everyone.
A minor RESPITE!? will it sustain?As we can see NIFTY finally showed some volume after being sideways for couple of days which could be a result of consolidation's break. Moreover, we can see NIFTY closed itself at the trendline resistance which is cautionary. Hence unless NIFTY breaks and sustain itself above the trendline, every rise can be shorted so plan your trades accordingly and keep watching everyone.
DOWNFALL is yet to come!NIFTY can be seen being sluggish as analysed in our previous post. We are yet to decide its trend and hence NIFTY can remain sideways due to following reasons unless a strong demand zone is achieved. Hence unless signs of REVERSAL is seen around demand zones are rise in volumes which could change the direction so plan your trades accordingly and keep watching.
Swing/Positional Setup: Sector-wise Analysis – Cash/Options Segm✅ Swing and Positional Trade Setup
Sector-wise Analysis – Cash / Futures & Options Segment:-
Over the past 18+ years, I have developed a trading setup that revolves around sectoral analysis. My trades are taken in cash, futures, and options, based on which sector and which stock is showing strength.
Below, I’ve shared the complete sector-wise stock list. This will help you skip the most time-consuming part—stock selection—so you can focus purely on execution and discipline.
🔍 Stock Selection C
NIFTY still looks weak!After a series of weakness, NIFTY finally showed signs of REVERSAL without important demand zone but looking technically, NIFTY still looks weak and can fall upto 25200 before finally continuing its upmove so we can expect NIFTY to remain sideways to bearish in coming trading sessions till it reaches our demand zone so plan your trades accordingly and keep watching everyone.
Beauty of Fibonacci Resistance Speed Fan on Gold as a Golden
1. Look at the Beauty of Fibonacci Resistance Speed Fan on Gold as a Golden View
The weekly chart of CFDs on Gold (USD/oz) showcases a stunning Fibonacci resistance fan, guiding price action with precision.
2. Fibonacci Levels as Key Resistance Zones
The fan, drawn from the 2025 low, highlights critical resistance levels: 0.25 at $3,250,000, 0.382 at $3,333,900 (current price), 0.5, 0.618, and beyond, acting as potential ceilings.
3. Current Price Action at $3,333.90
As of July 0
Infosys Ready For 30% Potential UpsideFrom 2000 to 2020
Over period of 20 Years ( Observe The Marked Circles)
Infosys on Monthly TF has Bounced And Rallied Sharply Everytime it has Touched 88 ~ 100 MEMA after Crossing the 20-50 MEMA and has traded in a Parallel Channel which provides a Stable And Solid Structure to Match the Fundamental Growth of the Stock.
Ever Since The Mega Breakout of 2020 after crossing 1.618 Fib Extension of the Rally that began in 2000
We have Upgraded the Channel
We are Near the Trendline and have be
NIfty Bullish Breakout RetestHello Everyone,
Profit Booking in nifty from 25660 to now 25330__RSi also adjusted from overbought to now at 45-50 Volume shows sellers dont have enough strenth to push the market down ....Clearly Buy on dips set up with all the conflunence EMA support and Trendline support makes set up more stronger.
Get ready For new Lifetime High.
NIFTY might get weaker below 25400 levels!As we can see NIFTY had been sideways to negative till now as analysed but it seems it can get even more weaker below 25400 levels as this has acted as a suppor since past few days hence any quality break can show downside till 25200 level which has been analysed in our previous analysis so plan your trades accordingly and keep watching everyone.
25200 is the level we are looking at right now as a DEMAND ZONE!As we can see NIFTY has fallen subsiquently from our supply zone exactly as analysed. Now that it has started to fall, we can expect NIFTY to fall till 25200 which is its next important demand zone hence we must wait for signs of reversal around this demand zone so plan your trades accordingly and keep watching everyone.
Buy Opportunity in GoldI am watching it since 1 month. The Gold had taken its retracement.
On lower (1h and 4H) timeframe, It traded in strong trends' zones which were broken yesterday. Now the crocodile traders should wait for its resistance zone and get a signal on 1 h or 4h timeframe to buy above resistance zone, above 3360.
An H4 healthy candle closing above this resitance zone will pave the way into another test of 3422 area, not putting any TP though as my target is 5000 (fundamentaly).
BEARISH! but a TRAP might come !As we can see NIFTY had been sideways to bearish from our supply zone as of now. Now looking at the structure, it can be seen it is forming more like a double bottom pattern wherein a breakout can be anticipated above 25600 levels which could be a possible trap so unless NIFTY sustains itself above 25750 levels, making fresh new longs should be avoided. So plan your trades accordingly and keep watching everyone.
NIFTY rejected exactly as analysed!!As we can see NIFTY can be seen rejected before reaching our level but it was the gap which was mentioned in our analysis and it did get rejected exactly from our given levels hence as long as a 25750 is broken and sustained above every rise can be sold so plan your trades accordingly and keep wathcing everyone.
ABBOTINDIA Swing Trade ( 10% upside potential) Abbott India is near to the previous Institutional Buying zone and has upside potential of 10%.
Simple Demand Zone buying setup.
Don't keep hard stop loss. Manage positions as per situation.
Follow for more such setups.
I have been very busy lately because of renovation at home. Will be sharing more setups soon. Thanks.
SBI Ready for 10% Upside in Short termOn Monthly TF
Taken Support At Lower Parallel Channel 20MEMA
On Weekly TF
Inverted HNS Breakout and Retest Completed at 100 WEMA And trading above 20 and 50 WEMA
Above 810 Shorts may start Covering
Trade Activates above 810
SL below 775
Targeting 890
R:R = 2.5
Downside To Trade Idea: Trendline Breakout Pending