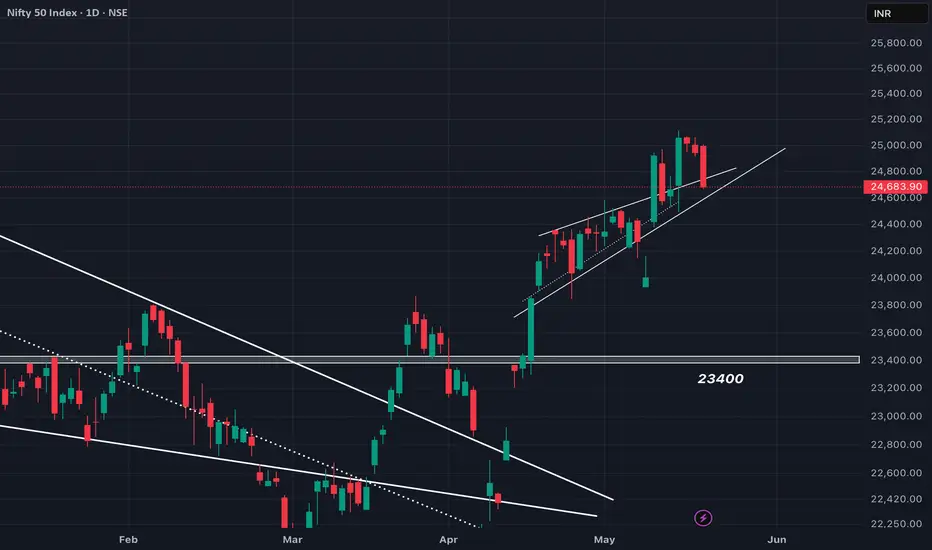
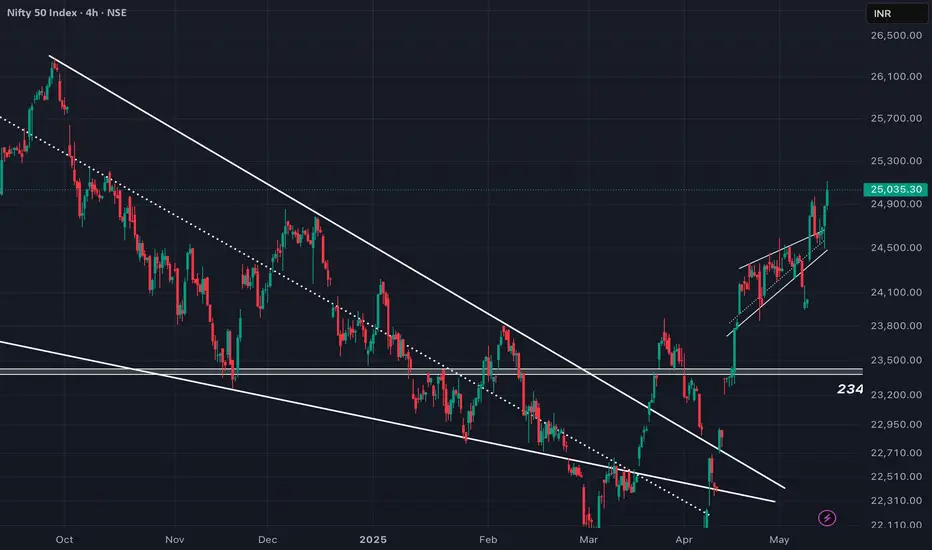
Multiple Time Frame Analysis
GDP and GST collection above estimates! adding fuel to the fire!As we can see despite a weak closing, massive gst collection and GDP which has surpassed its estimates can give thrust to the market for new highs. Also, our demand zone is still protected which can act as a catalyst to fuel the fire so plan your trades accordingly and keep watching everyone.
NetApp Inc shows bullish candlestick in larger timeframeNASDAQ:NTAP price action shows bullish candlestick pattern in the Monthly Chart. As well as in Weekly chart, it shows steady rejection and showing a sideways consolidating trend.
Lets analyze first weekly timeframe:
We can see during April'25 (Tariff Trauma weeks) the price made a low of $74, breaching down the $80 mark.
But within one week it again regains back the strong, historical demand zone of $80 and continue it's upsurge towards $100. It made a recent weekly high of $102.
Strong REVERSAL in closing hours!! more to come!As we can see despite the bearishness, NIFTY managed to recover strongly based on our analysis. we can stand by our analysis and keep buying the dip till our demand zone is well taken care of. so, plan your trades accordingly and keep watching everyone.
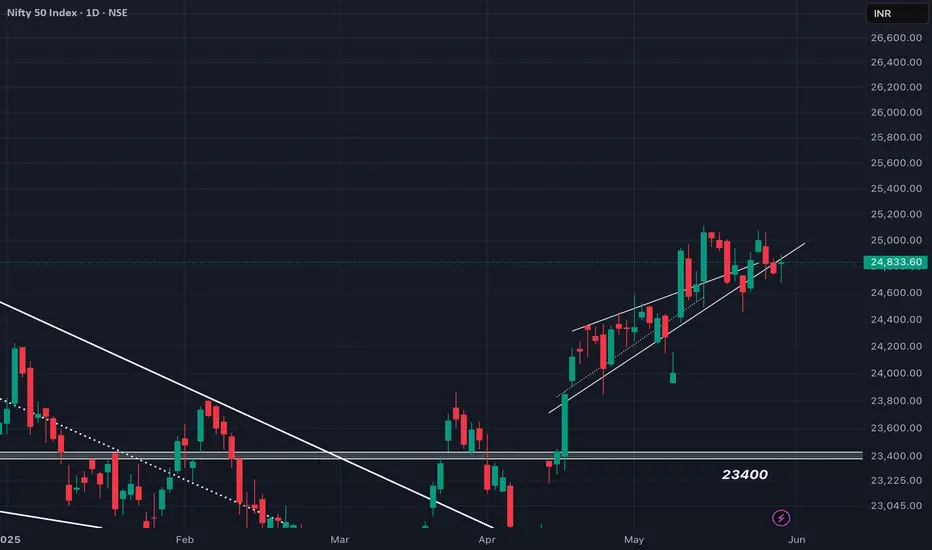
NIFTY forming Head and Shoulders pattern..?As we can see NIFTY remained sideways throughout the day but our demand zone is still protected hence as long as we are above 24400, every dip can be bought. on the other hand, it can be seen forming head and shoulders patttern in bigger time frame which is a reversal structure but its neckline can be assumed around our given demand zone hence we should stay by our analysis until and unless 24400 is broken below and sustained so plan your trades accordingly and keep watching.
Another chance for ENTRY..?As we can see NIFTY fell unidirectionally with immense volatility which was completely unexpected but this could be an another great entry for those who has yet not entered as it is still in structure showing signs of bullishness. Hence keeping SL below 24400 closing basis for new ATH can be the desired risk to reward in thr following trade so plan your trades accordingly and keep watching.
NIFTY forming FLAG-POLE pattern..?AS we can see NIFTY still carried on with its bull run and looking at charts we can still expect NIFTY to continue its uptrend as in bigger time frame we can see it forming more like a flag-pole pattern which is also a bullish continuation pattern hence as long as NIFTY maintains itself above 25000, strong upmove is expected so plan your trades accordingly and keep watching everyone.
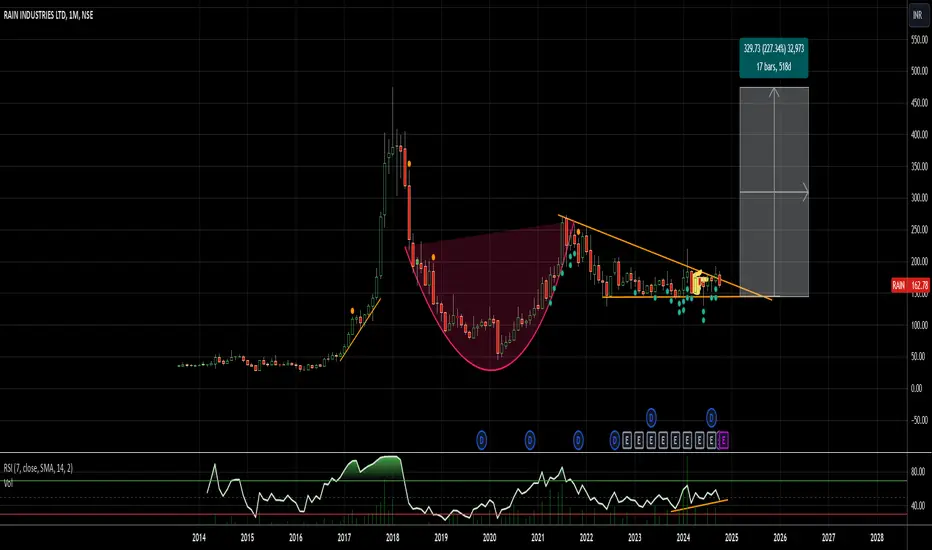
Micrcap that is actually having the potential of a midcapRain Industries NSE:RAIN has many verticals
The major are the foreign Carbon business, which recently entered into a JV with Northern Graphite for advanced materials.
Now, there is the local business that is CPC.
Then you have a cement business with 2 plants in various locations across AP and TG. They sell it across Kerala, TN, AP, Karnataka and TG.
The issue with this company has traditionally been Debt to Equity ratio and the long term borrowings.
Once that global business starts and
NIFTY REVERSED exactly as EXPECTED!!As we can see NIFTY reversed exactly from our given levels and analysis as based on our analsyis every dip was to be bought unless 22400 was broken below and our patience did pay off. now that it is maintaining itself above the structure and the demand zone is also protected, we will stay by our analysis of being bullish for new ATH so plan your trades accordingly and keep watching.
24400 is still protected!As we can see NIFTY despite the fall managed to close inside the structure and the strong demand zone of 24400 is still protected which makes us stand by our decision of buying the dip keeping SL below the zone on closing basis so plan your trades accordingly and keep watching everyone
We are still BULLISH !!As we can see NIFTY tried being strong but last swing resulted in strong rejection resulting in weak closing but it still closed above the structure and could act as a retest to the breakout for further continuation of uptrend so plan your trades accordingly and keep watching.
bullish as long as we are above 24600!As we can see NIFTY showed strong retracement which could be influenced by trumps new bill which imposed tax on remittances which NRI's used to send back home to INDIA but looking technically, it still looks bullish and this fall can act as a retest for further up move so plan your trades accordingly and keep watching.
Nasdaq buy side Here we have analysis of nasdaq chart
1. Last night price took the 1 day FVG at the top and with a strong impulse movement.
2. There is a 1 hour fvg pending at 21200 level
3. If prices takes the fvg at 1hr in the down side with the liquidity & Fib movement strong pd arrays at 21200
4. The the next poi will be on 1 day at the upper side of 21800 level with a strong liquidity.
YES BANK ENTERED IN 2ND ZONE (BUYING ZONE)Yes bank has entered in 2nd zone or buying zone.
this analysis is simple Support and Resistance monthly analysis.
I just marked lines from 2020 to 2025 they are important high lows .
improtant high lows are 5, 10, 20, 24, 30, 32,
yes bank currently trading on 21 rs . according to my analysis nxt target could be 24 to 30 rs in this year.
Exact REVERSAL as anlysed... 25300 incoming ..?As we can see NIFTY moved exactly as we analysed in our previous post as we told you guys we are bullish unless 24400 is breached below and the retracement could act as retest to the breakout and can move violently and we did see that in todays market. now we can see another supply zone around 25300-400 levels hence we can expect NIFTY to extend further more so plan your trades accordingly so plan your trades accordingly.
is it a RETEST after BREAKOUT!!?As we can see despite the fall, NIFTY managed to close above the structure showing signs of bullishness and could be a retest after a breakout resulting in stronger up move hence we should stand by our analysis as unless and until it closes below the level of 24400, every dip can be bought so plan your trades accordingly and keep watching
Trend Matrix+RSI: Simple Multi‑Timeframe Strategy for Confident 🔰 Trend Matrix + RSI: Simple Multi‑Timeframe Strategy for Confident Trades 🚀
Want a strategy that’s easy for beginners yet powerful enough for pros? This TradingView idea combines the Trend Matrix Multi-Timeframe Dashboard with the classic RSI indicator to create a visually compelling, high-probability trading method. By aligning multi-timeframe trend signals with momentum confirmation, you get clear guidance on when to enter and exit trades on any market – from Bitcoin and Gold to Nifty 50. 📈✨
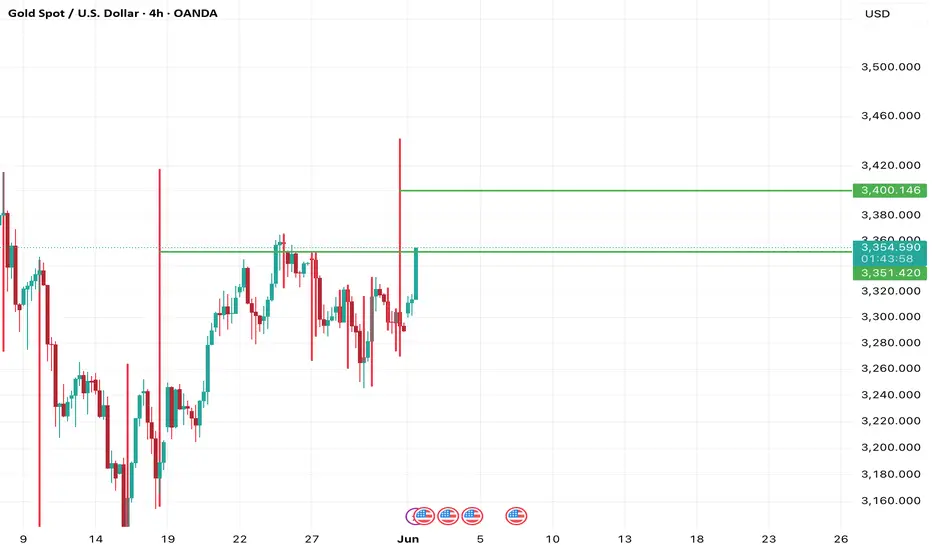
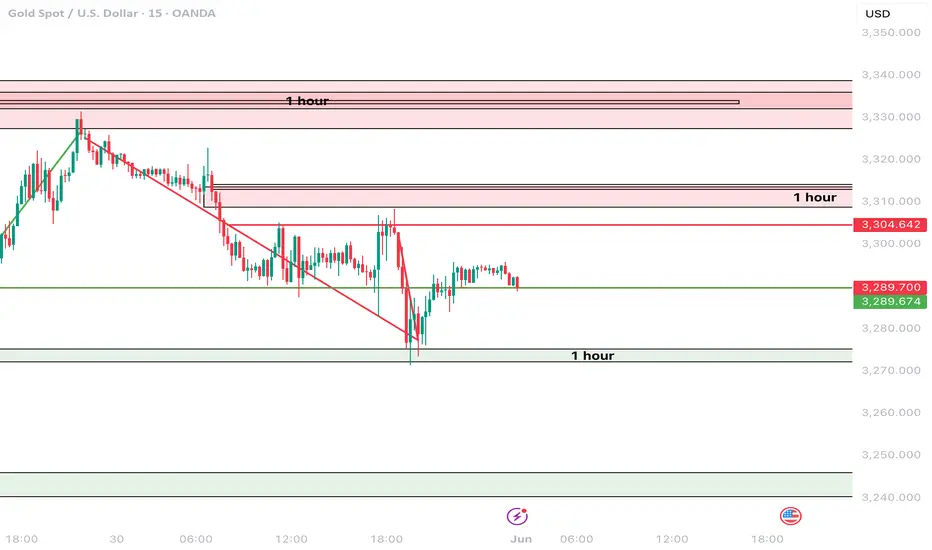
XAU/USD - Mirror Concept Move PredictionBest opportunity for Traders?
This analysis covers the potential upside move that OANDA:XAUUSD can make over the next couple of days.
Applying the age old - Mirror Market Concept to the Gold chart, it is extremely clear that the potential levels that Gold will react to for sure are as follows:
1. Interim Resistance - $3434
2. Strong Resistance - $3480-$3500 (ATH)
3. Strong Support - $3200
Mirror Market Concept basically tells us that - whatever has already happened in the ma