Reliance Industries Dragon Fly Doji in Weekly chart at SupportHi this is Kapil,
Reliance Industries took support at 1257 on weekly and monthly support area, Made Dragon Fly Doji on weekly chart as well
Bulls can be seen pulling the price back above the support level of 1237.
after 43% upside swing in one year from oct 2023 to oct 2024 the stock looks in minor consolidation period
to a possible reversal we can plan adding reliance in our portfolio with annual returns of 25-20% for 2025 year.
Next support below 1200 is at 1004. So add near here and @1015
Ne
Multiple Time Frame Analysis
Potential Swing Reversal in HILHIL limited was seen reversing from support and there is high possibility of it to move towards the channel resistance
HLong
TRAPPED..? BANKNIFTY couldn’t sustain or hold itself above our given levels leading to big fall and we had discussed about it before as it can show multiple fakeouts before finally breaking out so we have to wait for candle to close above the given range for trend confirmation so plan your trades accordingly and keep watching.
BERGER PAINT - FUTURE TRADING IDEA ON LONG SIDESymbol - BERGEPAINT
BERGEPAINT is currently trading at 491
I'm seeing a trading opportunity on buy side.
Buying BERGEPAINT Futures at 491
I will add more long position at 480, if comes.
Holding with SL of 470
Targets I'm expecting are 512 - 525 & above.
Disclaimer - Do not consider this as a buy/sell recommendation. I'm sharing my analysis & my trading position. You can track it for educational purposes. Thanks!
BEARISH FLAG IN BANK NIFTY - TIME FOR A SHORT TRADE ?Symbol - BANKNIFTY
CMP 51350
BankNifty has turned its trend from bullish to bearish & sideways making lows - lows on daily time frame & It was trading in a bearish channel. We can see a Bearish Flag pattern getting formed in BankNifty. Such patterns on larger time frame don't usually fail. BankNifty is currently trading near break down trendline of this pattern. Breakdown & sustaining below this trendline zone 51150 - 51000 will get this pattern activated & we can see big target towards downsi
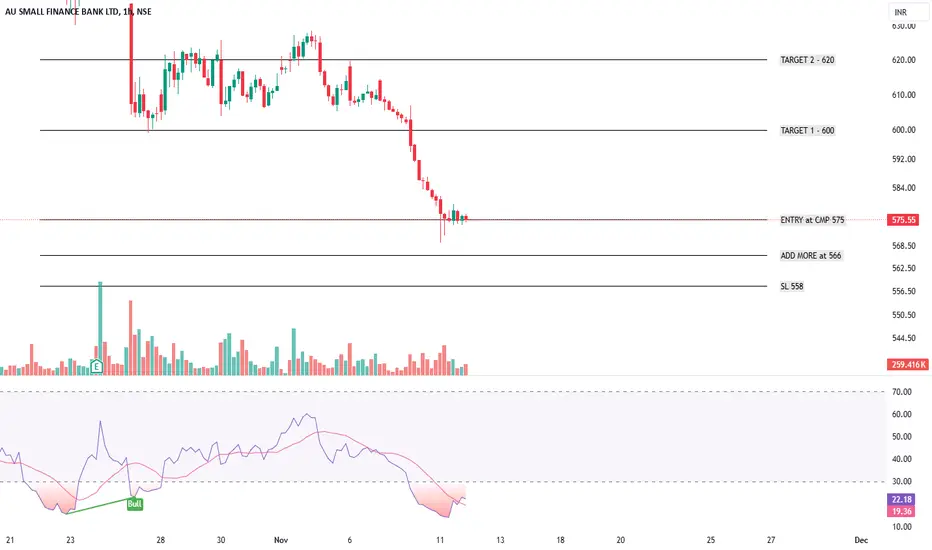
AU SMALL FINANCE BANK - SWING TRADING IDEASymbol - AUBANK
AUBANK is currently trading at 575
I'm seeing a trading opportunity on buy side.
Buying AUBANK Futures at 575
I will add more long position at 566, if comes.
Holding with SL of 558
Targets I'm expecting are 600 - 620 & above.
Disclaimer - Do not consider this as a buy/sell recommendation. I'm sharing my analysis & my trading position. You can track it for educational purposes. Thanks!
BANKNIFTY can show new ATH if sustained above 52500…? As we can see BANKNIFTY got rejected exactly where we expected it to get rejected and remained sideways to negative and it could continue for upcoming days until it breaks and sustains above 52500 levels which could show new ATH so plan your trades accordingly and we may see volatility here leading to multiple fakeouts.
52500 is that needs to be broken to confirm new ATH for BNF ! As we can see BANKNIFTY has shown over 2200++ points since last few days and we stood adamant to our decision of buying the dip till our level was not breached below hence following our view, we can expect BANKNIFTY to start rejecting at 52500 levels or can trap showing breakout but if sustains then we may see new ATH for BANKNIFTY so plan your trades accordingly.
strong REVERSAL but can it SUSTAIN..?As we can see BANKNIFTY showed strong reversal wiping last 3 day losses in a single day but the main question is that will it sustain it higher levels..? Following the ongoing events, the lopsided win of ruling government in Maharashtra can add fuel to fire and hence can result in strong opening but the closing is to be noted hence tomorrows closing is going to be really important to confirm bigger targets so plan your trades accordingly and keep watching.
Potential swing option for short/mid term holdHINDCOPPER after making ATH of 415.80 have corrected approx 37% from top. Last trading week, stock have created a base at 260 levels showing sideways movement despite there has been huge volatility in Metal sector. Due to continous FII selling and negative market sentiments expecting 260 level to break and creating more panic for retailers.
However, as per my views, there should be a bounce back from 243/226 zone for further waves. Now, this bounce shall occur either quickly just hitting level
Strong REVERSAL from our demand zone!! As we can see BANKNIFTY again has showed strong REVERSAL from our demand zone though it has been tested before showing the strength hence unless BANKNIFTY breaks and sustains below the psychological level, every dip can be bought so plan your trades accordingly and keep watching.
Good Risk-Rewards in BNBUSDTBelow are the some points to go through for better analysis:
1. BNBUSDT is one of the great coin for trading as well. Liquidity i also doesn't matter
2. Risk Reward is almost 4.
3. Broder Market of Crypto is upside (Upside Trend)
4. BNBUSDT rally is pending
Disclaimer:
Content shared on or through social site channels are for information and education purposes only and should not be treated as investment or trading advice. Please do your own analysis or take independent professional financial
Ascending Parallel channel in JSW NSE:JINDALSAW An ascending parallel channel has been formed in weekly & daily channels out of which a current daily bullish candle confirms the reversal of the falling stocks
A confirmed buying can be when it crosses the parallel channel at 310 or risk-takers can accumulate at current levels.
Another bullish signal is the crossing of the EMA 200
#BANKNIFTY - 18TH NOVEMBER!!NSE:BANKNIFTY
Chart contains support and resistance levels ( understand how it works 👇🏻)
Support and resistance are key concepts in technical analysis used to identify potential price levels where assets may reverse or stall.
Support:
-Definition: A support level is a price point where buying interest is strong enough to overcome selling pressure, preventing the price from falling further.
- Indicators: Support levels can be identified through historical price data, trend lines, or movin
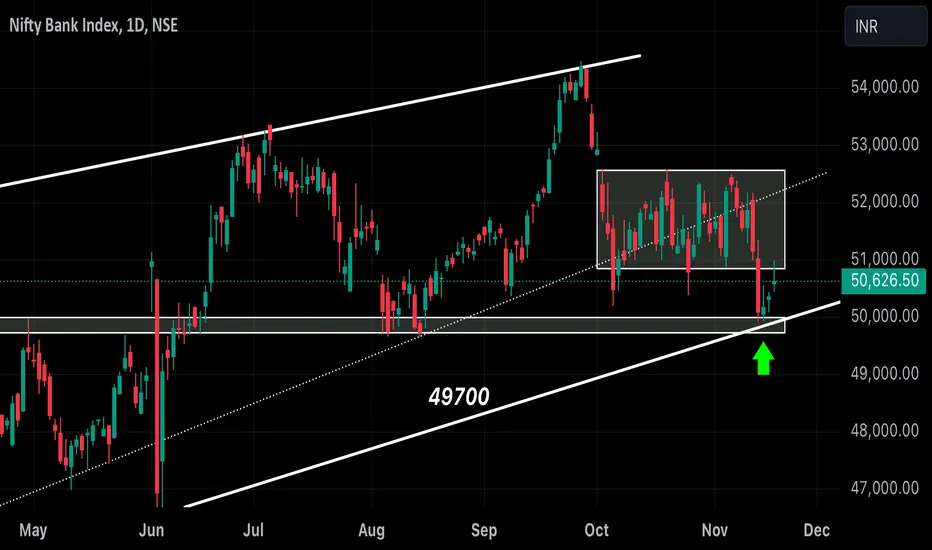
BANKNIFTY at very CRUCIAL ZONE !! As we can see we have finally reached the psychological level and important demand zone which hasn’t been tested before and hence could react aggressively from here. Hence as long as BANKNIFTY maintains itself above the given level, we may see sharp short covering else any closing below the given zone could lead to new trend which is downtrend and can lead to further 8-10 percent downfall in coming trading sessions so plan your trades accordingly.
US DOLLAR INDEX - TRADE IDEA ON SHORT SIDESymbol - DXY
DXY is currently trading at 105.57
My reversal setup has formed in DXY & I'm seeing a trading opportunity on sell side.
Shorting DXY at CMP 105.57
I will add more position if 106.00 comes & will hold with SL 106.30
Targets I'm expecting are 104.75 - 104.30 - 103.73 & below.
Disclaimer - Do not consider this as a buy/sell recommendation. I'm sharing my analysis & my trading position. You can track it for educational purposes. Thanks!