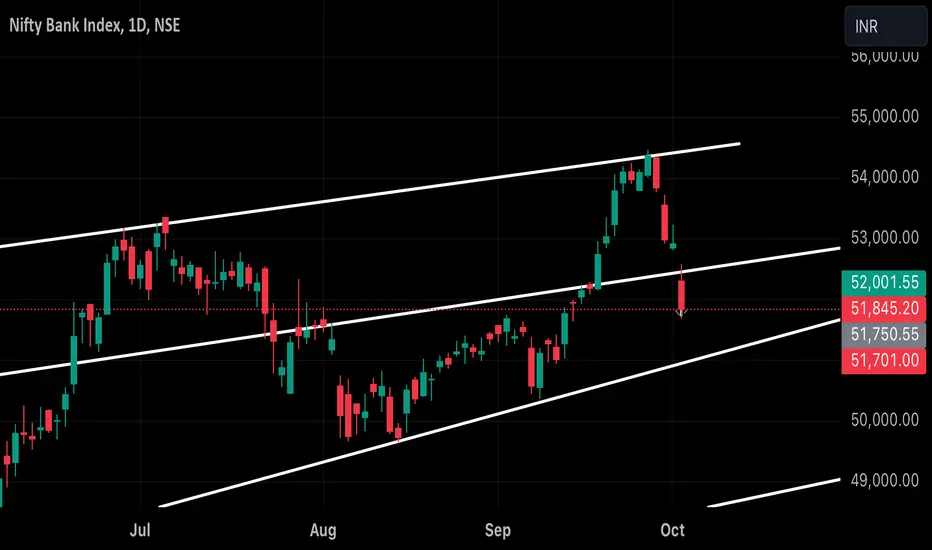
Strong UPMOVE as expected!As we analysed in our previous post that BANKNIFTY’s weekly candle did close above the trendline taking support which confirmed the uptrend and every dip could be bought and we saw exactly that with unidirectional rally. Now it can be seen breaking 51800 level which is also a breakout level hence any flat to strong opening could lead to 52500++ in coming trading sessions so plan your trades accordingly.
Multiple Time Frame Analysis
IRB After Giving Great Runup attempting to take supportNSE:IRB after giving great runup attempting to take support at 200 EMA with somewhat good volumes.
Disclaimer: This analysis is intended solely for informational and educational purposes and should not be interpreted as financial advice. It is advisable to consult a qualified financial advisor or conduct thorough research before making investment decisions.
Are we heading towards 50000 mark?As we can see despite the strength BANKNIFTY formed more like an inverted hammer pattern and ended up closing below the trendline showing bearishness as analysed hence if BANKNIFTY opens flat then we may see bearishness to continue but it opens strong then we may see another sideways to volatile market so plan your trades accordingly.
BANKNIFTY at MAKE or BREAK zone!! The Bank Nifty showed impressive resilience today, staging a strong recovery from key demand zones as anticipated. Closing around the crucial 51,000 level, which serves as both a psychological barrier and a former demand zone turned supply zone, sets the stage for an interesting session ahead.
If the Bank Nifty opens flat tomorrow, the 51,000-51,100 range is likely to act as significant resistance. Traders should watch this zone carefully for potential reversal signals or breakout attempts.
Ho
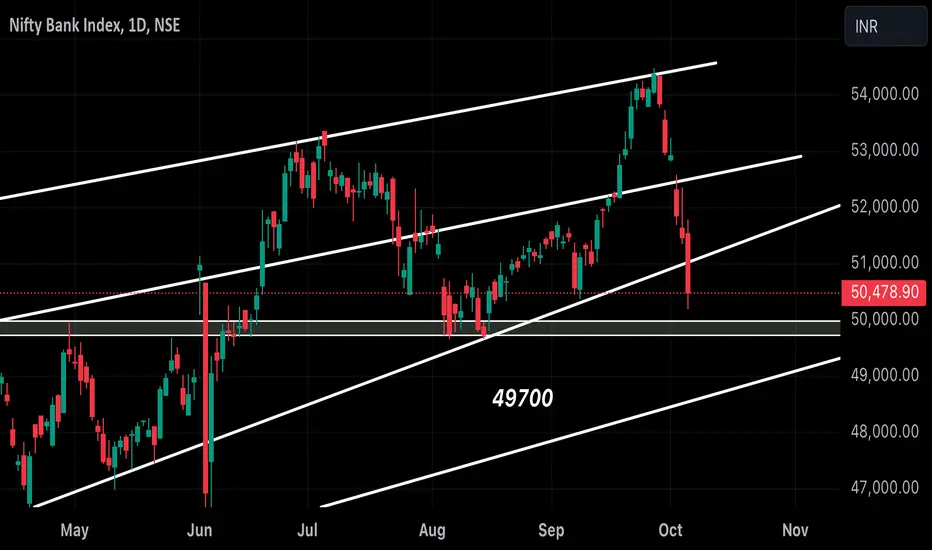
BANKNIFTY couldn’t sustain above 51000 levels! What’s next? The recent breach of the 51,000 psychological level and important demand zone in BANKNIFTY suggests a potential downward trend. Here are some key points to consider regarding the next support levels:
1. **Immediate Support Levels**:
- **49,700**: This level is highlighted as a critical support zone by several analysts. A break below this level could intensify the prevailing weakness.
- **49,650**: This is another significant support level, as it represents a previous swing low that the in
Weekly Time frame Analysis for BitcoinAs of my view and considering war too my view for Bitcoin is for short, till we get the liquidity and closing of candle below the level where the market previously swept the price of 49000 , this time market can target that liquidity and remove all the weak hand and FOMO trader who took their position due to dip in the market.
Let see If i goes correct.
UNION BANK Please consult your financial advisor before investing.This is only for learning purpose of chart.
We are NISM certified EQ and MCX trader but not SEBI register investment advisor.
MOST UNDERVALUED BANK IN PSU BANK GOOD TIME TO HOLD IN PORTFOLIO FOR INVESTOR WITH SMALL SL 114.50-115.70....
TradePlan #Nifty 50 4th Oct 2024First Step of a successful trader is to build a Trade plan & review what he has done. (education purpose for all )
*Trend is down
*Trade plan: Sell on rise
*for Critical levels see the video
Jai Hind.
Disclaimer :
This video is only for educational purposes. Please consult your financial advisor before you take any trade.
Market Impact of Israel-Iran Conflict: A Focus on BANKNIFTYGiven the current geopolitical scenario, BANKNIFTY may face downward pressure. We can expect that if tensions persist, BANKNIFTY could potentially fall to its next psychological level of 51,000 . Investors are advised to remain cautious and consider defensive sectors like pharmaceuticals and FMCG during this period of uncertainty so plan your trades accordingly.
BANKNIFTY has more room for fall.As we can see BANKNIFTY has successfully changed its short term trend exactly from our given zones and can be seen headed towards next important demand zone. Also following the global news, we can expect market to open negative which could possibly break the demand zone leading to further downfall but we must keep a watch on tomorrows closing as it can be very crucial deciding the upcoming direction of the market so plan your trades accordingly.
Strong REJECTION from our trendline!! What’s next?As we can see BANKNIFTY resisted exactly from our given trendline and closed below our trendline in weekly timeframe. We had a negative bias all the way through and waited for candle to close and we did see a negative pinbar candlestick confirming the downtrend. Now following the trend we can expect BANKNIFTY to fall more till it takes support around the next important trendline SUPPORT as seen in the chart so plan your trades accordingly.
Much awaited candle has formed!As we can see BANKNIFTY got strong rejection from our given trendline as we expected and has been waiting for weekly candle to form for the same reason. Now as long as BANKNIFTY maintains itself below the trendline, every rise can be sold so plan your trades accordingly.
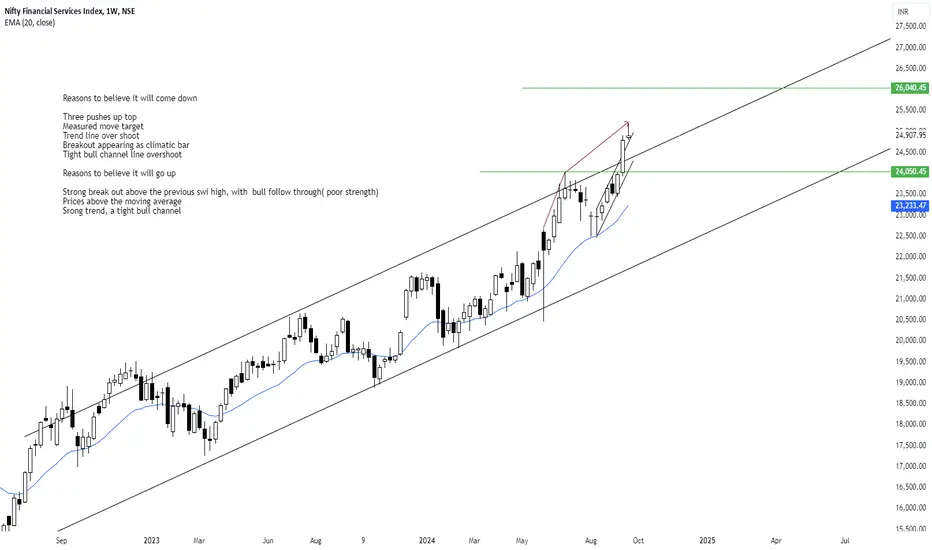
FINNIFTY WEEKLY ANALYSISLooks like two legs sideways to down might be seen in FINNIFTY. The tight bull channel, breakout of the trend channel line should set up a reversal, Since it is a tight channel, in a strong bull trend, any reversal should result in side ways movement, rather than a bear trend. The reasons for the bars to move higher or lower are mentioned in the chart
SUMICHEM - Taking support at weekly zone, identified on DailySUMICHEM - Taking support at weekly zone, identified on Daily on 29-09-2024
Stock has given an explosive candle earlier showing good break above weekly supply zone. Now came down to retest the same zone so it can be a good opportunity to add with minimum margin of safety.
Important levels and SL mentioned on the chart
BANKNIFTY yet to close above the trenline!As we can see BANKNIFTY managed to close above the given trend line. But the weekly candle is yet to be formed hence we cannot yet make decision based on todays closing above given trend line unless tomorrow it closed hence tomorrow's candle could really be important and decisive so plan your trades accordingly.
HDFC BANK WEEKLY ANALYSIS SWING TRADE
- EARN WITH ME DAILY 10K-20K –
HDFC BANK Looking good for upside..
When it break level 1690 and sustain.. it will go upside...
BUY@ 1695
Target
1st 1784
2nd 1881
HDFCBANK JUL FUT – LOT 6 (Qty-3300)
MINIMUM 10L CAPITAL
This stock is really good for INVESTMENT…
Enjoy trading traders.. Keep add this STOCK in your watch list..
Big Investor are welcome..
More 2 days to go for trend confirmation.As we can see BANKNIFTY had been in continuous uptrend nearing important trendline which can act as a potential resistance hence we might see this weekly candle as very decisive candle as if crosses above the given trend line the we may see more of upmove but can fall if any signs of bearishness in seen weekly time frame so plan your trades accordingly.
this WEEKLY candle could decide upcoming direction!!As we can see BANKNIFTY has already started to show signs of sluggishness heading towards important supply zone and trend line which has been respected by market multiple times hence any DOJI kinda candle near this trend line then we may expect BANKNIFTY to start new trend which is downtrend but if breaks and sustains then we may see 100000++ till new financial year so plan your trades accordingly.
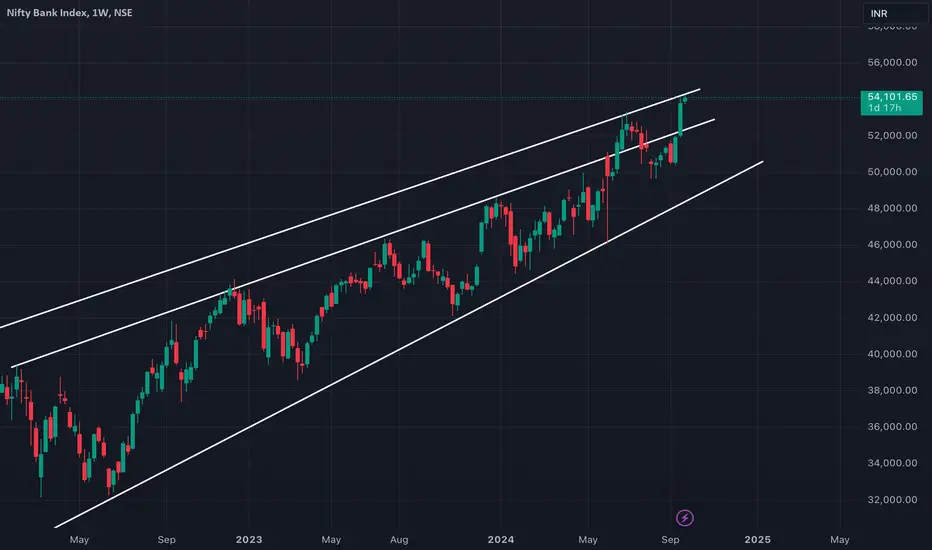
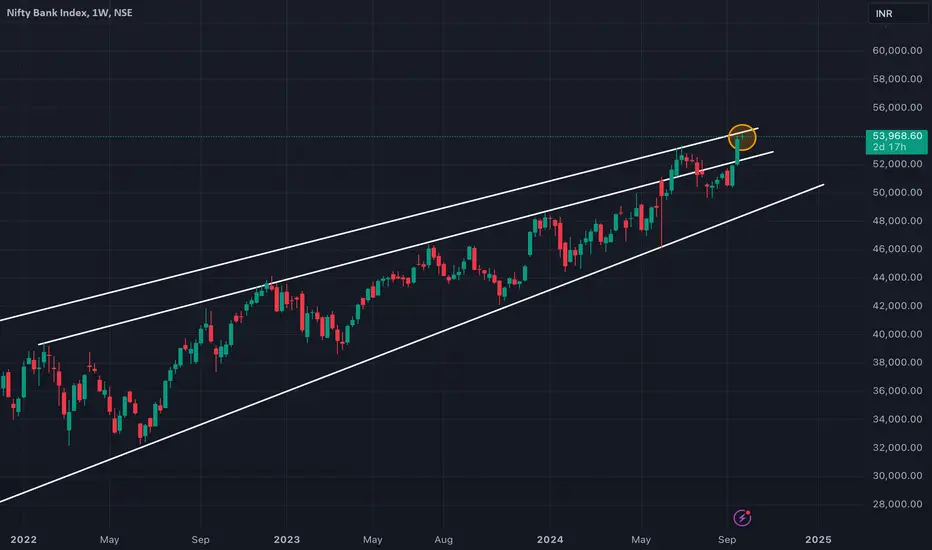
BANKNIFTY heading towards important level now!As we can see BANKNIFTY had been unidirectional in nature breaking new highs every other day. Now following the trendline we can see a strong supply zone around 54300 levels which had been respected in weekly time frame and hence we can expect some rejection from that levels too so plan your trades accordingly and keep watching everyone.
NEW ATH is here!! What’s next?As we can see BANKNIFTY finally made a new ATH which was much expected as NIFTY already made new ATH. Watching closely, we can see Market is overly bullish giving no chance to bears to take over making every dip a buying opportunity so we may see BANKNIFTY touching the trendline taking resistance there so plan your trades accordingly.