BAJAJ FINSERV ATH BREAKOUTBajaj Finserv has been consolidating since 2021 and had formed a bullish pennant pattern , which it has already given breakout of , If The stock gives strong weekly closing above all time high levels with good volumes it can bring further momentum in stock
Do lookout for weekly closing above 1933 levels for possible target of ~ 2800 on positional basis
Multiple Time Frame Analysis
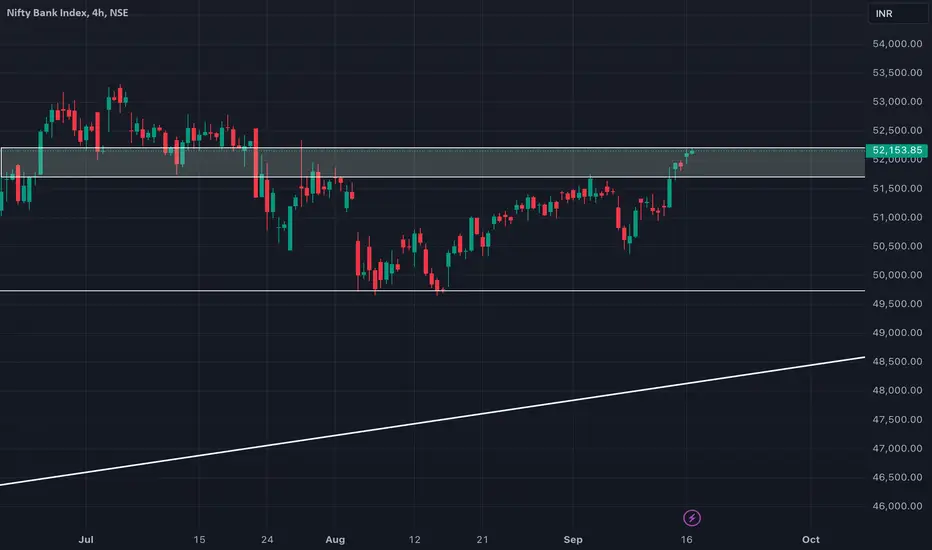
New ATH coming up for BANKNIFTY!!As we can see BANKNIFTY got rejected around its previous supply zone but managed to close above our zone making it bullish and ready for new ATH so plan your trades accordingly as new ATH might bring new uncertainties which could be a possible trap so keep watching everyone.
BANKNIFTY at crucial ZONE!!As we can see BANKNIFTY finally broke its important supply zone leading to big unidirectional break as we had been analysing in past few days. Hence as long as BANKNIFTY maintains itself below that zone then we may see sideways to sluggishness again but if manages to break after opening flat then we may see another strong upmove and new ALL TIME HIGH in coming trading sessions so plan your trades accordingly.
SLUGGISH as analysed.As we can see BANKNIFTY remained sideways to negative throughout the day as analysed in our last post as it was trading at crucial zone. Hence our view remains intact as it can remain sideways to negative in coming sessions until BANKNIFTY breaks last swing high so plan your trades accordingly.
IFCI - Multiyear Breakout - MonthlyIFCI - Multiyear Breakout - Monthly
Multi-Year Breakout: The chart indicates a multi-year breakout with strong volume, suggesting a potential long-term uptrend.
16yrs high Breakout: Neckline marking a 16yrs breakout, which could be a shorter-term confirmation of the trend.
Support Level: The low of the breakout candle is marked as a support level at 59, which can be a critical point to watch for potential pullbacks.
This setup looks promising for those interested in technical analysis and lon
BANKNIFTY can be seen trading at resistance..?as we can see BANKNIFTY has finally filled its pending gap and closed at important resistance which previously acted as a strong support hence as long as BANKNIFTY is below that zone, we may expect NIFTY to remain sideways to negative till it finally breaks out for new ATH so plan your trades accordingly.
Cartrade Multi-Year Breakout: If CarTrade is experiencing a multi-year breakout with a target price of 1150, this indicates a significant bullish signal based on technical analysis. The price reaching or surpassing this target could suggest a strong upward trend, provided the breakout is confirmed with increased volume and sustained momentum.
Devyani International Potential Bullish MomentumFollowing a notable consolidation phase that commenced in January 2024, Devyani International has exhibited promising technical signals, suggesting a potential shift towards a bullish trend. Last week, the stock successfully breached the pivotal resistance level of 185 on the weekly timeframe, which is a critical psychological and technical milestone.
The 20 EMA has crossed above the 50 EMA on the weekly chart, a classic indicator of bullish momentum known as a "Golden Cross." This crossover ty
BANKNIFTY still trading in an important ZONE..?As we can see BANKNIFTY is still trading in important zone which previously acted as a SUPPORT and possibly act as a RESISTANCE hence till BANKNIFTY breaks out above 52520, the breakout cannot be confirmed hence it can lead BANKNIFTY to remain sluggish to sideways in coming trading sessions till it breaks the zone leading BANKNIFTY to new ALL TIME HIGH so plan your trades accordingly.
IRCTC INTRADAY TRADE LOOKS PROMISING ON CHARTSMethodology- Demand & supply
By using multiple time frame analysis we have our zone at the best location and to top it up, it coincides with the intermediate time frame which gives the lower time frame zone the strength to push stock price upward. This can act as a trap for convention technical analysis as they will be selling at the zone where the chart is telling the big bulls are interested to buy
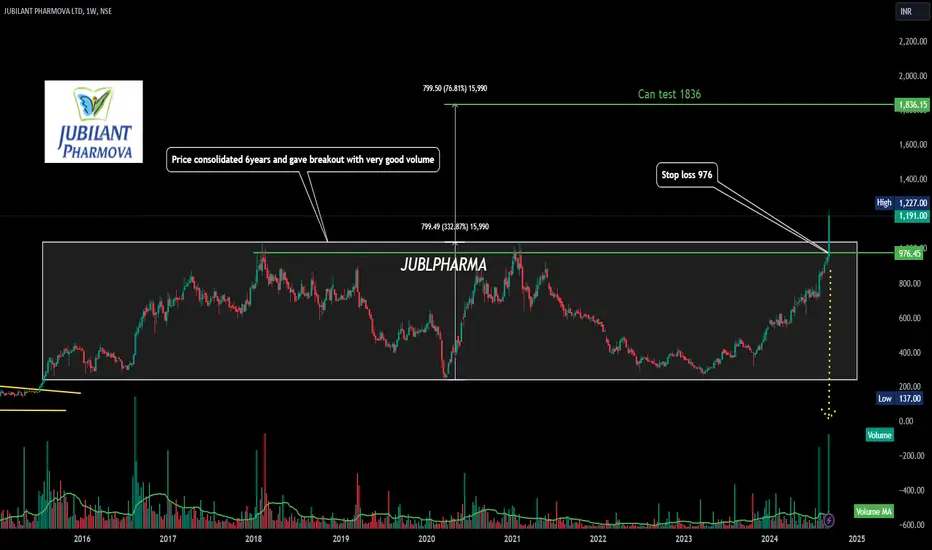
JUBLPHARMA - 6 Years -Consolidation breakout - WklyJUBLPHARMA - Price consolidated 6 years and gave breakout with very good volume.
Good setup to enter if it retest the breakout around 1000 levels.
Name - JUBLPHARMA
Pattern - Consolidation Breakout
Timeframe - Daily
Volume - Very Good volume
Cmp - 1191
Target - 1836
SL - 976
Here’s a summary of Jubilant Pharmova Ltd’s Q1 FY25 results:
Financial Highlights
Net Profit: Jubilant Pharmova reported a net profit of INR 482.10 crore, a substantial increase from INR 6.40 crore in the sa
BANKNIFTY will get STRONGER above 51350..?As we can see BANKNIFTY is forming more like a cup and handle pattern is smaller time frame which is a strong bullish signal but the only criteria is that BANKNIFTY has to open flat to strong but if fails then we may see another bear takeover with false breakouts. Hence as long as BANKNIFTY maintains itself below 51350, we may see sideways to negative market till it finally breaks out for directional move so plan your trades accordingly.
Exact REVERSAL from our given levels.. what's next..?AS we can see BANKNIFTY reversed exactly from our given zone of 50350-400 as we discussed in our previous analysis. Now as the level got respected being an important SUPPORT, we may expect BANKNIFTY to remain strong till that zone is taken care of which may lead to being sluggish is gets below 51100 levels so plan your trades accordingly.
PVR Inox on the way to 2144 ....Sharing for Educational Purpose Formation of WW and showing trend strength to move up.
Its a Weekly chart and had multiple resistances on the path.
Hence it will be up and down journey not a straight path to destination
Price will clear resitances on the way to 2144 with Patience .
Swing Low as my SL for study purpose.
This gives good RISK:REWARD
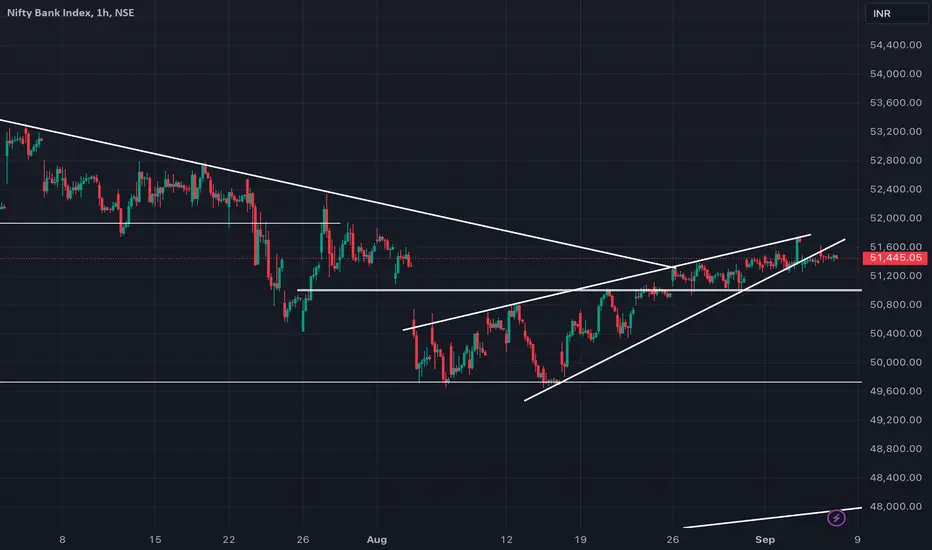
much awaited fall is here!! where are we heading next..?As we can see BANKNIFTY fell more than 1000 points which was well expected as BANKNIFTY had been forming more like a rising wedge pattern. Now an immediate support can be seen around 50350-50500 levels being both previous swing and psychological level but if that level is breached below the we may see another sharp fall of over 500++ points which could be directional in nature so plan your trades accordingly.
And the SLUGGISHNESS continues..As we can see BANKNIFTY remained sideways after opening weak but didn't let itself fall further making 51250 the final SUPPORT. our view had been negative following the structure of falling wedge despite BANKNIFTY showing strength in short term. HENCE as soon as BANKNIFTY breaches 51250 level and sustains below, we may see a sharp directional fall so plan your trades accordingly.
STRUCTURE vs DATA, who will win..?as we can see despite the break of rising wedge pattern, BANKNIFTY hasn't shown any significant downside move as we were expecting and remained sideways throughout the day after opening weak. Following the structure we can still expect bearishness for coming trading sessions but the DATA( option chain) shows huge OI build in OTM strike prices i.e 51500-52000 respectively which shows bullish bias largely hence unless the zones are breached, BANKNIFTY might remain bullish so plan your trades accor