Swing Analysis - Balaji Amines
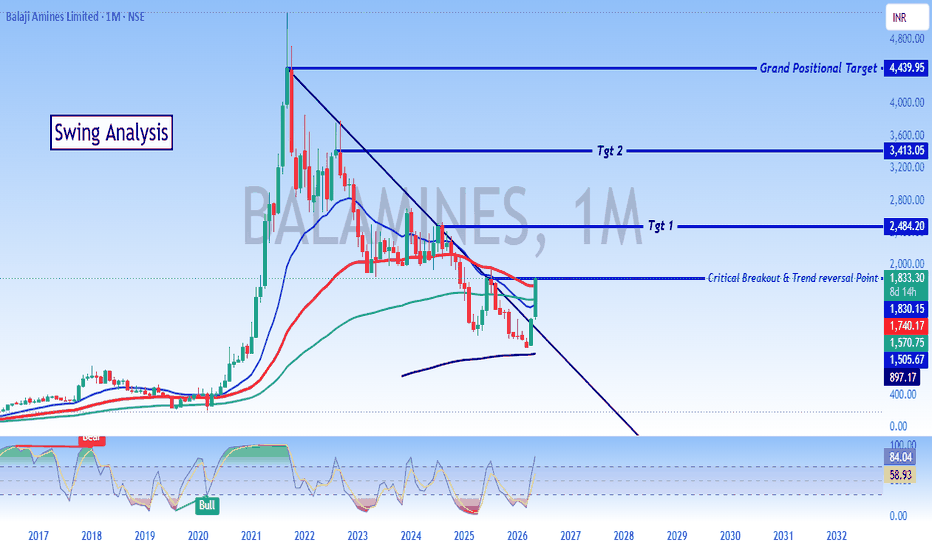
## 📈 BALAMINES (1M): Major Trend Reversal & Breakout Confirmed!
**Balaji Amines Limited** is flashing a massive bullish signal on the monthly (1M) timeframe. After a prolonged corrective phase from its 2021 highs, the stock has completed a textbook multi-year rounding structure/falling wedge and is breaking out from a critical juncture.
### 🔍 Key Technical Observations:
* **The Breakout Point:** The stock has forcefully breached the downward trendline that has capped prices for years. It is currently sitting precisely at a **Critical Breakout & Trend Reversal Point at ₹1,833.30**.
* **Moving Average Convergence:** Price action is surging above key short-to-medium-term moving averages (blue and red lines), confirming strong bullish momentum and a structural shift from "sell on rallies" to "buy on dips."
* **Stochastic RSI Shift:** Looking at the bottom oscillator, the momentum indicator has successfully hooked up from the oversold territory and is crossing above the 50-level line, signaling that the bulls are firmly back in control.
---
### 🎯 Key Targets & Price Levels:
The swing analysis projects a multi-stage upward trajectory now that the structural reversal is confirmed:
Ultimate long-term target, retesting the lifetime highs of the 2021 bull run. |
**What are your thoughts on Balaji Amines? Are you holding or watching for a clean monthly close? Let's discuss in the comments! 👇**
#BalajiAmines #BALAMINES #TechnicalAnalysis #SwingTrading #StockMarketIndia #TradingView #Investing #ChartOfTheDay #Nifty
### ⚠️ Disclaimer:
The analysis provided above is strictly for educational and informational purposes only. It does not constitute financial advice, an endorsement, or a solicitation to buy or sell any securities. Trading in the stock market involves substantial risk. Please conduct your own due diligence or consult a certified financial advisor before making any investment decisions.
Multiple Time Frame Analysis
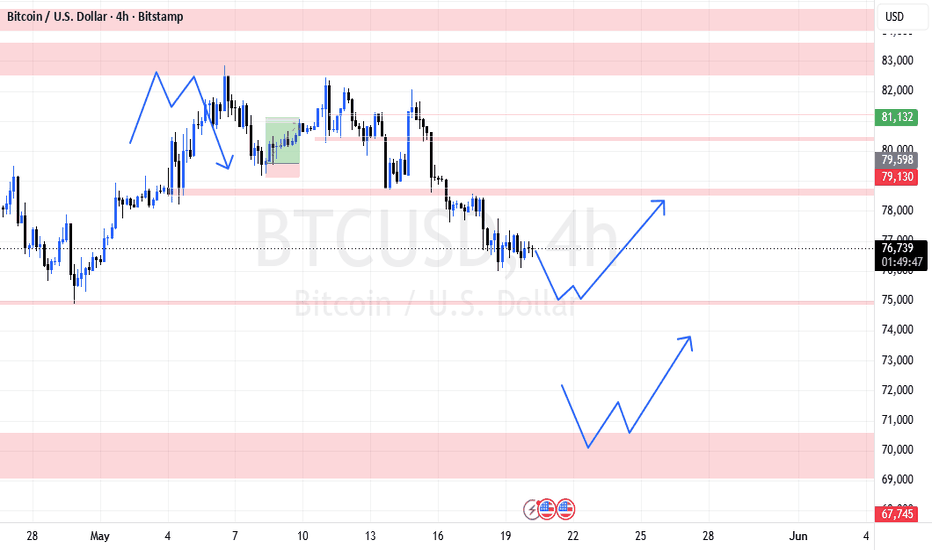
BTCUSD 4H Analysis: Navigating Discount Arrays & Liquidity PoolsMarket Context & Structure
Bitcoin (BTCUSD) recently faced heavy distribution near the $82,000+ region, leading to an aggressive bearish displacement that broke local market structure to the downside. Currently trading around $76,750, price action is consolidating in a transitional zone. Rather than forcing trades in the middle of this range, the most strategic approach is to wait for price to deliver into high-probability discount Points of Interest (POIs) to hunt for accumulation.
Technical Breakdown & Anticipated Scenarios
Based on the mapped demand blocks (red zones), we are tracking two primary paths for a potential bullish reversal, as indicated by the projections:
Scenario 1: The $75,000 Liquidity Sweep & Mitigation
The immediate downside target is the demand zone resting at the $75,000 psychological level. The projected path anticipates a sweep of sell-side liquidity (SSL) just below current consolidation, tapping into this block. If buyers step in to defend this level, we are looking for a structural shift to target the $78,000 - $79,000 supply zone (previous support turned resistance).
Scenario 2: Extreme Discount & Deep Accumulation ($70,000 Zone)
If bearish momentum sustains and slices through the $75k POI, the draw on liquidity will point heavily toward the extreme demand zone near $70,000. This level represents a massive structural floor. A deep plunge into this extreme discount area offers a high-reward macro setup. Accumulation here would provide the fuel needed for a strong rally back toward the $73,000 - $74,000+ fair value levels.
Trading Plan & Execution
Patience is critical. The middle of the range is for observation, the extremes are for execution.
Directional Bias: Macro Bullish, but heavily reliant on finding strong support in discount zones.
Entry Criteria: Set alerts for the $75,000 and $70,000 zones. Do not use blind limit orders. Once price taps these POIs, drop down to the 15m or 1H timeframes. Wait for the algorithm to show its hand via a clear Change of Character (CHoCH), a sweep of lower timeframe liquidity, and energetic displacement to the upside leaving a Fair Value Gap (FVG).
Invalidation: If the extreme $70,000 zone fails to hold and closes aggressively lower on the daily, the macro bullish bias must be reassessed.
Trade the reaction, not the prediction. Manage your risk closely!
(Disclaimer: This analysis is for educational purposes only and does not constitute financial advice. Always wait for your own confirmations before entering the market.)
Agreement/ No agreement?As we can see we are miles are apart for mediation. The hope for agreement and opening of hormuz is resulting in optimism in NIFTY. Technically, NIFTY is still negative and can show 23000 levels which is its next important demand zone. So plan your trades accordingly and keep watching everyone.
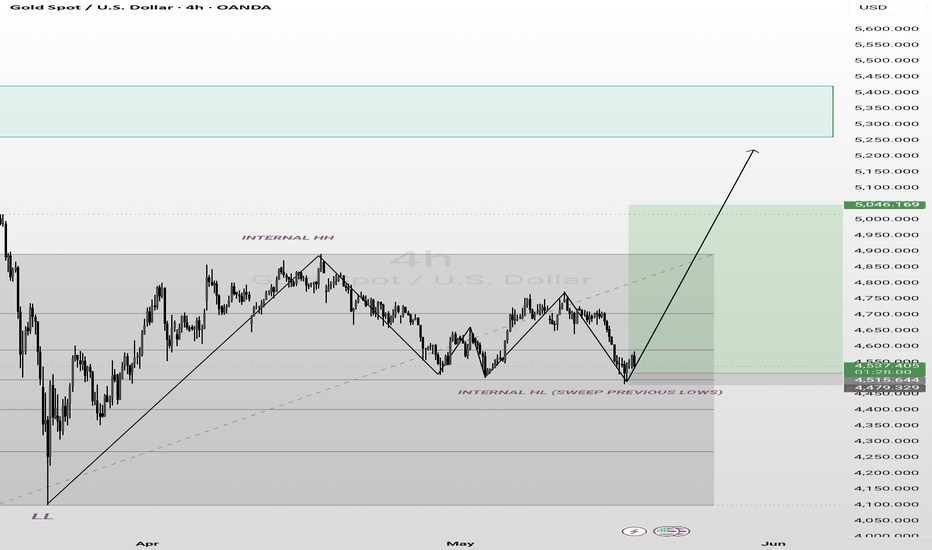
(XAU/USD) Gold TechnicalsTodays Asian Session Started with sweeping previos lows and London session remained bullish consolidation..
Current Sweep also comes in golden zone of fib levels of 0.6 . If this low sustains it will be our internal higher low for further upside move... in bigger timeframe. In larger structure this new internal high will act as new LOWER HIGH for Futher selling for downside.
If by any chance we again see new lows... then we must be cautious and plan for upside move with confirm reversals.
(XAU/USD) TECHNICAL ANALYSIS OF GOLDGold Price Are Near to previous lows. We can also see a stucture change in 4760 levels which is our new higher highs. If it is the true structure change then the current lows(4547-4585) can act as higher lows.
As long as the prices are above 4512 we can see bullish move till 4900-5000. The moment we see closing of candle in larger timeframe under 4500 it can fall futher more to downside.
4500 is currently acting as a higher low in larger time frame.. is standing in strong levels.
*I am sharing my idea for first time here.. feel free to ask me anything and correct me if i'm wrong. My analysis is little too short i'll try my best to explain in more simplied way next time.*
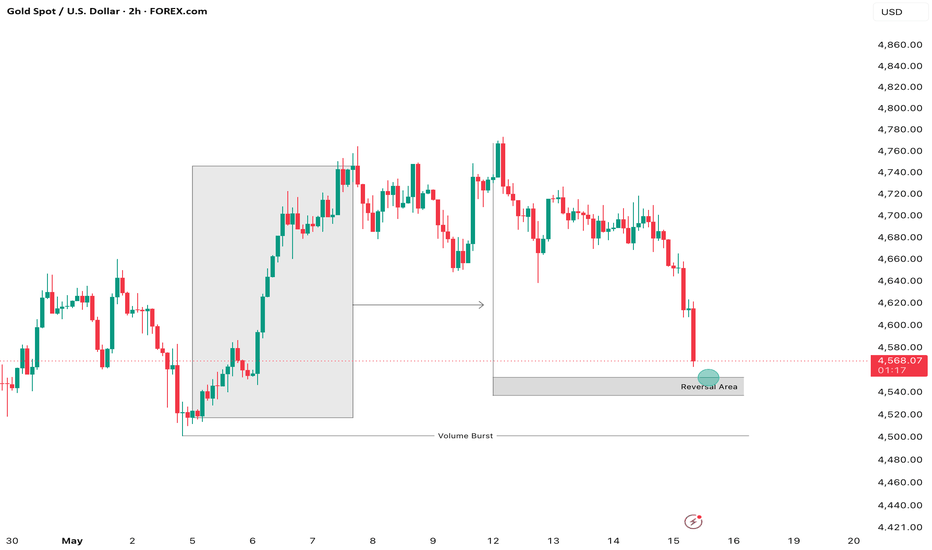
Market Analysis Summary: XAUUSD (Gold Spot)1. Structural Context & Trend Shift
Timeframe Focus: 2-Hour (2H) chart.
Recent Price Action: Gold experienced a strong bullish rally from May 5 to May 12, creating a well-defined consolidation block (gray shaded area).
2. Key Technical Levels
Current Price: $4,567.52 (-1.82%).
Immediate Support: The "Reversal Area" is identified between $4,535.00 and $4,550.00.
Critical Liquidity Level: The "Volume Burst" line marks major historical buying liquidity near $4,500.00.
Key Resistance: Previous structural breakdown point at $4,635.00.
3. Trading Scenario Breakdown
Condition: Price must find structural stability and print a bullish confirmation pattern (e.g., engulfing candle, pin bar) inside the designated Reversal Area ($4,535 – $4,550).
Target: A technical bounce targeting the $4,635 resistance zone.Invalidation: A clean 2H candle close below $4,530 invalidates the immediate long bias.
Bearish Scenario (Trend Continuation)
Target: Extension lower to sweep the critical Volume Burst liquidity level near $4,500.
NIFTY might show 23000-23150 levels on charts As we can see NIFTY despite its attempts failed to close higher showing bearish bias. We can expect NIFTY to continue its bearishness till the gap is filled which is till 23000 level which is also a psychological level and an important demand zone, from where we can expect signs of respite. So plan your trades accordingly and keep watching everyone.
NIFTY 50 Demand and Supply Zone analysisNIFTY-50 currently trading inside Weekly Supply Zone and and inside Weekly supply zone there is 4 hour supply zone from which nifty started falling.
We have Weekly Demand Zone neat at levels 23000 and also there is 4 hour demand zone as well co-inside with Weekly Demand Zone.
There is high possibility of Nifty 50 will travel from Weekly Supply Zone to Weekly Demand Zone
Note : This idea is only for educational and learning purpose and it's not a buying or selling recommendation.
More of gap filling move pending!As we can see NIFTY fell unidirectionally exactly as analysed with proper reasoning. Despite the fall, we can see more of gaps that are yet to be filled and hence we can expect NIFTY to continue this bear run and fill the gap completely before finally showings signs of relief. So plan your trades accordingly and keep watching everyone.
NIFTY looks very weak! As we can see NIFTY is forming more like an M pattern and the neckline has been tested multiple times now, which could act as a catalyst to boost fall. We can expect NIFTY to fall sharp and also fill the pending gap below! So plan your trades accordingly and keep watching everyone
NIFTY Weekly UpdateNIFTY has traded in the range of 23880-24480 for the last week, closing ~180 points higher for the week. 23850 acted as a good support level in the past, especially in the last few weeks, given it is also 78.6% fibonacci level. I expect the market to trade in the same range for the current week, unless there is a big positive or negative development in the geopolitical situation. On the downside, 22800 can act as a support level. While on the other side, 24800 will act as a resistance level.
Let me know your thoughts. DYOR.
IGB 10Y Weekly UpdateIGB 10Y closed 3 bps higher for the week while it continued to trade in the range of 6.88%-7.06% given the geopolitical uncertainty. I expect the yields to trade in the same range for the upcoming week as well, unless there is a big positive or negative development happens wrt US-Iran war.
Let me know your views. DYOR
24125-24150 can act as a support?As we can see NIFTY is getting rejected from our important supply zone. We can expect NIFTY to continue its bearishness further but we can see a demand zone around 24150 levels and we might expect NIFTY to get rejected and reverse from here. SO, plan your trades accordingly and keep watching everyone.
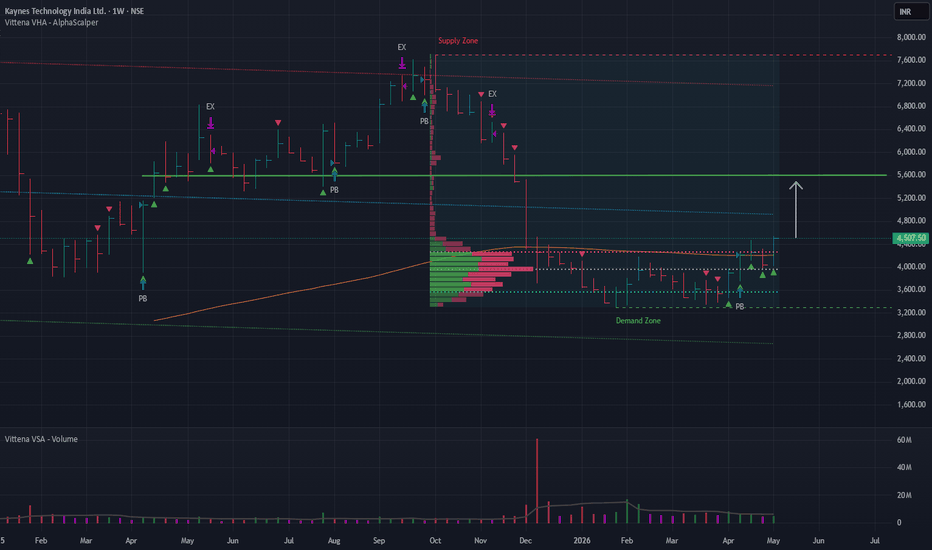
NSE:KAYNES – VSA Analytical NoteTimeframe : Weekly Chart
VSA Observations
Key Institutional Level Cleared: Stock recently crossed the 126 EMA at 4200, a key institutional benchmark.
Current Bar: Strong result with average effort — supply reduced, demand picking up. High close confirms demand persisted until session end.
Accumulation Evidence: Last four bars show subtle institutional accumulation, marked by VSA potential buy signals. Strategy‑optimized PB (potential buy) adds confirmation.
Relative Volume: Consistently at average levels, validating momentum.
Testing Bar: First previous bar shows testing volume — operators marked prices down to prompt selling and absorb supply to make further buying less resistant.
Multi Timeframe Alignment: Daily and 4H charts show similar VSA structure marking a confluence of signals.
Supplementary Analysis
Low volume node (LVN): Price is currently entering into an LVN, a thinly traded price zone where price quickly traversed, conditions ideal for next northward move. Price has closed well above the Value Area High mark adding to the upside bias.
Upside Potential
Target Zone: 5600 within 6–8 weeks.
Least Resistance Path: Large, quick drop in December 2025 created a gap zone; upside path is relatively clear.
Volume Surge: Healthy volume expansion could accelerate achievement of target, possibly in less than 8 weeks.
Summary
Potential upside toward 5600 within 8 weeks.
Disclaimer
Analytical use only. Not a recommendation or solicitation. User discretion required.
Courtesy: Vittena VHA AlphaScalper
Backtest Settings: Exit after 6 bars, Long only, RVOL.
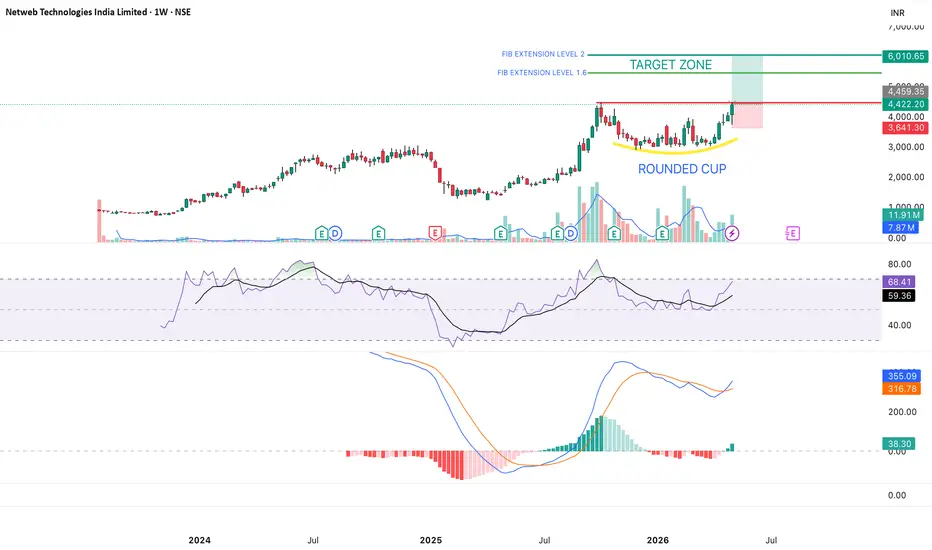
#NETWEB TECHNOLOGIES - ROUNDING CUP PATTERN FORMATION IN WEEKLY🚀 Trade Idea: NETWEB TECHNOLOGIES
📍 Setup: ROUNDING CUP BREAKOUT IN WEEKLY TIMEFRAME
⚡ Setup Quality: A
📈 Entry: Above ₹4500
🛑 SL: ₹3640
🎯 Targets: ₹5500 / ₹6000
ALPHA SETUP RATING:
OVERALL MARKET SCORE: 15/25 NEUTRAL
PRICE ACTION SCORE: 23/25 BULLISH
VOLUME SCORE: 22/25 BULLISH
MOMENTUM SCORE: 24/25 BULLISH
OVERALL SCORE: 84/100 A SETUP
Netweb is expected to jump to the levels of 6000 in the coming months as indicated by the price chart. Our personalised stock rating system has given a score of 87 to NETWEB which indicates its strength in Price, volume and momentum metrics.
⚠Disclaimer: This is for demonstration and educational purpose only. This is not buying or selling recommendations. I am not SEBI registered. Please consult your financial advisor before taking any trade.
Exact rejection from our given supply zone! Trapped!?As we can see NIFTY got rejected exactly from our supply zone which has been pre determined. Now as long as NIFTY manages to stay below our supply zone, every rise can be shorted, unless it manages to close itself above the supply zone, giving confirmation which can then show strong uptrend followed by W pattern. So, plan your trades accordingly and keep watching everyone.
JYOTISTRUC - Multi Timeframe Demand Zone Reversal SetupNSE:JYOTISTRUC
Jyoti Structures Ltd is showing a strong structural recovery from a long-term Monthly Demand Area with visible accumulation across higher timeframes.
Key Observations:
Weekly chart shows a clean breakout from a falling channel structure.
Price respected the Monthly Demand Area and formed higher lows after prolonged decline.
Daily timeframe confirms momentum continuation with strong bullish candles and rising volume participation.
Price is now trading above short-term EMAs , while attempting to reclaim higher moving averages.
RSI strength on both Weekly and Daily charts indicates improving bullish momentum without extreme overheating yet.
Immediate resistance zone is near previous supply around 15–16 levels.
Sustaining above breakout zone may open further trend continuation possibilities.
Trade Structure:
Bias remains bullish above the breakout support zone.
Volume expansion and EMA alignment will be important for continuation confirmation.
Failure to hold breakout structure may lead to retest of demand zone before next directional move.
Educational View:
This chart is shared purely for educational and learning purposes to demonstrate:
Multi-timeframe analysis
Demand zone reaction
Channel breakout structure
EMA trend transition
Volume and momentum confirmation
=================================================================================
Disclaimer:
I am not a SEBI-registered Research Analyst or Investment Adviser. This publication is only for educational purposes and should not be considered financial, investment, or trading advice. Please do your own research and consult your financial adviser before making any investment decision. Trading and investing in securities involve market risks.
Strong upmove coming up in NIFTYAs we can see NIFTY has been forming W pattern in bigger time frame, which is a strong BULLISH reversal structure. The neckline for the structure can be seen around 25360-400 levels, on break of which could show 25500, 25700 unidirectionally. So, plan your trades accordingly and keep watching everyone.
NIFTY's last moment recovery, could be a gamechangerAs we can see, NIFTY had been bearish in the first half, exactly as analysed in our previous post. But, it showed a strong recovery in closing hours, which shows that bulls have overpowered the bears and taken control as they also managed to close NIFTY above 25000 levels which is both a psychological level and important supply zone. Hence, we can expect NIFTY to show some strength from here in the form of short covering. So, plan your trades accordingly and keep watching everyone.
NIFTY Monthly/Weekly UpdateAfter one of the worst month in March, NIFTY has seen some recovery in the April month gaining ~7.5%. The last three weeks of April, market has been trading in the tight range of 23800-24400. Unless there is a big development in the Geopolitical tensions, market might stay the same for the current week as well. For the May month, I expect market to trade in the broad range of 22300-26300.
Let me know your thoughts. DYOR
IGB 10Y Monthly/Weekly UpdateIGB 10Y has risen by ~6 bps for the April month (8 bps for the last week), amid the continuation of geopolitical tensions and elevated crude oil prices. Market is pricing the higher inflation rates, which paves the way for rate hikes. This is also visible across OIS curve, with 6M OIS is trading around 5.62% which means market pricing in one rate hike, as on today, within 6 months.
High crude oil prices for long periods will be negative for Indian economy as we majorly import our crude products. The spillover effect can also be seen in the other industries related to fertilizers etc, which again moves up the inflation higher.
For May month, I expect IGB 10Y to trade in the range of 6.85%-7.25%. For the current week, I expect IGB to trade in the range of 6.97%-7.15%.
Let me know your thoughts. DYOR.