ADANIPORTS: Ascending Triangle BreakoutAfter nearly two years of consolidation, ADANIPORTS stock has finally broken out of its range, indicating a potential trend continuation.
The ideal entry zone lies between 1600–1650, with an upside target of 2000+.
Risk can be managed by placing a stop loss just below the ascending support trendline, keeping the setup intact.
Multiple Time Frame Analysis
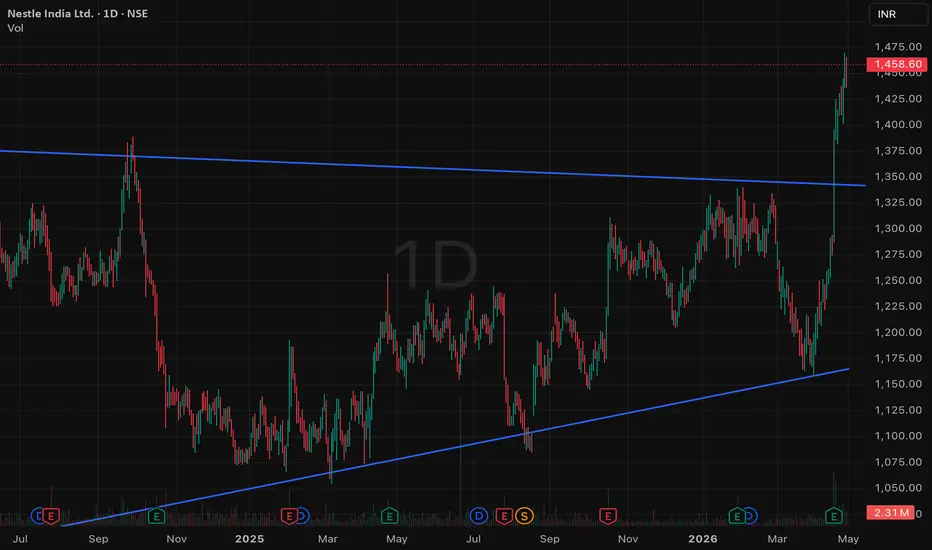
NESTLE: Triangle Pattern BreakoutNESTLE has been consolidating for few years forming a triangle pattern and has clearly broken the resistance now. Based o the calculation, stock is expected to move up in the long term.
Stop loss would be around 1288 price range and expect a potential risk reward ratio of 1:3
USD/CHF – 4H Supply Rejection | Staggered Sell LimitsThis setup reflects a multi-timeframe, liquidity-based approach using passive execution (sell limits) aligned with institutional supply zones and session-driven volatility.
Context (HTF Bias):
Price is currently trading within a broader 1D demand zone, but has retraced into a well-defined 4H supply region nested inside a larger bearish structure. The descending trendline overhead reinforces directional pressure and suggests continuation potential after mitigation of supply.
LTF Alignment:
Within the 4H supply, a 30M supply zone provides refined entry precision. The recent market structure shift (MSS) to the downside confirms short-term bearish intent following a corrective rally.
Execution Model:
Rather than chasing price, I’ve deployed staggered sell limit orders across the 4H supply zone. This allows:
* Improved average entry price
* Reduced slippage
* Passive participation at key liquidity levels
Risk Management:
* Fixed fractional model: 1% risk per trade idea
* Positions are distributed across the zone to optimize fill efficiency
* Invalidation sits above the supply structure
Targets:
Primary objective is a return into the 1D demand imbalance, with partials taken at intermediate inefficiencies and prior lows.
Trade Logic Summary:
* HTF demand + LTF supply = internal rebalancing
* Entry at premium pricing within supply
* Confluence: trendline resistance + MSS + session timing
* Execution during London/New York sessions only
Key Insight:
This is not a breakout trade. It’s a liquidity-based mean reversion entry within a broader range, exploiting inefficient pricing at supply before continuation.
---
Disclaimer: This is a discretionary trade idea based on personal analysis and risk framework. Not financial advice.
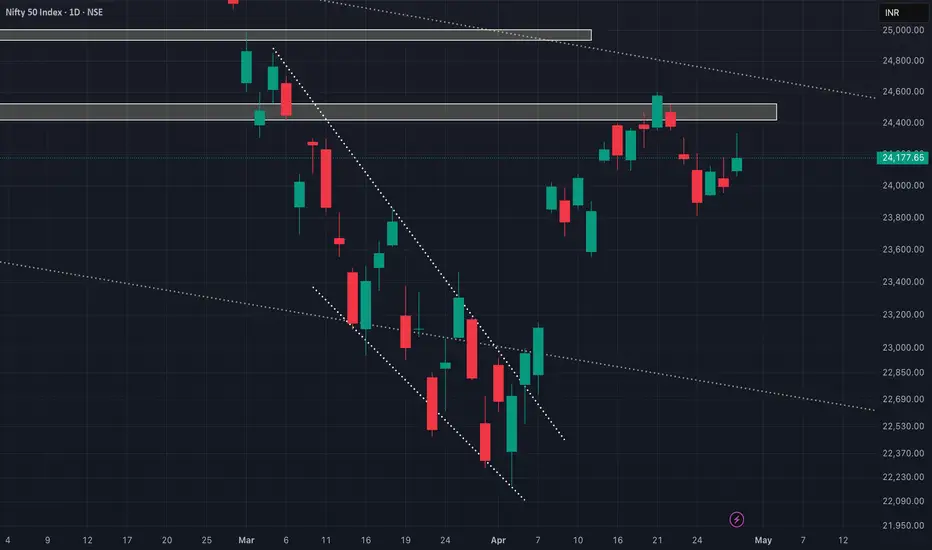
NIFTY could not hold itself at higher levels!As we can see despite the strength in the first half, it lost mostly all of its gains ending up making a long tailed candle. The candle formed is more like an inverted hammer showing signs of bearishness. Hence we can stand by our analysis, shorting the rise unless it sustains itself above 23600 levels. So, plan your trades accordingly and keep watching everyone.
NIFTY remains weak below 24200As we can see NIFTY managed to show some short covering but it is expected to remain short-lived as there exists an important supply zone around 24200. Until NIFTY manages to break above this zone, every rise can be shorted for bigger targets. So, plan your trades accordingly and keep watching everyone.
IGB 10Y Weekly UpdateIGB 10Y traded in the tight range of 6.86%-6.98% for the last week, amid unsettling geopolitical tensions and rising crude oil prices. Unless there is a big positive or negative news, market is expected to trade in the similar range for the current week as well. If it breaches this range, 7.06% can act as a support level, and 6.78-6.80% as a resistance level.
Let me know your thoughts. DYOR
NIFTY will continue its bearishness below the zone.As we can see NIFTY had been bearish, exactly after getting rejected from the supply zone. NIfty is expected to remain sideways to bearish as no immediate strong support can be witnessed below. Additionally, NIFTY can get even more weaker if it breaks below 23500 level as theres a massive gap downside which is yet to be filled. So stay cautious and plan your trades in accordance with the levels and view provided.
And the bearishness continues...As we can see NIFTY remained bearish throughout the day exactly as analysed in our post, as it couldn't sustain itself above 24500 levels. We can stand by with that analysis and expect NIFTY to remain bearish and every rise can be sold. So, plan your trades accordingly and keep watching everyone.
HOW-TO: Identify Intraday Support Resistance Zones EffectivelyHello,
look at index like nifty banknifty and stocks worked very well on our automated tool all in one set up indicator built for all market structure.
todays nifty on first candle bounce from lower levels( support) and then again bounce/reverse to downside from upper level( resistance) twice.
Static indicator to simply the deicision .nifty, banknifty, midcapnifty or crudeoil , brentcurude or any instrument.
USDCAD | Intraday Long Bias from HTF Value Area Low📈
Timeframe: Intraday / Day Trade
Bias: Bullish (Mean Reversion)
Setup Type: Value Area Rotation
⸻
🧠 Trade Idea:
USDCAD has rotated into the HTF Value Area Low (VAL), positioning price in a discount zone where buyer activity is expected. The idea is to capitalize on a potential rotation back toward higher value as responsive buyers step in.
⸻
📊 Execution Plan:
* Entry: Near VAL with confirmation (rejection / bullish response)
* Stop Loss: Below VAL (acceptance below = invalidation)
* Target 1: Value Area Mid (POC)
* Target 2: Value Area High (VAH)
⸻
⚖️ Risk Management:
If price accepts below VAL, the long thesis is invalidated. Risk is clearly defined at the lower boundary, allowing for a controlled downside while maintaining upside potential toward value.
⸻
⚡ Confluence:
✔️ HTF VAL support
✔️ Discount pricing
✔️ Mean reversion setup
✔️ Clear invalidation level
⸻
💬 Final Thoughts:
This is a location-based trade—buying at value extremes with a defined risk. The key is watching for buyer response at VAL; without it, the setup loses validity.
⸻
Not financial advice. Manage your risk.
NIFTY looks weak below 24500As we can see NIFTY couldnt sustain itself above the level and fell after opening weak. Hence, going by the analysis, we can expect NIFTY to remain weak below this level unless iit manages to sustain above 24500 level as this level will again act as a resistance. So, plan your trades accordingly and keep watching everyone.
NIFTY managed to close above the strong supply zone! what's nextAs we can see NIFTY managed to close above the supply zone which is a sign of strong bullishness, but we need a weekly candle close too. For now, as long as we are above this zone, every dip can be bought for 24700-25000 respectively. So, plan your trades accordingly and keep watching everyone.
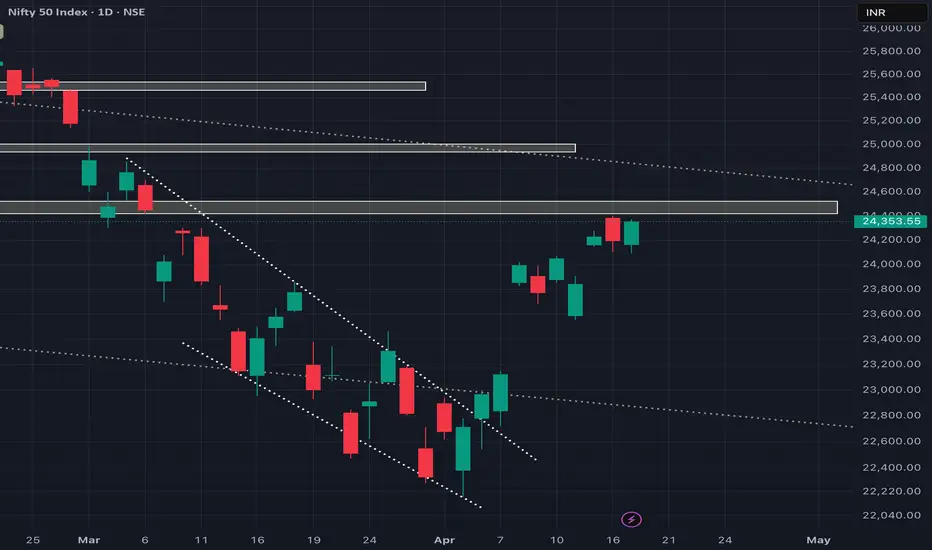
NIFTY Weekly UpdateNIFTY has continued its upward momentum, though with volatility, by gaining ~300 points during the last week. 24400 acted as a key resistance level for the last week, which I expect to continue this week as well. 24800 will act as the next resistance level. On the other side, 23900 zone will act as a support level, considering this is 78.6% Fibonacci level.
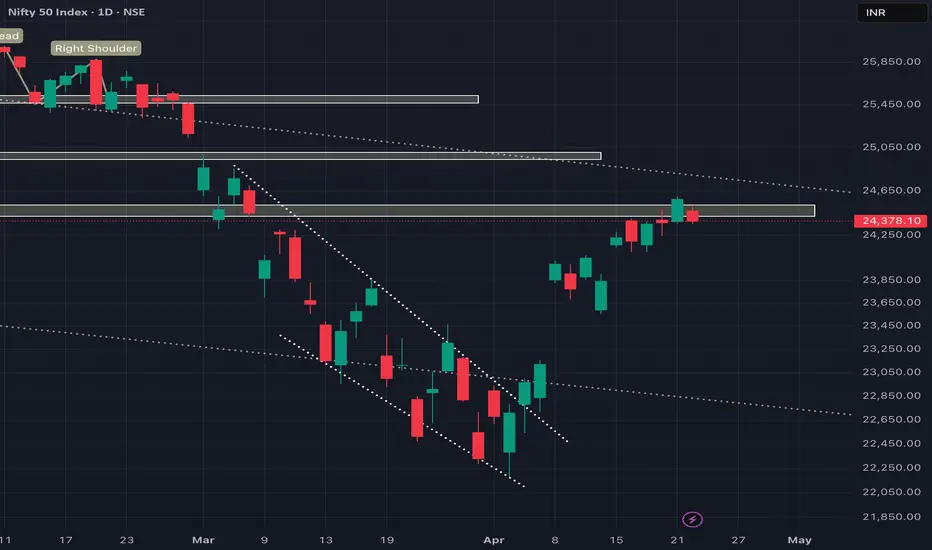
NIFTY back at Problem zone!!As we can see NIFTY is trading at important supply zone which has been analysed in our previous post. The level 24300-24500 will not let NIFTY move above unless it manages to sustain itself above that zone. So, until and unless NIFTY manages to sustain itself above 24500, it remains negative to sideways. So, plan your trades accordingly and keep watching everyone.
We are bullish, but can lead to gap covering below 24100!!As we can see NIFTY showed rejection from our given levels, exactly as analysed. Now that the supply zone is tested, we can expect NIFTY to break through that zone, once it manages to hold itself above 24250. On the other hand, if NIFTY couldnt hold itself at higher levels, we may see NIFTY being weak and fill all the pending gaps below 24100, resulting in sharp fall. so, plan your trades accordingly and keep watching everyone.
24300 level could create some problems!!As we can see NIFTY managed to continue its upmove though it was sideways throughout the day but the overall market looks stable, ready for short covering. But there are few minor resistances like 24300 which acted as a strong supply zone previously and can act the same. Hence unless we close above 24300-24350, we could remain sideways to bearish. So, plan your trades accordingly and keep watching everyone.
IGB 10Y Weekly UpdateIGB 10Y has seen one of the strongest rally for the week, falling 21 bps for the week, amid the hopes of the US-Iran peace deal, even though attacks on Lebanon has continued by Israel which is against one of the ten points truce deal proposed by the Iran. As the peace talks have failed over the weekend, I expect the volatility to continue this week in the markets.
Further, Crude oil fall and rupee strengthening have supported the yields amid the possible truce deal.
For the coming week, I expect 6.88-6.90% will continue to act as a resistance level, with 6.78-6.80% beyond this. On the other side, 7.00% will act as a first support level, 7.06% beyond that and 7.12-7.15% further.
NIFTY Weekly UpdateNIFTY has risen more than 1300 points (~5.89%) for the week, its largest absolute gain in terms of points, amid the hopes of the US-Iran peace deal, even though attacks on Lebanon has continued by Israel which is against one of the ten points truce deal proposed by the Iran. As the peace talks have failed over the weekend, I expect the volatility to continue this week in the markets.
Last week, the market has broke out of the descending channel pattern and continue to inch upwards ever since. For the coming week, 23800 zone (78.6% Fibonacci level) should continue to act as a support level, 23000-22800 level below this. On the upside, 24400 can act as a first resistance level and 24800 beyond this.
Let me know your thoughts. DYOR.
Will get bearish only below 23650!Following the recent developments as the negotiation failing but the ceasefire is still in place hence untill and unless the hormuz strait is blocked but its open as of now. Technically we are still strong unless NIFTY breaks below recent swing of 23650 that would lead to GAP covering so plan your trades accordingly and keep watching everyone.