ITC 3M: Liquidity Grab at Highs → Bearish Expansion Toward FVG### **Market Context**
* Price has tapped into **External Liquidity (~470 zone)**
* A clear **manipulation phase** is visible at the top (distribution)
* Strong bearish displacement confirms **shift in order flow**
* Price is now likely seeking **inefficiencies (FVG) below**
---
## **Primary Bias: Bearish (HTF Correction Phase)**
---
## **Trade Plan**
### **Entry Zone (Sell Setup)**
* Watch for pullback into:
* **315 – 320 zone** (−1 level / supply reaction)
* Confirmation:
* Weak bullish candles
* Lower timeframe CHoCH / BOS
* Rejection wicks
---
### **Targets**
1. **Target 1:** 272 (−1.5 level)
2. **Target 2:** 240–250 (3M FVG fill)
3. **Target 3:** 228 (−2 level)
4. **Extended Target:** 185 (−2.5 level)
---
### **Stop Loss**
* Above **402 (0 level)**
* Conservative stop: above **recent swing high (~445)**
---
## **Alternative Scenario (Bullish Continuation)**
* If price **reclaims 402 and sustains above**, expect continuation toward **470 liquidity sweep**
* This invalidates the bearish setup
---
## **Key Concepts Used**
* External Liquidity Grab
* Smart Money Manipulation Phase
* Fair Value Gap (FVG)
* Fibonacci Expansion (−1, −1.5, −2 levels)
---
## **Summary**
Liquidity taken at highs followed by bearish displacement suggests a pullback sell setup, targeting inefficiencies and lower manipulation levels.
---
Multiple Time Frame Analysis
NIFTY looks promising from here!As we can see NIFTY finally seems to have broken out from the falling wedge pattern and has also managed to close above 23000 level which was an important supply zone. hence, we can expect NIFTY to continue its upmove and every dip can be bough until it manages to sustain itself above 23000 levels. SO, plan your trades accordingly and keep watching everyone.
NIFTY broke out but yet to sustain itself above 23000!!As we can see NIFTY broke out exactly as analysed in our previous and moved unidirectionally. Now looking at the structure we can still expect NIFTY to continue upmove but we can see NIFTY trading at important supply zone and an important psychological level. So, until and unless NIFTY sustains itself above 23000, there wouldnt be a clean upmove and can remain sluggish so plan your trades accordingly and keep watching everyone.
IGB 10Y Weekly UpdateIGB has seen another worst week in the recent times, rising around 20 bps for the last week over the previous week. This is primary because of the inflation and growth fears, apart from BoP and fiscal deficit impact due to the ongoing war. Market started to price in Rate hikes, which is being reflected in the yields across the curve as well.
For the coming week, 7.15% should continue to act as a good support level. Any breach of this, could take the yields to 7.25% levels. On the other side, 7.06% could act as a resistance level, further 7.00% given its confluence with the trendline.
NIFTY Weekly UpdateNIFTY traded in the range of 22180-22940 for the last week, amid the unsettling geopolitics and only three trading days in the week. It formed another Lower Low on the channel which implies weaker trend, though this has bought up.
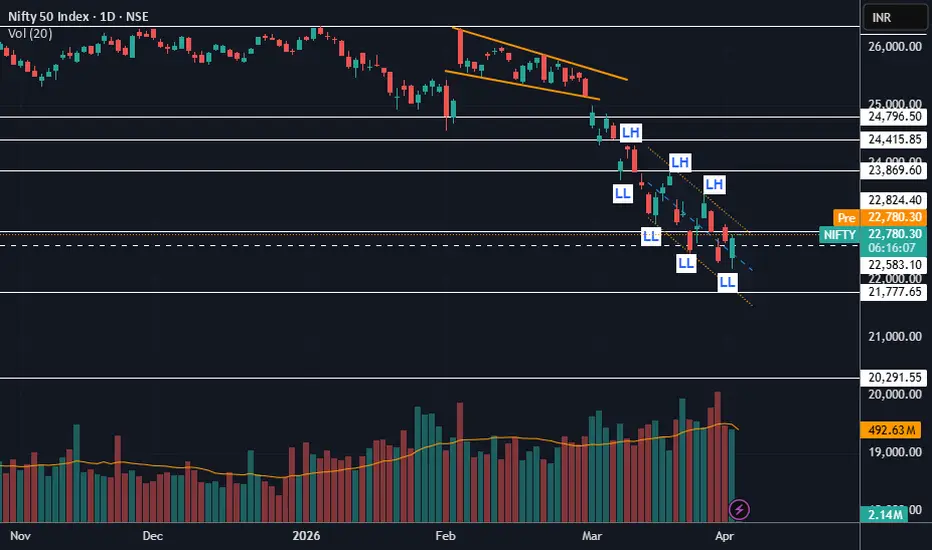
For the coming week, 22180 is the key level to watch out for. Any breach of this, would push the NIFTY to 21800 levels. On the upside, 23000 is the first level to watch out for, considering this is last week high and channel high levels as well. Any breach of this, could take the NIFTY to 23800 levels.
Looks like a FALLING WEDGE but....As we can see NIFTY has been forming more like a FALLING WEDGE pattern which is a sign of REVERSAL but we are still trading below 23000 level making it sluggish to negative but we may expect a strong upmove if manged tp break off the wedge and the psychological level so plan your trades accordingly and keep watching everyone.
SIDEWAYS unless NIFTY sustains above 23000 level!As we can see NIFTY despite opening strong failed to continue its upmove showing signs of weakness. Additionally, we can see trendline resistance around 23000 level which is also a psychological level hence until and unless we see NIFTY sustaining above the given trendline, NIFTY can reamain sideways so plan your trades accordingly.
IGB 10Y Monthly UpdateIndia’s 10‑year government bond yield (IGB) has seen one of the worst months since January 2018, closing around 6.96% and rising by 30 bps over the week. The ongoing US-Iran war raised concerns around fiscal deficit and inflation numbers due to raising crude oil prices and supply shortage in natural gas. The first half of the month, yields got support from RBI in terms of OMO purchases amounting to Rs. 1.76 Lakh Crore. During the second half of the month, RBI was out of the market and fiscal deficit concerns from excise duty cut have spiked up the yields. It touched 7.00% level during the month, which is multi-year trendline level as well.
For the April month, I expect yields to trade broadly in the range of 6.75%-7.25%. 7.00%-7.03% will continue to act as key support level, any daily close above the trendline will cause the yields to rise toward 7.10% level, with 7.25% beyond this. On the other side, 6.88-6.90% will be key resistance zone, with 6.80% being the next resistance level.
22000 coming up! we might see some short covering from here!!As we can see NIFTY did fell unidirectionally exactly as analysed in our previous post. Now it looks like we are heading towards important demand zone. Hence, we can expect some short covering from here as the important demand zone and psychological level is coming closer which might not let NIFTY fall unidirectionally from here so plan your trades accordingly and keep watching everyone.
MAYHEM to continue!As we can see NIFTY fell exaclty as analysed and even failed to take support at the trendline support in weekly time frame indicating major concern as there is no immediate demand zone in NIFTY which could lead NIFTY towards 21000 levels in long turn so plan your trades accordingly and keep watching everyone.
IGB 10Y Weekly UpdateIndia’s 10‑year government bond yield (IGB) has seen one of the worst weeks in recent times, closing around 6.93% and rising by 17 bps over the week, as fiscal‑deficit fears have increased following the Indian government’s excise‑duty cut on OMCs. These concerns are primarily emanating from the ongoing U.S.–Iran war, which has led to supply‑risk worries for crude and natural gas. Although some relief has come in the form of Iran allowing Indian tankers through the Strait of Hormuz, the situation is still far from being out of crisis.
IGB touched multi‑year trendline levels of 6.96% on Friday, which will remain a key resistance to watch. A breach of this level could push yields toward 7.05% and then 7.15%. On the downside, 6.87% will act as a key support level, with 6.80% beyond that.
NIFTY Weekly UpdateNifty closed 1.28% lower during the last week, amid unsettling geopolitical tensions. During the week, the market recovered over two sessions, driven by hopes of a U.S.–Iran de‑escalation plan, but as Iran later dismissed the U.S. proposal as “one‑sided and unfair,” markets corrected on Friday.
Nifty has been forming lower highs and lower lows on the chart, which is a bearish pattern. Hence, for the coming week, I expect Nifty to trade in a channel pattern with a downward bias. The previous lower‑low zone of 22,470–22,500 will be an important level for the market. If it breaches this zone, 21,800 might act as a support level. On the upside, 23,900 will act as the first resistance level, and 24,400 beyond that.
EURUSD – 4H | Institutional Workflow PerspectiveCurrent price is rotating into a well-defined demand zone (~1.1510–1.1500), nested within a broader higher-timeframe support structure. This area previously acted as a displacement origin, suggesting the presence of unmitigated institutional orders.
Narrative:
The market has transitioned from a short-term distribution phase into a corrective pullback. The recent bearish leg appears corrective rather than impulsive, lacking sustained momentum and failing to print decisive lower lows. This reinforces the probability of responsive buying at discount.
Execution Plan:
* Entry: Within the support zone after confirmation (LTF shift / bullish displacement)
* Invalidation: Clean break and acceptance below 1.1490
* Target: 1.1650 resistance (premium liquidity pool)
* R:R: ~4.5
Confluence:
• HTF demand alignment
• Liquidity resting below equal lows (sell-side draw)
• Inefficient price delivery (imbalance) into support
• Mean reversion toward premium pricing
Key Focus:
Patience for confirmation is critical. No anticipation—only participation once orderflow confirms institutional intent.
This is a classic buy-side campaign from discount to premium, assuming the current demand holds.
#EURUSD #Forex #PriceAction #SmartMoney #TradingView #FXTrading
NIFTY isnt bullish unless it sustains above 24870Despite the string closing NIFTY doesnt looks promising as it just seems to be due to potential agreement between US and Iran but it didn't seem successful so it is likely to fall despite the strong closing. So, plan your trades accordingly and keep watching everyone.
Will this trendline act as a RESISTANCE now!?As we can see NIFTY despite opening strong remained more like sideways and got rejected exactly from our trendline. We can expect NIFTY to get rejected from our trendline SUPPORt which can act as a RESISTANCE now so as long as we are below that, every rise can be shorted so plan your trades accordingly and keep watching everyone.
Will the strong opening sustain!?As we can see NIFTY broke below the trendline and showed a strong unidirectional fall exactly as analysed in our previous post but now following the global cues we can expect NIFTY to open strong but the question is if it would sustain. IF it manages to sustain over the trendline, it is liley to continue its bull run else the mayhem continues so plan your trades accordingly.
Nifty Swing Squeezing in channe Gift/Nifty Swing reversal set-upHello,
Nifty at 22530-50 corrrected around 15 % from high of 26400 in just month as ongoing concerns of War now oscillators showing bullish divergneces reversals RSI positive divergence in 2 hours timeframe... all lower to medium timeframe are showing reversals.
as price are far away from 200EMA as it shows negative trend but also works as Mean revesion point . as price is Squeezing in channel from long.
Our demand zone is still protected !As we can see NIFTY has been continuously rejecting from our demand zone which shows the strength of the demand zone. But it has been tested multiple times now making it weaker hence any closing below 22950-22900 level can lead to another strong unidirectional downfall. So we must keep these levels on watch and plan our trades accordingly.
Where NIFTYIT headed?The NIFTYIT has breached the double-top pattern target level of 29,600. During the last week, it traded within the range of 29,600–28,400 amid a falling rupee. The coming week will be crucial for the index's directional movement.
A breach of the 28,400 level could bring more pain to the index, with 27,800 acting as a support level and 26,200 as further support. On the upside, a breach of the 29,600 level will rally the index to 31,300.
IGB 10Y Weekly UpdateBonds have traded largely within a range of 6.69%–6.77% amid geopolitical tensions in West Asia and rising oil prices, falling rupee, which are raising concerns around foreign reserves and inflation. With the RBI largely out of the market, geopolitical developments will play a major role in the coming week.
6.78% has been acting as a crucial level since February. A breach of this level is likely to push yields towards 6.88%. If geopolitical tensions cool off, yields can retrace towards 6.65%.
NIFTY Weekly UpdateNIFTY traded weakly within the range of 23,870–22,930 amid geopolitical tensions last week. For the coming week, I expect the market to trade in the same range unless there is a significant change in the geopolitical scenario.
If it breaches 22,800, the previous swing low of 21,800–22,000 can act as support. On the upside, 23,850 should act as a resistance level, with 24,400 beyond it.