Multiple Time Frame Analysis
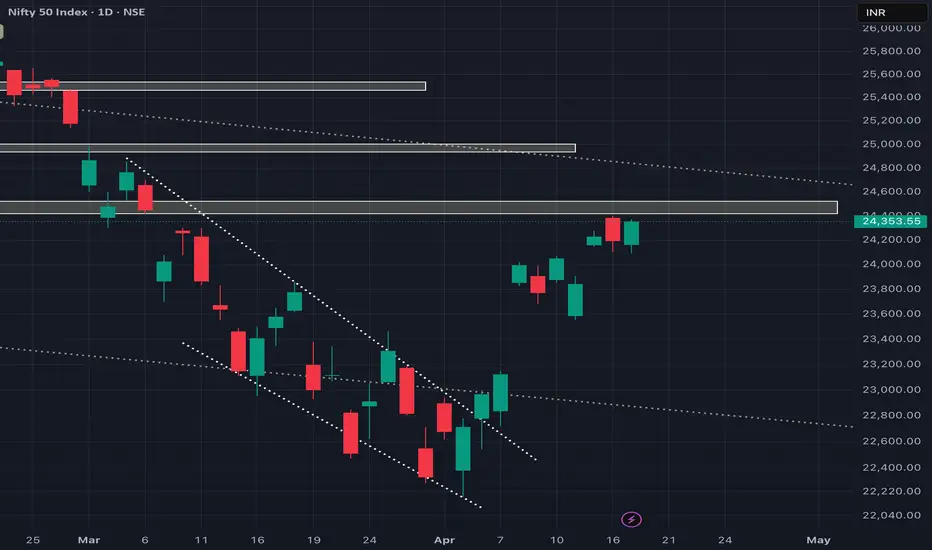
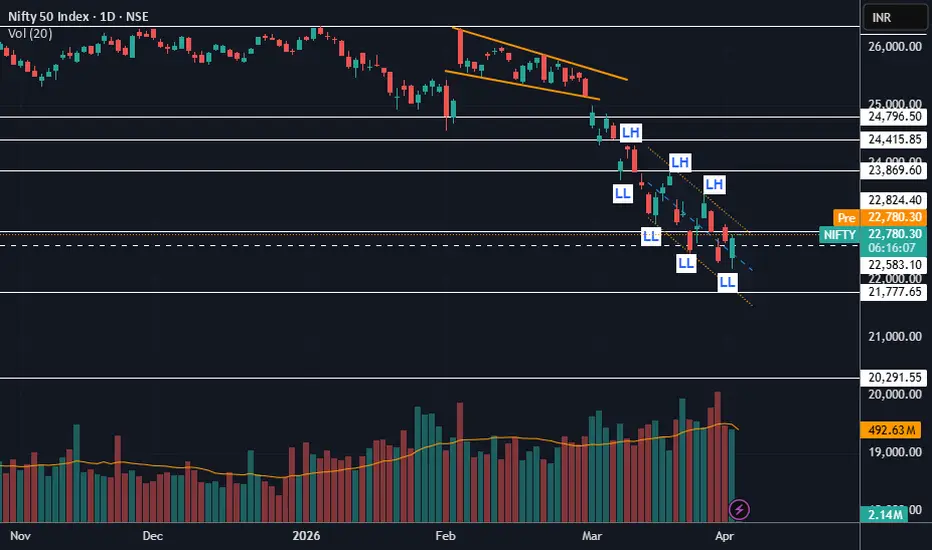
NIFTY to remain weak below 25000As we can see NIFTY remained weak throughout the day and managed to recover but still below our demand zone hence we can expect NIFTY to remain negative below 25000 level as this demand zone will not act as a SUPPLY ZONE. Moreover, we can expect more of bearishness if NIFTY broke below 24600 levels so plan your trades accordingly and keep watching everyone.
NIFTY to remain bearish for now!As we can see NIFTY fell strongly exactly from our given levels exactly as analysed. Following the global cues, we can see NIFTY to continue its bearishness following the global cues which can add fuel to the fire. So until and unless NIFTY closes itself 25500 we are very bearish. so, plan your trades accordingly and keep watching everyone.
IGB 10Y Weekly/Monthly UpdateIGB 10Y has formed a descending triangle on daily charts, with 6.64% acting as a support level. A breakout from the pattern indicates a drop in the yields to 6.50%.
Hence for the coming month are expected to trade in the range of 6.50%-6.78%. 6.65% has been acting as a crucial support since last few weeks and it expected to remain the same. If it breaches, this level, it likely to find support at 6.60%, which acted as resistance in the earlier range bound motion. On the upside, if it breaches 6.75% level,it may find resistance at 6.88% levels.
ONGCONGC
Price above all EMA on weekly and daily chart shows its strength.
Recently it closes above its weekly/monthly range and price sustain above the level.
May have little hurdle near 290-300 but then it moves above 300
QoQ shows improving
Rest sectorial stocks like BPCL, IOC, MGL etc are showing showing strong moves.
NB: I am not a Registered analyst, do take advice from your financial advisor prior trade.
We are very bearish below 25400Following the structure we can see the demand zone has been tested multiple times making it weaker and the rise in OI also adds fuel to the fire making NIFTY extremely weak and looking further we can see there is no eminent demand zone below 25400 so we may expect a sharp unidirectional downfall in coming trading sessions which could lead NIFTY to 24100-25000 so plan your trades accordingly and keep watching everyone.
Traders Demon Finder: The Hidden Reason Retail Traders LoseTraders Demon Finder (Live Panel Walkthrough): When a “Perfect Long” Is Still a Trap — and How MARAL Filters It
Chart reference: STABLEUSDT.P (1H) with MARAL — Execution Workflow panels (Router + Regime + Cost + Stress Bridge + Cap27)
Retail traders usually lose on moves like this even when the direction is correct.
Not because the market “cheated” — but because the hidden demon shows up:
The Demon = “Permission ≠ Safety”
Retail sees green, sees bullish candles, enters hard…
…and gets punished by liquidity thinness, overextension, and cost/fill risk.
Your attached panel is literally a Demon Finder because it exposes those hidden killers before they become losses.
1) What your attached panels are saying (in plain words)
A) Context Board (top-right)
Bias is Bullish (HTF alignment looks strong).
Structure/momentum are supportive.
Daily context shows Neutral (important: not a clean trend day every time).
Liquidity context is LOW (this matters more than most traders think).
Meaning: Direction supports LONG, but the environment may still punish sloppy entries.
B) Accuracy Audit (left) Panel ..
You have:
PERMIT LONG with a limited entry window (5 bars)
HTF / Regime / Momentum scoring looks strong (green)
Sweep = Pending
Reclaim = No
Liquidity threat showing LOW, but sweep/reclaim state is not complete.
Meaning: The system is not saying “buy anytime.”
It’s saying: “Long is allowed — but liquidity sequence is not fully resolved.”
Retail usually ignores this and becomes exit liquidity.
How this panel works
Accuracy Audit Panel (Pre-Entry Gate) — Full Details (Console-Style)
Purpose:
The Accuracy Audit is the final gate before entry.
Even if bias is bullish, this panel decides if the entry is safe, timely, and valid.
Think of it like an aircraft checklist:
Direction is not permission. Audit is permission.
1) STATE
What it is: Current phase of the workflow.
Typical states you may see:
PRE-ENTRY → you are still qualifying the trade
IN TRADE → trade is active (now management rules apply)
STAND-DOWN → no trade allowed (block)
How to act:
If PRE-ENTRY → you are allowed to evaluate only, not to “force entry”
If STAND-DOWN → do nothing, wait for next cycle
2) PERMIT
What it is: The permission direction printed by the workflow.
Examples:
PERMIT LONG
PERMIT SHORT
NO PERMIT
How to act:
If NO PERMIT → trade is invalid even if chart looks bullish/bearish.
If PERMIT LONG/SHORT → continue to the next audit items (not instant entry).
3) HTF (Higher Timeframe Alignment)
What it is: Whether higher-timeframe context supports the direction.
Often shown like:
2/2 (strong alignment)
1/2 (partial)
0/2 (misaligned)
How to act:
2/2 → green light for evaluation
1/2 → caution: reduce aggression / wait for cleaner confirmation
0/2 → stand down (don’t fight HTF)
4) REGIME
What it is: Market operating mode.
Examples:
TREND (2/2)
RANGE
TRANSITION
How to act (simple):
TREND → continuation trades are valid (with rules)
RANGE → only range logic; no chasing breakouts
TRANSITION → highest trap risk; only take entries if other gates are perfect
5) LIQ THREAT (Liquidity Threat)
What it is: How dangerous the liquidity environment is for wicks/stop hunts.
Examples:
LOW / MED / HIGH
How to act:
LOW → normal execution
HIGH → smaller size, tighter timing, avoid late entries
Liquidity threat is where retail gets “mystery wicked.”
6) SWEEP
What it is: Whether the liquidity sweep sequence is completed.
Examples:
PENDING
DONE
NOT REQUIRED
How to act:
PENDING → do not rush; market may still hunt liquidity
DONE → cleaner execution zone
7) RECLAIM
What it is: Confirmation that price reclaimed the level after sweep.
Examples:
NO / YES
How to act:
NO → sweep may still be active; entry is risky
YES → stronger confirmation that trap phase ended
8) MOMENTUM
What it is: Whether momentum supports the direction now.
Often shown like:
2/2 or STRONG / WEAK
How to act:
Momentum strong = good only if liquidity + timing gates are ok
Momentum without reclaim = retail chase trap (classic)
9) RISK
What it is: Risk health check (internal risk state).
Often shown like:
2/2 or OK / WARNING
How to act:
If risk is not green → you don’t “force entry”
Risk gate protects your account, not your ego.
10) ENTRY SCORE
What it is: The final “quality score” of the setup.
Example:
8/10 GREEN
How to act:
8–10 → eligible for entry inside window
6–7 → acceptable only with reduced size
<6 → skip (this is the demon filter)
11) DECISION
What it is: The action outcome of the audit.
Examples:
ENTER (rare; only when fully clean)
WAIT (Liquidity pending)
STAND-DOWN
How to act:
WAIT is a valid decision (it prevents traps).
Enter only when Decision + Window allow it.
12) MODE
What it is: Governance mode.
AUTO = workflow drives decisions
MANUAL = operator override rules apply (if you use)
How to act:
AUTO mode is best for consistency and discipline.
The Most Important Part — The Entry Window (5 bars)
When the audit says PERMIT LONG it may also say:
“LONG | Window 5 Bars”
Meaning:
Entry is only valid within that short window
If you miss it → your entry becomes late, and the demon returns (overextension + wick risk)
Example interpretation (common real case)
If you see:
PERMIT LONG ✅
HTF 2/2 ✅
REGIME TREND ✅
SWEEP PENDING ⚠️
RECLAIM NO ⚠️
ENTRY SCORE 8/10 ✅
DECISION: WAIT (Liquidity pending)
MARAL meaning:
“Bias is correct, but liquidity sequence is not clean. If you enter now, you may get wicked.”
That’s exactly how the Audit panel saves retail traders.
C) Execution Console (center)
Key lines in your console are the real story:
GLOBAL STATE: ENTRY_PERMITTED
SETUP: LONG
Entry permission: Allowed (but still shows a WAIT component)
LIQ Reason: Low Liquidity
Trade status: VALID
Exit permission: HOLD
Meaning: This is the exact “retail demon” zone:
✅ Long is permitted
⚠️ But the reason says LOW LIQUIDITY → spreads/slippage + wick risk + fake continuation bursts
So MARAL is permitting participation with caution, not cheering aggression.
D) Scalp / Execution Panel (right-mid)
You’re showing:
Setup LONG / Entry OK
Route lock armed
LTF Exec: Supportive
Stress (pre): Low
Cost/Fills: RISK
Exit: HOLD
Meaning: Price action is cooperating, but execution quality can still degrade (fills/cost).
This is where retail over-sizes and then blames the market for a stop-out wick.
E) Post-Entry Stress Panel (bottom-right)
You have:
IN TRADE: YES
Stress: NORMAL
Exit pressure: LOW
Obstacle: NO
Overextension: YES
Cost/Fills: RISK
Action: HOLD
Meaning: The trade can continue — but it’s in an overextended state.
That changes how you manage: protect structure, don’t chase.
2) The hidden reason retail loses even in bullish context
When a market is bullish, retail still loses because they do this:
Retail Pattern
Sees bullish move → enters late
Uses wide/random stop because “it’s strong”
Price does a normal pullback → they panic-exit or get wicked
Trend continues → they re-enter worse → emotional spiral
What your panel exposes
Low Liquidity → higher wick probability
Overextended = YES → late entries have poor R:R
Cost/Fills = RISK → execution quality can erase edge
Sweep Pending / Reclaim No → liquidity sequence may not be “clean” yet
That combination is the demon.
3) What MARAL is designed to do here (the correct behavior)
This is the exact moment MARAL was built for:
✅ If LONG is permitted but Low Liquidity / Overextended / Cost Risk is present:
MARAL-style response is NOT “go big.”
It’s:
Reduce aggression
smaller size / tighter participation
Respect the window
if you miss the 5-bar window → stand down
Do not chase vertical candles
overextension means entries must be precise or skipped
Let management be state-driven
if Exit Pressure is LOW and Action says HOLD → don’t invent fear
If Cost/Fills stays RISK
you treat it as “execution tax” and avoid adding risk
This is execution governance, not prediction.
Traders Demon Finder
The Hidden Execution Traps That Destroy Retail Traders — and the MARAL Solutions That Neutralize Them
Retail traders don’t lose because they can’t “predict direction.”
They lose because they keep walking into execution demons — invisible problems that hit after the bias looks correct.
Your attached MARAL panel is a Demon Finder because it exposes those hidden issues in real-time and forces a governed response.
Demon #1 — Late Entry / Chasing
What retail does:
Price moves strong → they chase the candle → stop goes “somewhere” → a normal pullback wipes them.
How it shows in the panel:
Entry Window = 5 bars (if you miss it, you’re late)
Overextension = YES (late entries have poor R:R)
✅ MARAL Solution:
Entry is allowed only inside the permission window.
If window expires → stand down (no chase).
Overextension flag tells you: “If you enter now, you are paying premium.”
Demon #2 — Liquidity Trap (Sweep Pending / Reclaim Not Done)
What retail does:
They buy/sell into a zone where liquidity is still being collected → wick-out → then price moves without them.
How it shows in the panel:
Sweep = PENDING
Reclaim = NO
✅ MARAL Solution:
MARAL does not treat “bias” as execution-ready until liquidity sequence is clean.
This prevents becoming exit liquidity for smarter participants.
Demon #3 — Low Liquidity Environment (Wick + Slippage Risk)
What retail does:
They assume all markets execute the same way.
But low liquidity = more wicks, poor fills, and fake continuation spikes.
How it shows in the panel:
LIQ Reason: Low Liquidity
Liquidity Context: LOW
✅ MARAL Solution:
MARAL labels the environment and forces a conservative mode:
reduce aggression
avoid late entries
no “market order gambling”
treat this as execution-risk, not “analysis failure”
Demon #4 — Cost/Fills Risk (Execution Tax)
What retail does:
They ignore the “cost of trading” (spread + slippage + entry quality).
Even correct trades become weak outcomes.
How it shows in the panel:
Cost/Fills = RISK
✅ MARAL Solution:
MARAL surfaces cost as a live constraint.
If Cost/Fills stays RISK → you don’t add size or force entries.
It prevents “death by small execution cuts.”
Demon #5 — Permission Confusion (Signal Mentality)
What retail does:
They treat any green condition as a permanent “BUY signal.”
How it shows in the panel:
ENTRY PERMITTED (not “guaranteed”)
Permission can still have a WAIT component and require sequence completion.
✅ MARAL Solution:
MARAL is not “signal = buy.”
It is permission = you may participate only if rules remain valid.
This stops impulse trading.
Demon #6 — Post-Entry Panic (Emotional Exits)
What retail does:
They enter, then panic-exit on normal pullbacks… or hold blindly with hope.
How it shows in the panel:
IN TRADE = YES
Stress = NORMAL
Exit Pressure = LOW
Action = HOLD
✅ MARAL Solution:
MARAL provides state-based management:
If Exit Pressure is LOW and Action says HOLD → don’t invent fear.
If stress/exit pressure rises → management adapts early.
This is the “trade stability” layer retail doesn’t have.
Demon #7 — Oversizing Into Danger
What retail does:
They size biggest when confidence is highest (usually late and overextended).
How it shows in the panel:
Overextension = YES + Cost/Fills = RISK + Low Liquidity
This combination is the classic “retail trap zone.”
✅ MARAL Solution:
When 2 or more risk flags appear, MARAL response is:
reduce size
no add-ons
only window-based entry
manage by state (not emotion)
The MARAL Demon Finder Rule (simple and powerful)
If these flags appear together:
LIQ Reason = Low Liquidity
Overextension = YES
Cost/Fills = RISK
Sweep Pending / Reclaim No
Then MARAL treats the trade as:
✅ Direction may be right
⚠️ Execution is dangerous
➡️ Participate only with governance, or stand down.
That’s the whole point.
Why MARAL Execution work flow Was Built
Retail loses from execution chaos, not analysis errors — so MARAL was built as an execution-governance system that audits entry, controls permission, and manages post-entry stress in real time.
Note :
This is an educational workflow demonstration only. It is not financial advice, not a signal service, and not a guarantee of returns. Trading involves risk; use your own risk limits and judgment.
GBPJPY Bullish Bias - 2With very strong bullish power coming in and netting us a profit, I believe GBPJPY still has a good potential to head to the upside, with targets expected upwards of 213.000
Manage risk properly and use proper scaling plan. Risk past profits to ensure mitigation of principal capital.
Back at DEMAND ZONE! Another REVERSAL!?As we can see NIFTY can be seen trading at important demand zone which is also supported by the neckline of the head and shoulders pattern hence we nmay expect another strong upmove in NIFTY if manages to close itself above 25450 levels so plan your trades accordingly and keep watching everyone
Bullish Bias Intact — Gap Fill Reversal Loading This WeekAs outlined in my pre-session analysis, the higher-timeframe bias remains clearly bullish — price action is simply confirming the plan. The market opened with a gap that is still unfilled, and inefficiencies like this rarely stay untouched. Expect a controlled reversal to fill the gap within this week — potentially initiated from Tuesday’s move, otherwise likely toward the weekly close.
If you agree with the analysis, comment below after the price action confirms.
NIFTY doesnt looks strong enough!as we can see despite the recovery NIFTY coudlnt form a promising candle above our demand zone which coud result in weakness in coming trading sessions but strong weakness will only follow if NIFTY manages to close itself below the demand zone so plan your trades accordingly and keep watching everyone.
We are back above our demand zone! Signs of BULLISHNESS!?As we can see NIFTY again took support at our demand zone and recovered substancially. Now that it managed to close itself above the demand zone, we may expect NIFTY to continue its upmove unless it breaks below so plan your trades accordingly and keep watching everyone.
IGB 10Y Weekly UpdateIndia Goverment Bonds 10Y for the coming week are expected to trade in the range of 6.65%-6.78%. 6.65% has been acting as a crucial support since last few weeks and it expected to remain the same. If it breaches, this level, it likely to find support at 6.60%, which acted as resistance in the earlier range bound motion. On the upside, if it breaches 6.75% level,it may find resistance at 6.88% levels.
MARAL — Long & Short Permission | Liquidity Print + Entry WindowMARAL — Long & Short Permission | Liquidity Print + Entry Window
A Structured Execution Framework for Liquidity-Driven Markets
This is a new Trading View tool built under the MARAL Execution Workflow system:
MARAL — Long & Short Permission.
In modern markets—especially high-liquidity pairs—price does not move randomly.
It typically moves from liquidity to liquidity.
Breakouts fail.
Highs get swept.
Lows get reclaimed.
Chop destroys R:R.
The problem is rarely the market.
The problem is unstructured execution—late entries, impulse trades, and decision-making without a consistent workflow.
That is why MARAL — Long & Short Permission was built:
to help traders standardize execution using a rule-based, permission-driven process.
Not a Signal Tool.
Not an Auto-Trading Bot.
Not Financial Advice.
MARAL is designed to support disciplined decision-making by aligning context, confirmation, timing, and risk structure—so execution becomes repeatable, auditable, and less emotional.
MARAL is a permission-based execution framework designed to standardize decision-making using a rule-governed workflow.
It does not predict price.
It controls participation.
The Core Philosophy
Most traders ask:
“Where should I enter?”
MARAL asks:
“Is participation even permitted?”
That shift alone changes behavior.
Instead of chasing candles, the trader waits for:
HTF Context → H1 Liquidity Print → M15 Timed Trigger → Structured Risk Planning
Only then does permission open.
The Architecture of MARAL
The system is built around a structured multi-timeframe logic engine.
A) HTF Context (Higher Timeframe Authority)
Default: H4
Determines:
• Bias (LONG / SHORT / NEUTRAL)
• Regime (TREND / RANGE)
• Premium / Discount location
• PDH / PDL reference levels
This prevents trading against structural flow.
No HTF alignment → No permission.
B) H1 Liquidity Print (Trigger Layer)
Crypto and high-liquidity markets respect liquidity pools.
MARAL monitors:
• Previous Day High (PDH)
• Previous Day Low (PDL)
A valid “print” requires:
• Sweep beyond liquidity
• Reclaim or rejection
• Close confirmation
This filters:
• False breakouts
• Emotional expansion entries
• Late momentum chasing
No confirmed print → No permission.
C) Noise Control Engine (Chop Filter)
Most losses occur in chop.
MARAL uses:
• ADX
• Efficiency Ratio
Classifies environment:
LOW / MED / HIGH Chop
Policy options:
• Auto
• Block
• Warn
• Ignore
When set to Block, high chop conditions disable entries.
This protects R:R before execution even begins.
D) M15 Timed Execution Window
After H1 confirmation, MARAL opens a controlled execution window (limited number of bars).
Only during this window can valid triggers occur:
• Sweep + Reclaim
• CHoCH + Retest
• Structured Pullback
If the window expires:
Permission closes.
No chasing.
No emotional entries.
E) Structured SL / TP Planning
Before entry, MARAL builds structured preview levels:
• SL1 based on swing + ATR buffer
• TP1 / TP2 using R-multiple logic
• Optional liquidity magnet alignment
Optional LIVE latch mode:
Locks entry + SL/TP during active trade.
This enforces execution discipline.
note : Note (Permission + Planning, Not Signals):
SL1 (Stop Level 1): A risk boundary derived from structure + buffer logic. If reached, the trade idea is treated as invalid within this workflow.
TP1 (Target Level 1): A first planned management zone where partial profit-taking or risk reduction may be considered as part of a structured plan.
TP2 (Target Level 2): A second planned management zone for extended continuation, used only if market conditions remain aligned.
Example levels shown are for demonstration of the planning engine only and are not trade recommendations.
What You See on the Panel
The dashboard provides clear state outputs:
• WAIT
• PERMIT LONG
• PERMIT SHORT
• BLOCK
• IN-TRADE
With diagnostics:
• HTF alignment
• Liquidity status
• Chop classification
• Entry window state
• R:R validation
• Active level mode
This makes the decision process visible and auditable.
Why It Works Well in Liquidity pair
• Liquidity-driven
• Highly reactive to PDH / PDL
• Expansion-prone after compression (GOLD/USD,CRYPTO Pairs)
Most traders lose in:
• Breakout traps
• High chop
• Late entries
• Emotional reversals
MARAL enforces:
Liquidity → Confirmation → Timed Execution → Structured Risk
That alignment suits high-liquidity crypto pairs particularly well.
Who This Tool Is For
• Traders who overtrade
• Traders who chase breakouts
• Traders seeking execution structure
• Futures traders
• High-liquidity crypto participants
• Traders building discipline
This tool is not designed for:
• Random scalping
• Blind indicator stacking
• Automated signal copying
The MARAL Mindset
Signals attempt to predict.
Permission systems control participation.
Prediction is uncertain.
Participation can be structured.
MARAL’s objective is simple:
Make execution rule-based.
Reduce emotional drift.
Standardize entry timing.
Structure risk before commitment.
Live Chart Breakdown (STABLEUSDT Perpetual | 1H |)
The attached chart demonstrates how MARAL — Long & Short Permission structures execution using liquidity logic and multi-timeframe control.
This is not hindsight labeling.
This is state-based permission architecture.
Let’s break down exactly what the panel is showing.
1️⃣ Market Context (HTF Layer)
On the right dashboard under A) CONTEXT (HTF):
• Bias / Regime: LONG | RANGE
• Location: DISCOUNT (MID)
• PDH / PDL: 0.030675 / 0.028045
What this means:
The higher timeframe structure is aligned long, but the regime is classified as RANGE — not trending expansion.
This immediately changes behavior.
In RANGE regime:
Aggressive breakout entries are avoided.
Liquidity sweep logic becomes more important.
Mean reversion behavior is more likely.
Price is currently positioned in the discount half of the range.
That creates structural long potential — but not automatic permission.
2️⃣ H1 Liquidity Trigger (Print Logic)
Under B) TRIGGER (H1):
• Print / Status: WAIT
• BSL / SSL Sweeps: 0 / 0
• Response / Magnet: —
This means:
There is currently no confirmed H1 liquidity print.
Even though HTF bias is LONG, MARAL refuses to open permission because:
No sweep + reclaim confirmation occurred at PDH or PDL.
This prevents:
• Blind continuation entries
• Range breakout traps
• Emotional buying during expansion
No Print → No Permission.
3️⃣ Noise Control (Chop Filter)
Under C) NOISE CONTROL:
• Chop: MED | Block
• ADX (H1): 23.50
• ER: 0.33
This indicates moderate chop conditions.
Since the policy is set to Block, permission is actively disabled during unstable structure.
Even if a trigger appears,
Block overrides execution.
This layer protects R:R.
Most retail traders ignore this environment filter.
MARAL does not.
4️⃣ Permission Status
Under D) PERMISSION:
• Long / Short: ❌ | ❌
• Block Reason: NO PRINT
Even though higher timeframe bias is long:
Permission is denied.
Because:
No H1 liquidity print
Chop filter active
Entry window inactive
This is execution discipline.
5️⃣ M15 Execution Layer
Under E) EXECUTION (M15):
• M15 Trigger: WAIT
• Entry Window: INACTIVE
This confirms:
Even if price moves quickly,
MARAL does not chase.
Only after a confirmed H1 print does a timed M15 execution window open.
That window is limited.
Once expired → permission closes.
6️⃣ Level Structure (Risk Planning)
Under F) LEVELS:
• Levels Mode: LIVE 🔒
• SL1: 0.027788
• TP1: 0.029136
• TP2: 0.031662
These levels are calculated using:
• Structure-based swing logic
• ATR buffer
• R-multiple alignment
• Liquidity magnet targeting
When LIVE latch is active,
Entry + SL + TP are locked.
This prevents emotional stop shifting.
7️⃣ What Happened on This Chart
You can see the label:
“PERMIT LONG ENTRY”
This occurred after:
• Liquidity interaction
• Structural reclaim
• Timed execution trigger
Not before.
The entry was structured.
Not emotional.
After entry:
State shifted to:
IN TRADE
And levels were activated.
Why This Matters in High liquidity pair
Its moves aggressively after liquidity sweeps.
Most traders:
• Enter during expansion
• Get trapped in range
• Ignore chop
• Move stops emotionally
MARAL enforces:
HTF Alignment
→ Liquidity Confirmation
→ Chop Filter
→ Timed Execution
→ Structured Risk
No shortcut.
The Core Difference
Signals predict.
MARAL controls participation.
This chart shows something important:
Even when bias is LONG,
MARAL still blocks entries until conditions align.
That is execution governance.
Important Note
This tool does not guarantee outcomes.
It does not provide financial advice.
It structures decision flow.
Note (Permission + Planning, Not Signals):
SL1 (Stop Level 1): A risk boundary derived from structure + buffer logic. If reached, the trade idea is treated as invalid within this workflow.
TP1 (Target Level 1): A first planned management zone where partial profit-taking or risk reduction may be considered as part of a structured plan.
TP2 (Target Level 2): A second planned management zone for extended continuation, used only if market conditions remain aligned.
Example levels shown are for demonstration of the planning engine only and are not trade recommendations.
All trading involves risk.
The purpose of MARAL is to reduce impulsive participation and standardize execution logic.
Final Thought
On this STABLEUSDT example,
the tool did not rush.
It waited for structure.
It blocked during chop.
It opened permission only when liquidity and timing aligned.
That is the difference between reacting to candles and executing with a framework.
Important Disclaimer
MARAL — Long & Short Permission is an analytical and execution-structuring tool.
It does not provide financial advice.
It does not guarantee outcomes.
It does not automate trading.
All trading involves risk.
The purpose of MARAL is to improve decision discipline — not to promise profit.
This article is for education purpose and not trade call or any profit promise
Final Thought
Markets reward consistency.
Consistency requires structure.
Structure requires permission.
Permission requires rules.
MARAL enforces those rules visually and systematically.
If you are serious about execution discipline in liquidity-driven markets, structured participation matters more than prediction.
Short Trade – HPCL
• Instrument: Hindustan Petroleum Corporation Limited (NSE)
• Timeframe: 125-minute
Technical Setup
• Confluence Zone:aligned with the 21-period DEMA.
Higher time frame suggest bearish continuation
• Price Action: The stock has rejected the confluence zone, showing weakness below resistance.
Trade Plan
• Bias: Short (bearish)
• Entry Zone: Near 447–449 resistance confluence
• Target: Retest of recent lows around 431 and potentially lower if momentum continues
• Stop-Loss: 25%DATR above the zone.
HEAD and SHOULDERS pattern in NIFTY!!? AS analysed NIFTY fell unidirectionally from our resistance excatly as analysed and managed to close itself around the demand zone hence we may see NIFTY trying to reverse but the broekn demand zone could act as RESISTANCE now so unless it manages to close itself above the demand zone, we might get bearish again leading to continued downfall so plan your trades accordingly and keep watching everyone.
Vodafone Idea VCP bullishVodafone Idea is in Uptrend structure with HH and HL formation.
Chart is making VCP on Monthly TF, price is making a retest as marked via red rectangle (waiting for close of this month, for volume analysis).
Post successful retest, price can reach a new high.
SL can be below the marked rectangle post completion of retest and take profit at next resistance area (marked as horizontal line).
Only for educational purpose, not a trade recommendation.
EUR/USD – Tactical Short
1H Supply Repricing Within Established Bearish Order Flow
Execution Timeframe: 5M | Risk Model: Intraday Tactical Allocation
I. Market Context & Structural Bias
EUR/USD remains in a clearly defined 1H bearish auction structure, characterized by sequential lower highs and lower lows. The latest expansion leg has printed a fresh 1H lower low, confirming downside initiative and continuation order flow.
The current upward move is a corrective repricing phase into previously identified 1H supply. The retracement lacks impulsive breadth and displays overlapping structure — consistent with liquidity rebalance rather than structural reversal.
From a flow perspective, the market is repricing to facilitate further distribution.
Directional Bias: Bearish while below the most recent 1H lower high.
No structural evidence currently supports higher-timeframe reversal.
II. Trade Thesis
This is a continuation trade within an established bearish regime.
The working assumption:
• The recent 1H impulse created inefficiency.
• The current retracement is seeking resting liquidity within supply.
• Upon liquidity completion, initiative sellers are expected to reassert control.
• External sell-side liquidity below the 1H lower low remains magnetized.
We are positioning for continuation, not calling a top.
III. Execution Framework (Confirmation-Based Participation)
Capital deployment is conditional, not anticipatory.
We require the following on 5M:
• Internal liquidity sweep into 1H supply
• Inability to sustain trade higher (auction inefficiency)
• Clear 5M bearish MSS
• Displacement candle confirming initiative sell-side participation
Without displacement, there is no confirmation of active distribution.
This converts location into validated structural opportunity.
IV. Trade Construction
Entry:
• Short exposure initiated only upon confirmed 5M bearish MSS post-liquidity sweep.
Risk Definition:
• Hard stop above the 5M structural high that defines the MSS.
• Invalidation must remain structural and binary.
Primary Objective:
• Prior 1H lower low (external liquidity pool).
Extended Objective:
• Continuation through the 1H low toward resting liquidity aligned with 4H value reference (POC region).
Asymmetry Requirement:
• Minimum 3:1 R multiple to justify capital allocation.
If projected R:R compresses below threshold, the trade is declined.
V. Risk Allocation & Portfolio Considerations
• Position sizing: 25–50 bps of total book (scaled based on realized volatility).
• Correlation check against USD index and risk sentiment proxies before entry.
• No pyramiding unless downside momentum confirms expansion.
• Partial de-risking may occur near 2R if tape transitions to balance.
Execution discipline supersedes conviction.
VI. Failure Conditions
The thesis is invalidated under any of the following:
• Sustained acceptance above 1H supply.
• Bullish 5M MSS within the zone.
• Strong impulsive continuation through supply indicating active higher-timeframe accumulation.
If supply fails, short exposure is mechanically unjustified.
VII. Professional Assessment of Edge
This setup offers structural alignment across timeframes:
• Higher-timeframe directional control
• Premium location entry
• Defined structural invalidation
• Clear external liquidity objective
• Favorable asymmetry profile
Edge is derived from alignment, confirmation, and disciplined risk deployment — not narrative bias.
Executive Summary
We are tactically positioning for continuation within an established 1H bearish order-flow regime. Participation is conditional upon 5M structural failure and downside displacement confirming active distribution.
Risk is tightly defined.
Reward is external liquidity below the 1H low.
Execution is rules-based, not discretionary.
This is a flow-aligned continuation framework appropriate for controlled intraday capital deployment.
NIFTY might show rejection from here!As we can see NIFTY did show some strong recovery exactly from our demand zone which was well analysed in our previous post. Now after unidirectional rally and gap filling we my see NIFTY getting rejected as GAPS acts as a great resistance hence we may expect a temporary retracement until it continues its upside journey so plan your trades accordingly and keep watching everyone.
Long Trade Setup: Bajaj Finance• Zone Highlighted: marked as a demand zone with POC.
Trade Thesis
• The highlighted zone acts as a support area, aligned with both the 21-day and 50-SMAs on the weekly chart.
• Price has bounced above this zone, suggesting buyers are defending it.
• The upward arrow indicates potential continuation of the bullish trend.
• Risk–Reward Ratio: 1:3 (favorable).