Long
Long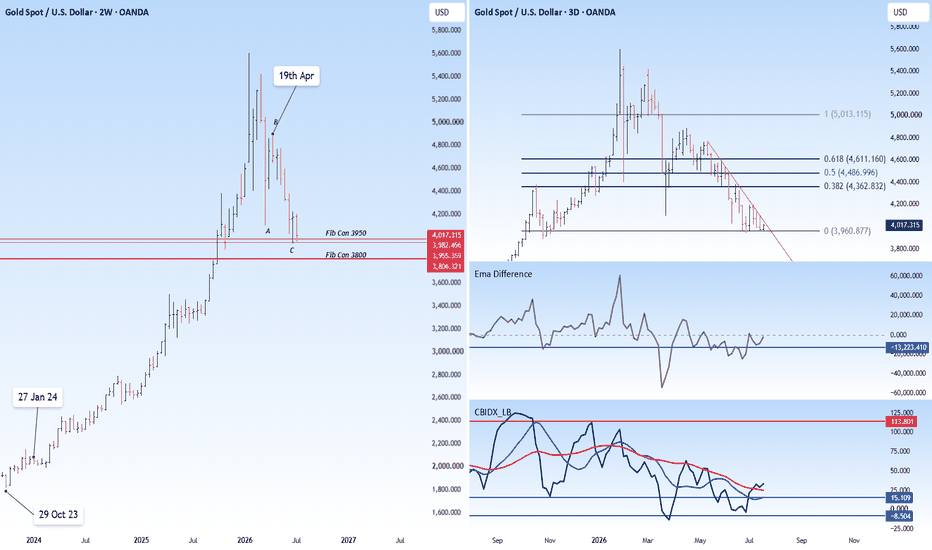
 Long
Long
 Long
Long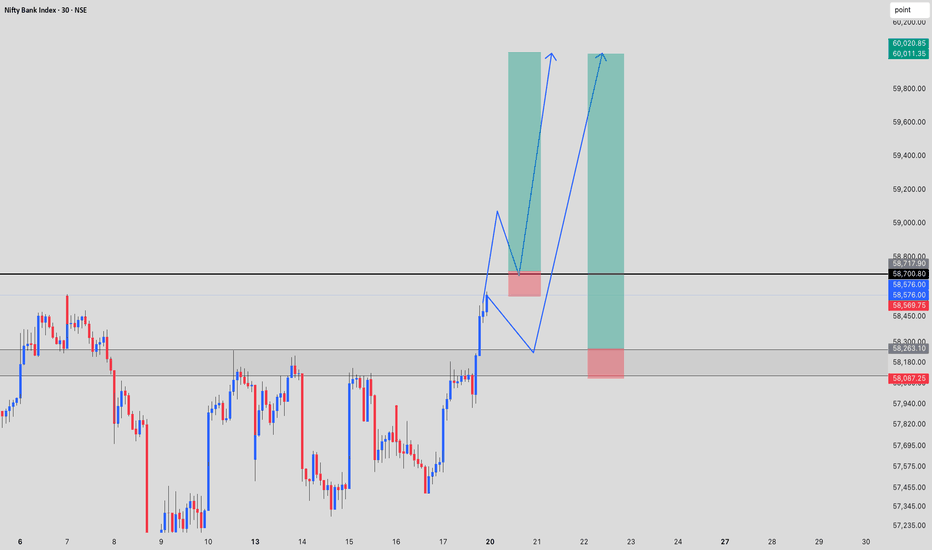
Eternal/Zomato can be exceptional stock for next 5 years Based on my Elliott Wave analysis, Eternal (formerly Zomato) appears to have completed a larger Wave 2 correction and may now be forming multiple nested 1–2 wave structures. If this interpretation is correct, the stock could be preparing for a strong Wave 3 advance, which is typically the most powerful phase in an Elliott Wave cycle.
From a business perspective, the investment thesis also looks compelling. Eternal provides exposure to multiple long-term growth segments through its food delivery business and Blinkit, giving investors participation in both online food delivery and the rapidly expanding quick-commerce market.
If execution remains strong, profitability continues to improve, and the Wave 3 scenario plays out as expected, the stock has the potential to become a multibagger over the long term. That said, Elliott Wave analysis is a probabilistic framework rather than a certainty, so risk management and monitoring business fundamentals remain important.  Long
Long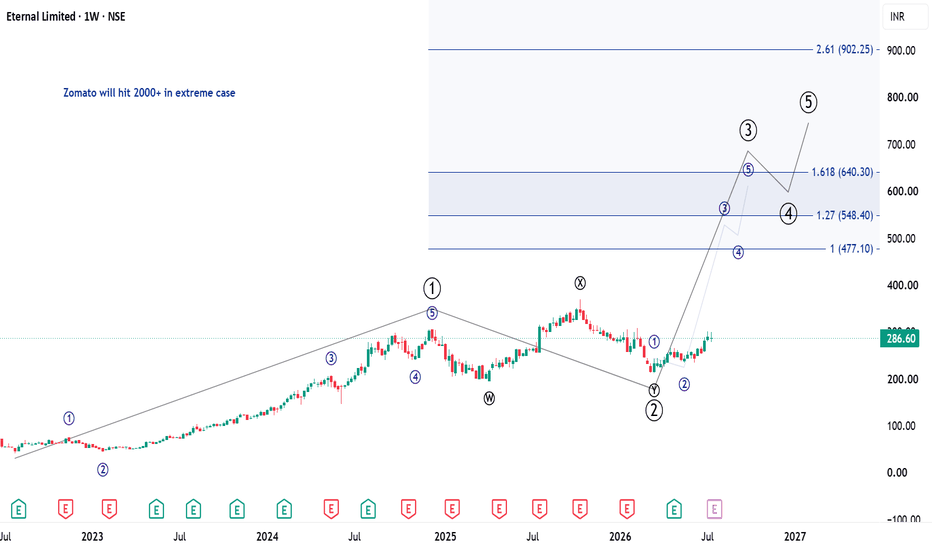
 Long
Long
 Short
Short
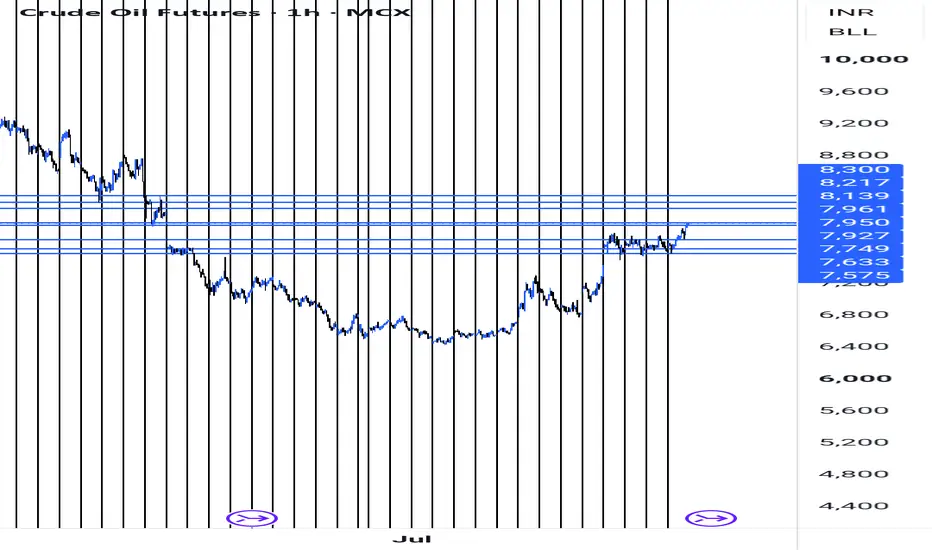
MCX Crude Oil Analysis (20-07-2026)Crude Oil Outlook for Monday
If Crude Oil opens above 7920 on Monday, it can be considered bullish. The first major psychological resistance is 8000, which is very close and could be tested first.
Upside Targets:
- 8000 – First psychological resistance
- 8150 – Second target
- 8220 – Third target
- 8350 – Fourth target (Possible Top)
The 8350 zone could act as a possible top, and it may be difficult for the price to sustain above this level.
On the other hand, if Crude Oil opens below 7920 with a gap down, it may turn bearish. The 7700–7720 zone is a super strong support. If the price breaks below this support, bearish momentum is likely to increase.
Downside Targets:
- 7600
- 7550
- 7480
However, if Crude Oil opens with a small gap down, starts declining, and then finds support in the 7700–7720 zone, it could bounce back from there.
In that case, the upside recovery targets will be:
- 7800
- 7920
A successful breakout above 7920 could then lead to the higher upside targets mentioned earlier:
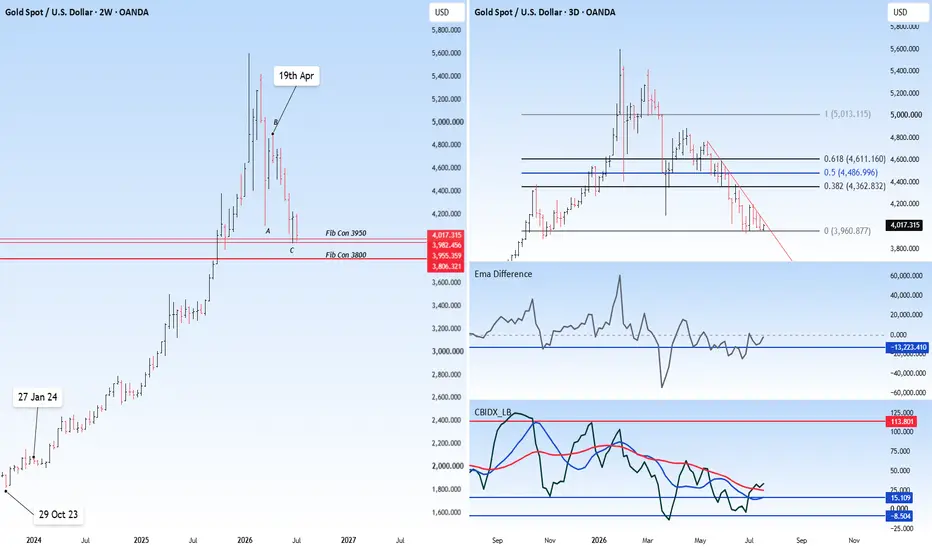
8000 → 8150 → 8220 → 8350. Gold Weekly Analysis [20 - 24 July, 2026]Probable Scenario Analysis and Trade Plan for Gold TVC:GOLD for the Week - 20 - 24 July, 2026.
🟢 Bullish Scenario
The price is not yet in the bullish zone. If the price sustains above 4050 and shows the promise of bullish continuation, then the first probable bullish targets would be 4100. Next, if the price sustains above 4100, then the probable bullish targets would be 4150 and 4200. There will be strong resistance at 4200. Next, if the price again sustains above 4200, then the probable bullish targets would be - 4250 and 4300. Lastly, keep the level 4100. If price remains above 4100, then look for only bullish trades in the week.
🔴 Bearish Scenario
The zone of (4000 - 3950) is a strong support zone. If the price breaks down below 3950, then the probable bearish targets would be - 3900, 3850, and 3800.
🟡 No Trading Zone (NTZ): (4050 - 3950)
⏺ Range of Consolidation (ROC): (4200 - 4000).
Here, 4100 is the median of the ROC. The median works like an intraday sentiment evaluator. The price trading above the median would offer bullish sentiment, while the price trading below the median would trigger bearish sentiment within the ROC.
● Event
No high-impact event this week. One medium-impact event is the Euro Interest Rate Decision on 23rd July (Thursday). No holidays this week. Lastly, geopolitical issues are omnipresent.
● Intraday Bias
Establish intraday bias with respect to the opening price. If the price sustains above the opening price, then don't think of shorting. Look for bullish trades only. On the contrary, if the price sustains below the opening price, then don't think of going long. Look for bearish trades in that case.
● Disclaimer + End Note
- All the analyses would fail in the case of a major gap up, gap down, or price structure anomaly. Thus, practice PRAGMATISM in the live session.
- Trade only if there is a set-up. Remember, not trading is an extension of the trading activity.
- Mark your points. Trade your points. Price is GOD. Anything can happen in the markets. Thus, trade what you see, not what you believe.
- Always PRACTICE RISK MANAGEMENT. Always PROTECT YOUR CAPITAL. Be RESPONSIBLE.
- Be Strategic. Be Courageous. Be Patient. Be Wise.
- Every day is a new day. Thus, do not carry the baggage of past successes or failures. Leave the gardens of winning and losing. Establish yourself in equanimity. Always think from a new perspective.
- Let the joy of trading drive your effectiveness, not greed or fear. Believe in Possibilities.
Happy Trading!  Long
Long
Nifty 50 Weekly Analysis [20 - 24 July, 2026]Probable Scenario Analysis and Trade Plan for the Nifty 50 Index NSE:NIFTY for the Week of 20 - 24 July, 2026.
🟢 Bullish Scenario
Nifty 50 is in a strong bullish zone. Every down move should be doubted and considered as an opportunity to go long. If the Nifty 50 Index stays above 24200, then stay bullish. The probable bullish targets above 24200 would be - 24300, 24400, and 24500. There will be strong resistance at 24500. Next, if the price sustains above 24500, then the probable bullish targets would be - 24600 and 24700. The zone of (24750 - 24700) would be a strong resistance zone.
🔴 Bearish Scenario
Presently, the price is out of the bearish zone. There is no observable bearish setup in the charts. However, level 24100 is a crucial support. If the price breaks down below 24100, then there will be a weak bearish move till 24000. Level 24000 is weak support. Next, if the price decisively breaks down below 24000, then the probable bearish targets would be - 23900 and 23800. The price will receive strong support in the zone of (23850 - 23800).
🟡 No Trading Zone (NTZ): (24200 - 24100).
⏺ Range of Consolidation (ROC): (24500 - 24200).
Here, 24350 is the median of the ROC. The median works like an intraday sentiment evaluator. The price trading above the median would offer bullish sentiment, while the price trading below the median would trigger bearish sentiment within the ROC.
● Event
No high-impact event this week. One medium-impact event is the Euro Interest Rate Decision on 23rd July (Thursday). No holidays this week. Lastly, geopolitical issues are omnipresent.
● Intraday Bias
Establish intraday bias with respect to the opening price. If the price sustains above the opening price, then don't think of shorting. Look for bullish trades only. On the contrary, if the price sustains below the opening price, then don't think of going long. Look for bearish trades in that case.
● Top - Down Analysis
- Monthly TF: A green candle closed far above the close of the previous month. The month is bullish. Strong support at 24200. Immediate resistance is at 24500. The view is bullish.
- Weekly TF: A bullish candle formed within the red long-legged doji of the previous week. It looks like a "Bullish Harami" pattern. The zone of (24250 - 24200) would act as a strong support area. Immediate resistance is 24500. The view is indecision to bullish.
- Daily TF: A strong bullish candle showing signs of strong momentum. Level 24200 is strong support. It seems that level 24500 is possible. Doubt every down move. The view is bullish.
- 30-minute TF: The higher-highs and lower-lows structure is intact. The zone (24250 - 24200) is strong support. The view is bullish.
● Disclaimer + End Note
- All the analyses would fail in the case of a major gap up, gap down, or price structure anomaly. Thus, practice PRAGMATISM in the live session.
- Trade only if there is a set-up. Remember, not trading is an extension of the trading activity.
- Mark your points. Trade your points. Price is GOD. Anything can happen in the markets. Thus, trade what you see, not what you believe.
- Always PRACTICE RISK MANAGEMENT. Always PROTECT YOUR CAPITAL. Be RESPONSIBLE.
- Be Strategic. Be Courageous. Be Patient. Be Wise.
- Every day is a new day. Thus, do not carry the baggage of past successes or failures. Leave the gardens of winning and losing. Establish yourself in equanimity. Always think from a new perspective.
- Let the joy of trading drive your effectiveness, not greed or fear. Believe in Possibilities.
Happy Trading!  Education

Trading Masterclass #1Institutional trading means trading like hedge funds, banks, prop firms, and professional desks. They do not trade based on emotions, random tips, or gambling. They use systems, probabilities, risk control, position sizing, discipline, and psychology.
Retail traders often lose because they focus only on “entry.” Institutions focus on:
Risk Management
Capital Protection
Position Sizing
Probability
Psychology
 Education

Technical AnalysisCore of Technical Analysis
Technical Analysis is the study of past price movements, volume, and market trends to predict future price direction.
3 Main Principles:
Market Discounts Everything
All news, emotions, and fundamentals are already reflected in price.
Prices Move in Trends
Markets usually move in uptrend, downtrend, or sideways trends.
History Repeats Itself
Human psychology creates repeating chart patterns.
Key Tools:
Charts (Candlestick, Line, Bar)
Support & Resistance
Trendlines
Indicators (RSI, MACD, Moving Averages)
Volume Analysis  Education

Short 
 Education

How Monthly Structure Shapes Weekly Behavior🟢 This post is educational and observational in nature based on historical price action across multiple timeframes. It is not a forecast or a trading recommendation.
📈 Higher Timeframe
A higher timeframe refers to a chart view that compresses more time into each candle, such as monthly or weekly charts compared to daily or hourly ones. Higher timeframes tend to filter out short term noise and reveal the broader structural context a stock is trading within.
📏 Monthly Trendline
Marked in green, this trendline is drawn purely on the monthly timeframe. A trendline connects a series of highs or lows to reflect the underlying direction of price over a longer horizon, and because it originates from the monthly chart, it carries more structural weight than a trendline drawn on a lower timeframe.
📉 Bringing the Monthly Into the Weekly
On the right side of this post, the same monthly trendline has been carried over and overlaid onto the weekly timeframe. This is a deliberate multi timeframe approach, since a line drawn on a higher timeframe often continues to act as a relevant reference point even when viewed on a lower one.
🔄 The Flip Zone on the Weekly
Once overlaid, this level shows a clear flip zone on the weekly chart. What was previously acting as resistance on the weekly timeframe has, after being broken, converted into support
↩️ The Counter Trendline
Marked in white is a counter trendline, drawn against the direction of the primary trend. It is used to track corrective or pullback phases  Long
Long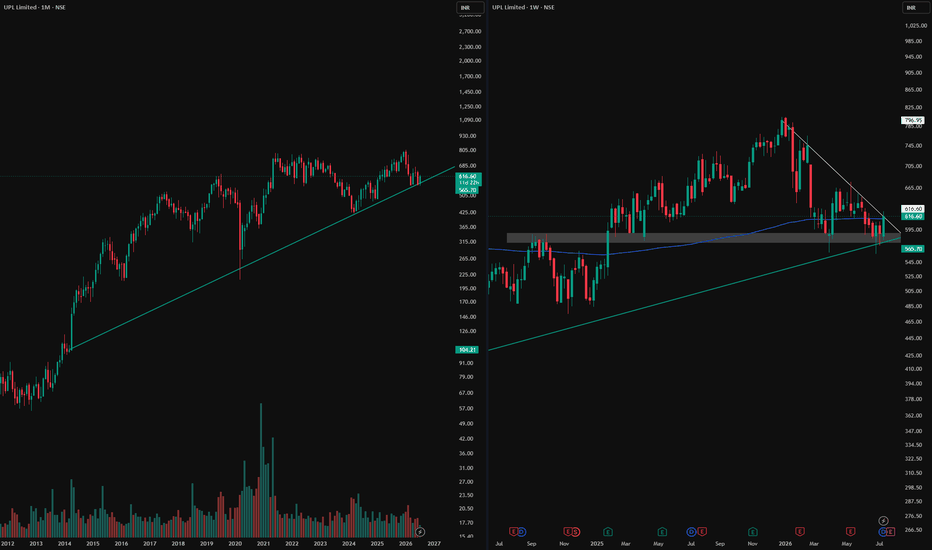
 Education

 Education

Nifty Bank Weekly Analysis [20 - 24 July, 2026]Probable Scenario Analysis and Trade Plan for the Nifty Bank Index NSE:BANKNIFTY for the Week of 20 - 24 July, 2026.
🟢 Bullish Scenario
Nifty Bank is in a strong bullish zone. Every down move should be doubted and considered as an opportunity to go long. If the Nifty Bank Index stays above 58250, then stay bullish. The probable bullish targets above 58250 would be - 58500, 58750, and 59000. There will be strong resistance at 59000. Next, if the price sustains above 59000, then the probable bullish targets would be 59250, 59500, 59750, and 60000.
🔴 Bearish Scenario
Presently, the price is out of the bearish zone. There is no observable bearish setup in the charts. However, level 57750 is a crucial support. If the price breaks down below 57750, then there will be a weak bearish move till 57500. Level 57500 is a weak support. Next, if the price decisively breaks down below 57500, then the probable bearish targets would be - 57250 and 57000. The price will receive strong support at 57000.
🟡 No Trading Zone (NTZ): (58250 - 57750).
⏺ Range of Consolidation (ROC): (59000 - 57000).
Here, 58000 is the median of the ROC. The median works like an intraday sentiment evaluator. The price trading above the median would offer bullish sentiment, while the price trading below the median would trigger bearish sentiment within the ROC.
● Event
No high-impact event this week. One medium-impact event is the Euro Interest Rate Decision on 23rd July (Thursday). No holidays this week. Lastly, geopolitical issues are omnipresent.
● Intraday Bias
Establish intraday bias with respect to the opening price. If the price sustains above the opening price, then don't think of shorting. Look for bullish trades only. On the contrary, if the price sustains below the opening price, then don't think of going long. Look for bearish trades in that case.
● Top - Down Analysis
- Monthly TF: A green candle closed far above the close of the previous month. The month is bullish. Strong support at 58000. Immediate resistance is at 59000. The view is bullish.
- Weekly TF: A strong green candle engulfed dojis of the past 4 weeks. If the price sustains above 58500 for at least 1 day and shows further bullish opportunity, then levels 59000 and 59500 seem achievable. The view is bullish.
- Daily TF: A strong bullish candle showing signs of strong momentum. Level 58000 is strong support. There is an unfilled gap till 59000. It seems that level 59000 is possible. Doubt every down move. The view is bullish.
- 30-minute TF: The higher-highs and lower-lows structure is intact. The zone (58250 - 58000) is strong support. The view is bullish.
● Disclaimer + End Note
- All the analyses would fail in the case of a major gap up, gap down, or price structure anomaly. Thus, practice PRAGMATISM in the live session.
- Trade only if there is a set-up. Remember, not trading is an extension of the trading activity.
- Mark your points. Trade your points. Price is GOD. Anything can happen in the markets. Thus, trade what you see, not what you believe.
- Always PRACTICE RISK MANAGEMENT. Always PROTECT YOUR CAPITAL. Be RESPONSIBLE.
- Be Strategic. Be Courageous. Be Patient. Be Wise.
- Every day is a new day. Thus, do not carry the baggage of past successes or failures. Leave the gardens of winning and losing. Establish yourself in equanimity. Always think from a new perspective.
- Let the joy of trading drive your effectiveness, not greed or fear. Believe in Possibilities.
Happy Trading!