Long
Long
 Education
 Long
Long
 Long
Long
 Long
Long
 Long
Long
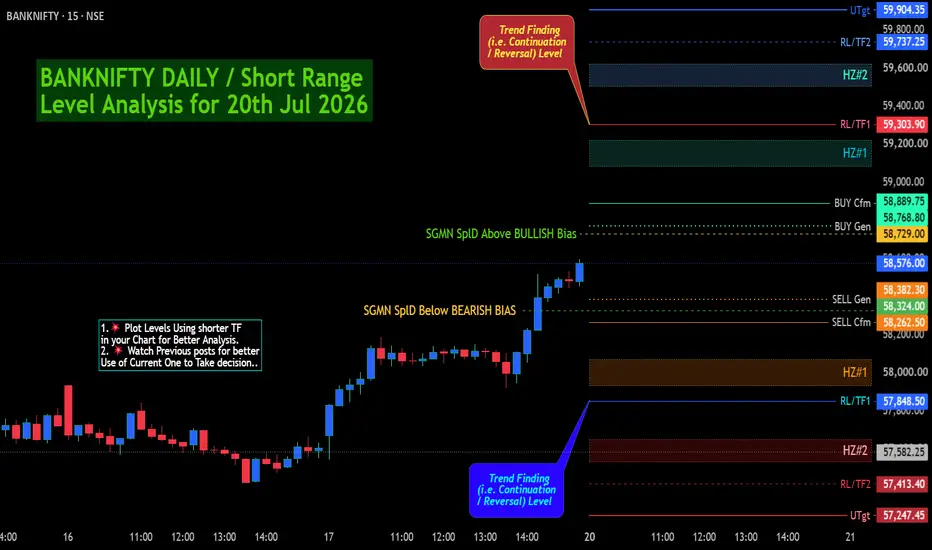
BANKNIFTY DAILY / Short Range Level Analysis for 20th Jul 2026BANKNIFTY DAILY / Short Range Level Analysis for 20th Jul 2026
🔕 SGMN SplD BULLISH Above => 58729.
🔕 SGMN SplD Bearish BELOW => 58324.
Mentioned analysis based on 2 consecutive candle close in 15 min Time Frame.
━━━━━🟥🟧🟨🟩🟦🟪⬛━━━━━
💥Level Interpretation / description:
✍🏻L#1: If the candle crossed & stays above the “Buy Gen”, it is treated / considered as Bullish bias. Cfm=> Confirmation.
L#2: Possibility / Probability of REVERSAL near 🔕RL/TF1 & 🔔RL/TF2
L#3: If the candle stays above “Sell Gen” but below “Buy Gen”, it is treated / considered as Sidewise. Aggressive Traders can take Long position near “Sell Gen” either retesting or crossed from Below & vice-versa i.e. can take Short position near “Buy Gen” either retesting or crossed downward from Above.
L#4: If the candle crossed & stays below the “Sell Gen”, it is treated / considered a Bearish bias.
L#5: Possibility / Probability of REVERSAL near 🔕RL/TF1 & 🔔RL/TF2
HZB (Buy side) & HZS (Sell side) => Hurdle Zone,
✍🏻 *** Specialty of “HZB#1, HZB#2 HZS#1 & HZS#2” is Sidewise (behaviour in Nature)
Rest Plotted and Mentioned on Chart
Color code Used:
Green, BLUE =. Positive bias.
Safron, RED =. Negative bias.
RED in Between Green means Trend Finder / Momentum Change
/ CYCLE Change and Vice Versa.
Notice One thing: HOW LEVELS are Working.
Use any Momentum Indicator / Oscillator or as you "USED to" to Take entry.
━━━━━🟥🟧🟨🟩🟦🟪⬛━━━━━
⚠️ DISCLAIMER:
The information, views, and ideas shared here are purely for educational and informational purposes only. They are not intended as investment advice or a recommendation to buy, sell, or hold any financial instruments. I am not a SEBI-registered financial adviser.
Trading and investing in the stock market involves risk, and you should do your own research and analysis. You are solely responsible for any decisions made based on this research.
"🔔As HARD EARNED MONEY IS YOUR's, So DECISION SHOULD HAVE TO BE YOUR's".
━━━━━🟥🟧🟨🟩🟦🟪⬛━━━━━
❇️ Follow notification about periodical View
💥 Do Comment for Stock WEEKLY Level Analysis.🚀
📊 Do you agree with this view?
✈️ HIT THE PLANE ICON if this technical observation resonates with you. It will Motivate me.
━━━━━🟥🟧🟨🟩🟦🟪⬛━━━━━
💡 If You LOOKING any CHART & want for Level and ANALYZE?
Share your desired stock names in the comments below! I will try to analyze the chart Levels, patterns and share my technical view (so far my Knowledge).
If Viewers think It can identify meaningful setups. Looking forward to hearing from all of you — let's keep this discussion going and help each other make better trading decisions.
___________🔕^^^⚫⚪^🙏🏼🙏🏼🙏🏼^⚪⚫^^^🔔___________ XAUUSD — 3,960 Is the Liquidity Pool XAUUSD — 3,960 Is the Liquidity Pool
Gold is sitting in a very important part of the chart now, and this is the kind of area where the market usually tries to confuse both sides before the real move appears.
Price has been moving lower for several weeks, printing weaker structure after each recovery. Every time buyers tried to push back, gold failed to reclaim the higher liquidity zones around 4,180 - 4,200, then slowly drifted back toward the lower range. That tells me the bigger pressure is still heavy, but the current location is not a place where I want to chase the sell too late.
The main story here is the liquidity pool around 3,940 - 3,970. Price has already travelled deep into discount, and this lower zone is where sell-side liquidity has been building for a long time. For newer traders, think of it like a pool under the market: once price comes close, it often wants to dip into it, collect liquidity, and then breathe back upward before deciding the next bigger direction.
That is why my short-term view is leaning bullish from the liquidity pool, as long as gold holds above 3,940 - 3,960. If buyers can defend this zone, the next area price may try to revisit is the POI around 4,080 - 4,110. That is where I would expect the real test. If gold reaches that zone and reacts weakly, sellers may step back in again.
This recovery idea becomes weak if gold breaks below 3,940 and cannot recover. In that case, the liquidity pool fails, and the market may continue searching for deeper downside.
Key price zones to watch
Current reaction area: 3,960 - 4,020
Main demand / liquidity pool: 3,940 - 3,970
Bullish confirmation zone: clean hold above 4,020
Main upside POI target: 4,080 - 4,110
Next upside liquidity zone: 4,180 - 4,210
Buy-side liquidity: 4,320 - 4,360
Lower support if buyers fail: 3,940
Invalidation: clean close below 3,940
Do you see this 3,960 area as the place where gold starts a recovery, or do you think the market still needs one deeper sweep first?
 Short
Short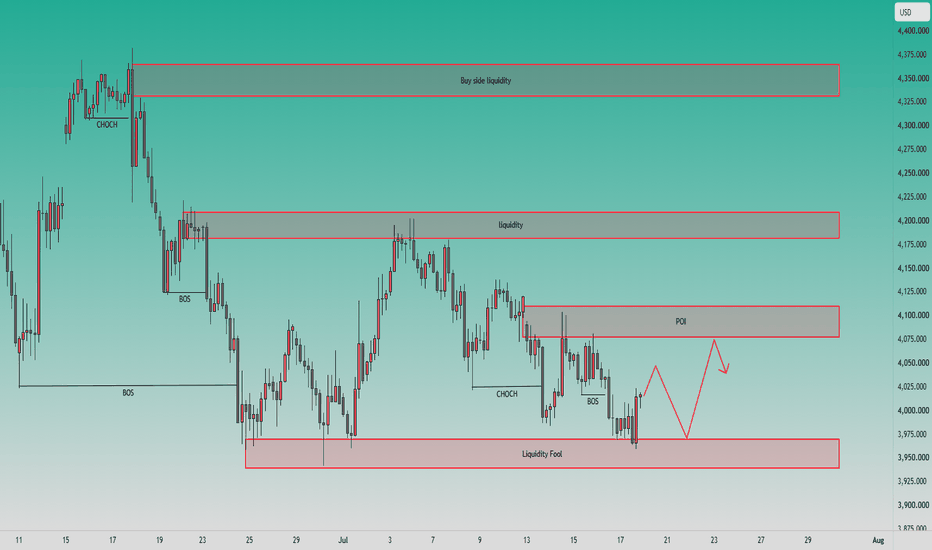
BANKNIFTY WEEKLY / POSITIONAL Level Analysis: 20th-24th Jul 2026🔔 SGMN SplWP BULLISH Above => 59257.
🔔 SGMN SplWP Bearish BELOW => 57686.
Mentioned analysis based on 2 consecutive candle close in 15 min Time Frame.
━━━━━🟥🟧🟨🟩🟦🟪⬛━━━━━
💥Level Interpretation / description:
✍🏻L#1: If the candle crossed & stays above the “Buy Gen”, it is treated / considered as Bullish bias. Cfm=> Confirmation.
L#2: Possibility / Probability of REVERSAL near 🔕RL/TF1 & 🔔RL/TF2
L#3: If the candle stays above “Sell Gen” but below “Buy Gen”, it is treated / considered as Sidewise. Aggressive Traders can take Long position near “Sell Gen” either retesting or crossed from Below & vice-versa i.e. can take Short position near “Buy Gen” either retesting or crossed downward from Above.
L#4: If the candle crossed & stays below the “Sell Gen”, it is treated / considered a Bearish bias.
L#5: Possibility / Probability of REVERSAL near 🔕RL/TF1 & 🔔RL/TF2
HZB (Buy side) & HZS (Sell side) => Hurdle Zone,
✍🏻 *** Specialty of “HZB#1, HZB#2 HZS#1 & HZS#2” is Sidewise (behaviour in Nature)
Rest Plotted and Mentioned on Chart
Color code Used:
Green, BLUE =. Positive bias.
Safron, RED =. Negative bias.
RED in Between Green means Trend Finder / Momentum Change
/ CYCLE Change and Vice Versa.
Notice One thing: HOW LEVELS are Working.
Use any Momentum Indicator / Oscillator or as you "USED to" to Take entry.
━━━━━🟥🟧🟨🟩🟦🟪⬛━━━━━
⚠️ DISCLAIMER:
The information, views, and ideas shared here are purely for educational and informational purposes only. They are not intended as investment advice or a recommendation to buy, sell, or hold any financial instruments. I am not a SEBI-registered financial adviser.
Trading and investing in the stock market involves risk, and you should do your own research and analysis. You are solely responsible for any decisions made based on this research.
"🔔As HARD EARNED MONEY IS YOUR's, So DECISION SHOULD HAVE TO BE YOUR's".
━━━━━🟥🟧🟨🟩🟦🟪⬛━━━━━
❇️ Follow notification about periodical View
💥 Do Comment for Stock WEEKLY Level Analysis.🚀
📊 Do you agree with this view?
✈️ HIT THE PLANE ICON if this technical observation resonates with you. It will Motivate me.
━━━━━🟥🟧🟨🟩🟦🟪⬛━━━━━
💡 If You LOOKING any CHART & want for Level and ANALYZE?
Share your desired stock names in the comments below! I will try to analyze the chart Levels, patterns and share my technical view (so far my Knowledge).
If Viewers think It can identify meaningful setups. Looking forward to hearing from all of you — let's keep this discussion going and help each other make better trading decisions.
___________🔕^^^⚫⚪^🙏🏼🙏🏼🙏🏼^⚪⚫^^^🔔___________ BTC/USD | 45-Minute Timeframe# 🟢 Overall Bias
**Neutral Bullish (Short-Term) | Mixed Multi-Timeframe**
The market has printed a **strong bullish reversal** after the sharp selloff around July 17. Buyers defended the lows aggressively, creating a **higher low** followed by an impulsive recovery.
However, price is now approaching an important resistance zone where sellers previously entered.
---
# 📈 Multi-Timeframe Signal
| Timeframe | Trend | Strength |
| --------- | ---------- | -------- |
| 5M | 🔴 Bearish | Weak |
| 15M | 🔴 Bearish | Weak |
| 45M | 🟢 Bullish | Moderate |
| 4H | 🔴 Bearish | Strong |
| Daily | 🟢 Bullish | Strong |
### Interpretation
* Lower timeframes are experiencing a pullback.
* 45-minute trend has turned bullish.
* 4H remains inside a corrective bearish phase.
* Daily trend is still positive.
**Overall:** Mixed market with bullish intraday potential.
---
# Market Structure
### Current Structure
✅ Higher Low formed
✅ Bullish impulse
✅ Consolidation under resistance
Price is currently **compressing**, which often precedes a breakout or rejection.
---
# 📊 Dynamic Trend Cloud
### Cloud Status
Current price is trading:
✅ Above the green cloud
Cloud is beginning to slope upward, suggesting:
* Buyers gaining control
* Trend improving
* Dynamic support building
This is constructive for bulls.
---
# 🔴 Resistance Levels
### Immediate Resistance
**64,150 – 64,250**
First breakout confirmation.
---
### Major Resistance
**64,500 – 64,800**
Previous rejection area.
Heavy selling expected here.
---
### Extreme Resistance
**65,200**
Previous swing high.
A break above would strengthen the bullish case.
---
# 🟢 Support Levels
### Immediate Support
63,760
(Current cloud support)
---
### Strong Support
63,500
Loss of this level weakens bullish momentum.
---
### Major Support
62,800
Recent demand zone where buyers stepped in.
---
# 📉 Volume Perspective
Although volume isn't visible, price action suggests:
* Strong buying after the selloff
* Sellers becoming less aggressive
* Healthy consolidation instead of panic selling
This favors continuation if buyers remain active.
---
# 📌 Price Action
Current candles show:
* Small-bodied candles
* Reduced volatility
* Sideways movement
This often indicates accumulation before the next move.
---
# 🚀 Bullish Scenario
A confirmed close above:
**64,200**
could trigger a move toward:
🎯 64,500
then
🎯 64,800
followed by
🎯 65,200
Probability: **65–70%** if support holds.
---
# 🔻 Bearish Scenario
If price loses:
**63,760**
expect:
63,500
↓
63,200
↓
62,800
A break below **62,800** would invalidate the short-term bullish recovery.
Probability: **30–35%**
---
# 📈 Trade Setup (Educational Example)
### 🟢 Long Setup
**Entry:** Above **64,200** (after breakout confirmation)
**Stop Loss:** Below **63,700**
**Target 1:** **64,500**
**Target 2:** **64,800**
**Target 3:** **65,200**
---
### 🔴 Short Setup
**Entry:** If price is rejected near **64,200–64,500** with bearish confirmation.
**Stop Loss:** Above the rejection high.
**Target 1:** **63,760**
**Target 2:** **63,500**
**Target 3:** **62,800**
---
# 🏷️ Professional Trading Tags
**#BTCUSD**
**#Bitcoin**
**#CryptoTrading**
**#TechnicalAnalysis**
**#PriceAction**
**#MarketStructure**
**#SupportAndResistance**
**#TrendFollowing**
**#SwingTrading**
**#DayTrading**
**#BreakoutTrading**
**#RiskManagement**
**#BullishSetup**
**#BearishSetup**
**#TradingView**
---
## ⭐ Final Verdict
**Bias:** 🟢 **Cautiously Bullish**
The chart shows a short-term bullish recovery with price holding above rising dynamic support. However, resistance around **64,200–64,500** is a critical decision zone. A confirmed breakout above this area would favor continuation toward **64,800–65,200**, while failure to hold **63,760** would increase the likelihood of a pullback toward **63,500** and **62,800**. Waiting for confirmation at these key levels offers a more favorable risk-to-reward profile than entering during the current consolidation.
 Long
Long
NIFTY DAILY / Short Range Level Analysis for 20th Jul 2026.🔕 SGMN SplD BULLISH Above => 24413
🔕 SGMN SplD Bearish BELOW => 24287.
Mentioned analysis based on 2 consecutive candle close in 15 min Time Frame.
━━━━━🟥🟧🟨🟩🟦🟪⬛━━━━━
💥Level Interpretation / description:
✍🏻L#1: If the candle crossed & stays above the “Buy Gen”, it is treated / considered as Bullish bias. Cfm=> Confirmation.
L#2: Possibility / Probability of REVERSAL near 🔕RL/TF1 & 🔔RL/TF2
L#3: If the candle stays above “Sell Gen” but below “Buy Gen”, it is treated / considered as Sidewise. Aggressive Traders can take Long position near “Sell Gen” either retesting or crossed from Below & vice-versa i.e. can take Short position near “Buy Gen” either retesting or crossed downward from Above.
L#4: If the candle crossed & stays below the “Sell Gen”, it is treated / considered a Bearish bias.
L#5: Possibility / Probability of REVERSAL near 🔕RL/TF1 & 🔔RL/TF2
HZB (Buy side) & HZS (Sell side) => Hurdle Zone,
✍🏻 *** Specialty of “HZB#1, HZB#2 HZS#1 & HZS#2” is Sidewise (behaviour in Nature)
Rest Plotted and Mentioned on Chart
Color code Used:
Green, BLUE =. Positive bias.
Safron, RED =. Negative bias.
RED in Between Green means Trend Finder / Momentum Change
/ CYCLE Change and Vice Versa.
Notice One thing: HOW LEVELS are Working.
Use any Momentum Indicator / Oscillator or as you "USED to" to Take entry.
━━━━━🟥🟧🟨🟩🟦🟪⬛━━━━━
⚠️ DISCLAIMER:
The information, views, and ideas shared here are purely for educational and informational purposes only. They are not intended as investment advice or a recommendation to buy, sell, or hold any financial instruments. I am not a SEBI-registered financial adviser.
Trading and investing in the stock market involves risk, and you should do your own research and analysis. You are solely responsible for any decisions made based on this research.
"🔔As HARD EARNED MONEY IS YOUR's, So DECISION SHOULD HAVE TO BE YOUR's".
━━━━━🟥🟧🟨🟩🟦🟪⬛━━━━━
❇️ Follow notification about periodical View
💥 Do Comment for Stock WEEKLY Level Analysis.🚀
📊 Do you agree with this view?
✈️ HIT THE PLANE ICON if this technical observation resonates with you. It will Motivate me.
━━━━━🟥🟧🟨🟩🟦🟪⬛━━━━━
💡 If You LOOKING any CHART & want for Level and ANALYZE?
Share your desired stock names in the comments below! I will try to analyze the chart Levels, patterns and share my technical view (so far my Knowledge).
If Viewers think It can identify meaningful setups. Looking forward to hearing from all of you — let's keep this discussion going and help each other make better trading decisions.
___________🔕^^^⚫⚪^🙏🏼🙏🏼🙏🏼^⚪⚫^^^🔔___________ NIFTY WEEKLY / POSITIONAL Level Analysis: 20th-24th Jul 2026.🔔 SGMN SplD BULLISH Above => 24570.
🔔 SGMN SplD Bearish BELOW => 24109.
Mentioned analysis based on 2 consecutive candle close in 15 min Time Frame.
━━━━━🟥🟧🟨🟩🟦🟪⬛━━━━━
💥Level Interpretation / description:
✍🏻L#1: If the candle crossed & stays above the “Buy Gen”, it is treated / considered as Bullish bias. Cfm=> Confirmation.
L#2: Possibility / Probability of REVERSAL near 🔕RL/TF1 & 🔔RL/TF2
L#3: If the candle stays above “Sell Gen” but below “Buy Gen”, it is treated / considered as Sidewise. Aggressive Traders can take Long position near “Sell Gen” either retesting or crossed from Below & vice-versa i.e. can take Short position near “Buy Gen” either retesting or crossed downward from Above.
L#4: If the candle crossed & stays below the “Sell Gen”, it is treated / considered a Bearish bias.
L#5: Possibility / Probability of REVERSAL near 🔕RL/TF1 & 🔔RL/TF2
HZB (Buy side) & HZS (Sell side) => Hurdle Zone,
✍🏻 *** Specialty of “HZB#1, HZB#2 HZS#1 & HZS#2” is Sidewise (behaviour in Nature)
Rest Plotted and Mentioned on Chart
Color code Used:
Green, BLUE =. Positive bias.
Safron, RED =. Negative bias.
RED in Between Green means Trend Finder / Momentum Change
/ CYCLE Change and Vice Versa.
Notice One thing: HOW LEVELS are Working.
Use any Momentum Indicator / Oscillator or as you "USED to" to Take entry.
━━━━━🟥🟧🟨🟩🟦🟪⬛━━━━━
⚠️ DISCLAIMER:
The information, views, and ideas shared here are purely for educational and informational purposes only. They are not intended as investment advice or a recommendation to buy, sell, or hold any financial instruments. I am not a SEBI-registered financial adviser.
Trading and investing in the stock market involves risk, and you should do your own research and analysis. You are solely responsible for any decisions made based on this research.
"🔔As HARD EARNED MONEY IS YOUR's, So DECISION SHOULD HAVE TO BE YOUR's".
━━━━━🟥🟧🟨🟩🟦🟪⬛━━━━━
❇️ Follow notification about periodical View
💥 Do Comment for Stock WEEKLY Level Analysis.🚀
📊 Do you agree with this view?
✈️ HIT THE PLANE ICON if this technical observation resonates with you. It will Motivate me.
━━━━━🟥🟧🟨🟩🟦🟪⬛━━━━━
💡 If You LOOKING any CHART & want for Level and ANALYZE?
Share your desired stock names in the comments below! I will try to analyze the chart Levels, patterns and share my technical view (so far my Knowledge).
If Viewers think It can identify meaningful setups. Looking forward to hearing from all of you — let's keep this discussion going and help each other make better trading decisions.
___________🔕^^^⚫⚪^🙏🏼🙏🏼🙏🏼^⚪⚫^^^🔔___________  Long
Long
 Long
Long
 Long
Long
 Long
Long
XAUUSD — Bearish Continuation Toward Fibonacci Target
Fundamental Analysis
Gold remains sensitive to USD momentum, Treasury yields, and upcoming U.S. macro data. For next week, the technical bias still leans bearish while price stays below the major descending structure.
Technical Analysis
On the 4H chart, XAUUSD is trading around 4,017 after losing momentum under the downtrend trendline. The nearest sell reaction zone is around 4,050 - 4,070, where price may retest the Fibonacci sell area before another downside move. If this zone rejects price, sellers may continue to push gold toward the lower Fibonacci psychological target around 3,755. A stronger recovery toward 4,203 or 4,300 - 4,384 would only be a deeper bearish retest unless price breaks the major downtrend.
Important Key Levels
Current price: 4,017
Nearest sell zone: 4,050 - 4,070
Strong resistance: 4,203
Fibonacci liquidity zone: 4,290 - 4,310
Major Fibonacci sell zone: 4,380 - 4,384
Main downside target: 3,755 - 3,740
Invalidation: above 4,203
Trading Scenario
Main Sell Setup
Entry: 4,050 - 4,070
Stop Loss: 4,203
Take Profit 1: 3,950
Take Profit 2: 3,850
Take Profit 3: 3,755 - 3,740
Sell Condition
Wait for gold to recover into the 4,050 - 4,070 Fibonacci sell zone and show bearish rejection. A failed reclaim, long upper wick, bearish engulfing candle, or close back below the zone would confirm seller pressure. If price breaks below the recent low, the bearish continuation setup becomes stronger. If gold breaks and holds above 4,203, this sell setup should be invalidated.
Overall View
The main view for next week remains bearish while XAUUSD trades below the downtrend structure. A short-term recovery can happen, but the preferred plan is to wait for price to retest the Fibonacci sell zone before looking for continuation toward the 3,755 - 3,740 target area.
Do you share the same bearish view on gold for next week, or are you waiting for a deeper retest near 4,203 first?
Short 
Gold under pressure: Is 38XX next?The new trading week begins with little change in the broader macro narrative. Last week's softer U.S. inflation data failed to trigger a sustained rally in Gold, reinforcing the view that institutional investors remain focused on the Federal Reserve's cautious stance rather than a single round of economic releases. Fed officials continue to emphasize that inflation has not yet been fully contained, keeping expectations for restrictive monetary policy largely intact. As long as U.S. yields remain relatively firm and the dollar avoids a deeper correction, Gold is likely to struggle in establishing a meaningful recovery.
With the major inflation reports now behind the market, attention shifts toward upcoming Fed communication and broader risk sentiment. The absence of a fresh bullish catalyst leaves Gold increasingly dependent on technical structure, where sellers continue to hold the upper hand.
From a technical perspective, Gold continues to respect its broader daily bearish trend, printing a sequence of lower highs and lower lows beneath the long-term descending trendline. Recent rebounds have repeatedly failed near the Demand + Fibonacci 0.50–0.618 resistance cluster, confirming that institutional sellers are still defending premium pricing. Although the 390x support zone has generated buying interest, price has yet to produce any meaningful Break of Structure (BOS) that would suggest a trend reversal.
As long as Gold remains below the descending trendline and key resistance, the current recovery should continue to be viewed as corrective. If selling pressure extends through the 390x support, the next major liquidity objective could emerge around the 38xx demand zone, where longer-term buyers may begin reassessing value.
PRIMARY SCENARIO
Gold could continue trading within the prevailing bearish structure. Failure to reclaim the Demand + Fibonacci 0.50–0.618 resistance may expose the 390x support to another test. A confirmed daily break below this area would likely extend the decline toward the 38xx liquidity zone.
ALTERNATIVE SCENARIO
If buyers reclaim the descending trendline and secure a confirmed daily close above the 0.618 Fibonacci resistance, bearish momentum could begin to fade. Such a move would be the first indication that the broader downtrend is losing strength and that a deeper corrective recovery may develop.
MARKET VIEW
Current Bias: Bearish
Preferred Strategy: Sell the Rally – Wait for Confirmation
Lucas Gray Trading Short 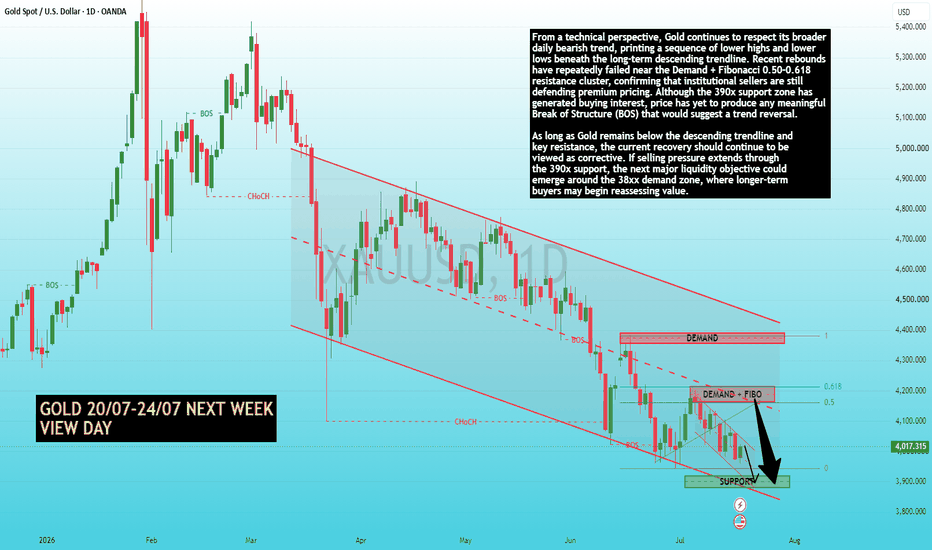
XAUUSD — OB Reaction, Trendline Break Can Confirm Recovery
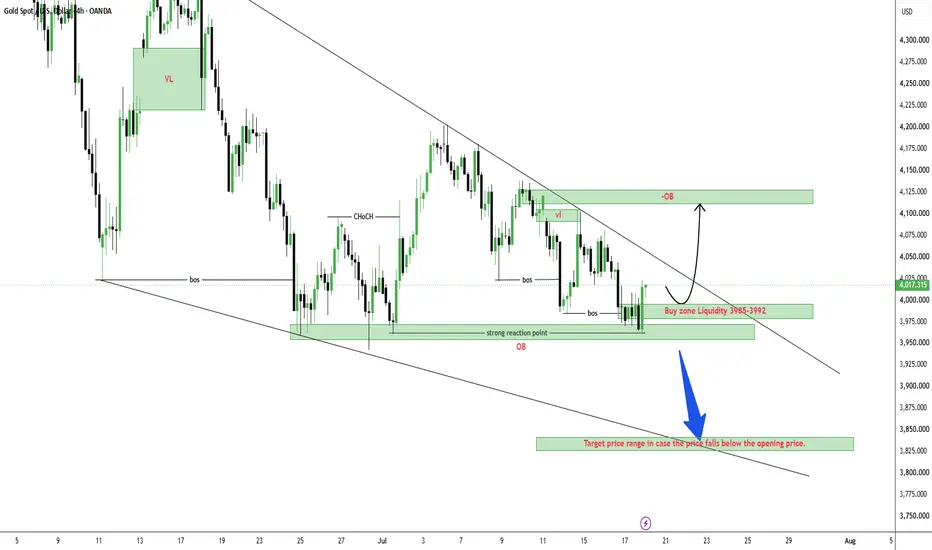
Gold is trading around $4,017 after reacting strongly from the lower OB and buy zone liquidity around $3,985–$3,992. This is an important area on the medium-term structure because price has already tested the lower reaction zone several times, and sellers failed to create a clean continuation below it.
From an SMC perspective, gold is still moving inside a broad corrective structure, but the reaction from the lower OB shows that buyers are starting to defend the discount area. The key point now is the descending trendline. If gold can stay above this trendline and build acceptance above the current range, the recovery structure can become stronger.
The current market is not a place to chase. The clean plan is to wait for price to respect the $3,985–$3,992 buy zone or confirm strength above the trendline. If buyers continue to defend this area, gold may recover toward the VL zone first, then the upper OB area around $4,100–$4,125.
Buy setup 1
Condition:
Gold holds the buy zone liquidity around $3,985–$3,992 and forms bullish rejection with lower timeframe MSS / CHOCH.
Entry: $3,985–$3,992
SL: below $3,950
TP1: $4,030
TP2: $4,060
TP3: $4,100–$4,125
TP4: $4,175
Buy setup 2
Condition:
If gold breaks above the descending trendline and retests it as support, bullish recovery becomes stronger.
Entry: above $4,030–$4,040 after breakout retest
SL: below $3,985
TP1: $4,060
TP2: $4,100–$4,125
TP3: $4,175
TP4: $4,220
Buy setup 3
Condition:
If gold sweeps below $3,985 but quickly reclaims the buy zone, this can create a stronger liquidity-trap buy setup.
Entry: after reclaim above $3,985–$3,992
SL: below the sweep low
TP1: $4,030
TP2: $4,060
TP3: $4,100–$4,125
Sell setup
Condition:
Selling is not the main priority while price is reacting from the lower OB. A sell setup is only valid if gold fails to hold above $3,985–$3,992 and breaks the lower structure clearly.
Entry: below $3,950 after breakdown retest
SL: above $3,985
TP1: $3,920
TP2: $3,880
TP3: $3,830–$3,850
Sell scalping setup
Condition:
If gold reaches the upper OB around $4,100–$4,125 and shows clear bearish rejection, a short-term sell scalp may appear.
Entry: $4,100–$4,125 after rejection
SL: above $4,150
TP1: $4,060
TP2: $4,030
TP3: $3,985–$3,992
Key levels
Current price area: $4,017
Buy zone liquidity: $3,985–$3,992
Strong reaction OB: $3,950–$3,970
Trendline confirmation area: $4,030–$4,040
Short-term resistance: $4,060
VL reaction zone: $4,090–$4,105
Upper OB target zone: $4,100–$4,125
Bullish continuation confirmation: clean hold above the descending trendline
Stronger bullish confirmation: clean break above $4,125
Bearish continuation confirmation: clean break below $3,950
Bearish target zone if structure fails: $3,830–$3,850
My current view is that gold is reacting from a medium-term OB support area, and the recovery can become stronger if price holds above the descending trendline. The Prime Gold plan is to avoid selling directly into the lower OB and wait for confirmation around $3,985–$3,992 or a clean breakout above the trendline. If buyers defend this structure, gold can continue toward $4,060, $4,100–$4,125 and potentially higher liquidity.
No confirmation, no trade.
Long 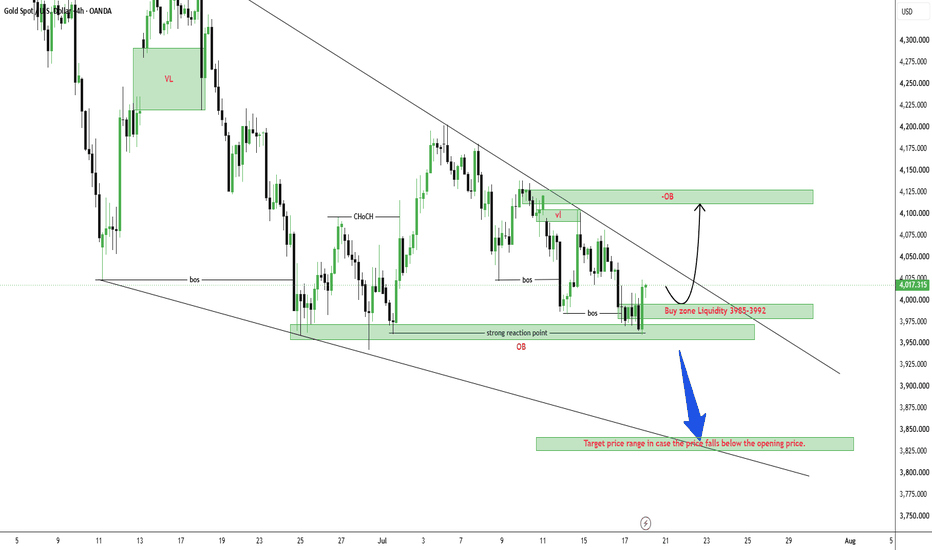
 Long
Long