XAU/USD 4H — GOLD AT THE DECISION ZONEGold is currently trading around 4,376, sitting between the 4,392 support/trendline and 4,365 structural support. The next move depends heavily on whether buyers can reclaim the upper resistance zone.
📊 Market Structure
Recent recovery from the 4,282 swing low shows bullish momentum on the 4H chart.
Price is now testing the 4,392–4,365 support area.
4,392.27 = 4H trendline + 0.786 Fib support.
4,365.57 = previous swing HL + 0.618 Fib + OB base.
A sustained break below this area would weaken the current bullish structure.
🟢 Bullish Scenario
If buyers defend 4,365–4,392 and price reclaims 4,435.05, the chart opens the path toward:
4,449.83 → 4,510.93 → 4,541.33 → 4,589.13
The 4,468.84–4,589.13 bearish FVG remains the major upside supply/decision zone.
A confirmed 4H breakout above 4,435.05 would provide stronger confirmation than buying directly inside the current support area.
🔴 Bearish Scenario
If price is rejected and loses 4,365.57, downside levels visible on the chart are:
4,335.10 → 4,311.52 → 4,282.34
A deeper structural invalidation is marked at 4,235.17.  Long
Long
Long 
XAUUSD 1H: Demand Zone Retest After Liquidity Sweep 4,400 TargetGold is showing a potential bullish continuation setup on the 1H chart.
After the previous bearish structure, price formed a liquidity sweep near the 4,260 area followed by a bullish CHOCH and a strong recovery. Price then moved within an ascending channel and is now consolidating around a key demand zone near 4,340–4,355.
As long as this demand zone holds, the setup points toward a potential move higher, with 4,400 resistance marked as the primary target area.
Key Levels:
- 🟦 Demand Zone: 4,340–4,355
- 🔴 Resistance: 4,400
- 🎯 Target: 4,400
- 📈 Structure: Bullish after CHOCH + liquidity sweep
A decisive break below the demand zone would weaken this bullish scenario. Long 
 Long
Long
 Long
Long
GOLD 18/09 — RECOVERY CONTINUES? H1 SCALPINGGold has continued its recovery from the 4,260–4,280 area and is now trading close to the 4,398 resistance zone. The short-term structure remains constructive, with buyers pushing price back toward the previous high.
For the US session, Emma's focus is on buying the confirmed pullback rather than chasing the current impulse. The key area to watch is 4,331–4,340, where previous resistance has turned into intraday support.
📌 MAIN SCENARIO
The primary area to watch is 4,331–4,340. If Gold pulls back into this zone and shows a bullish reaction, the preferred setup is to Buy the confirmed pullback, targeting 4,398 first.
A successful break and hold above 4,398 can open the way toward 4,437–4,440. If 4,331 fails decisively, the bullish setup weakens and attention should shift toward the lower support around 4,303.
🔑 KEY LEVELS
🔴 4,437–4,440 — Major resistance / extended target
🔴 4,398 — Key resistance / first target
🟢 4,331–4,340 — Main pullback & buy zone
🟢 4,303 — Key support / bullish invalidation area
🎯 PREFERRED SCENARIO
Gold remains above the 4,331 area.
Wait for a pullback toward 4,331–4,340.
Look for bullish rejection/confirmation before entering.
First upside target: 4,398.
If 4,398 breaks and holds → next target 4,437–4,440.
Avoid chasing Buy after the strong impulse; wait for the retracement.
A decisive break below 4,303 weakens the bullish setup.
🟢 BIAS
BULLISH — BUY THE CONFIRMED PULLBACK.
For the US session, the setup is simple: 4,331 is the key — hold it, look for the Buy; lose it, step aside. Long 
Buy Today, Sell Tomorrow for 3–5% – Daily Breakout SetupAVALON TECHNOLOGIES LIMITED — BTST BREAKOUT SETUP
Entry, Stop Loss & Targets Are Clearly Defined — Helping You Plan Your Trade With Confidence.
📊 Stock Strength: 75/100
(Note: Higher score indicates stronger stock conditions, not guaranteed returns.)
A bullish breakout has appeared on the 1D timeframe with positive price action and strong volume expansion.
🔄 Trade Type: BTST
────────────────────
🎯 TRADE LEVELS
ENTRY: ₹2,433
🛑 STOP LOSS
ATR SL: ₹2,222
🎯 TARGETS
T1: ₹2,506 (+3%)
T2: ₹2,530 (+4%)
T3: ₹2,555 (+5%)
────────────────────
📈 VOLUME
20D Volume: 394%
1D Volume: 627%
────────────────────
⏱ Timeframe: 1 Day
📌 Trade Entry: Take the trade only after 3:15 PM.
The position can be held for the next trading session if the trend remains strong.
The setup is based on breakout structure, price action, volume strength and trend analysis.
────────────────────
📈 Risk Management
Stop Loss is compulsory. Consider position sizing according to your risk and avoid risking more than you can afford to lose.
────────────────────
⚠️ Disclaimer:
This is a technical analysis setup for educational purposes only and not a buy/sell recommendation. Please do your own research and manage risk before taking any trade.  Long
Long
Buy Today, Sell Tomorrow for 3–5% – Daily Breakout SetupMACPOWER CNC MACHINES LIMITED — BTST BREAKOUT SETUP
Entry, Stop Loss & Targets Are Clearly Defined — Helping You Plan Your Trade With Confidence.
📊 Stock Strength: 75/100
(Note: Higher score indicates stronger stock conditions, not guaranteed returns.)
A bullish breakout has appeared on the 1D timeframe with positive price action and strong volume expansion.
🔄 Trade Type: BTST
────────────────────
🎯 TRADE LEVELS
ENTRY: ₹2,095
🛑 STOP LOSS
ATR SL: ₹1,906
🎯 TARGETS
T1: ₹2,158 (+3%)
T2: ₹2,179 (+4%)
T3: ₹2,200 (+5%)
────────────────────
📈 VOLUME
20D Volume: 350%
1D Volume: 214%
────────────────────
⏱ Timeframe: 1 Day
📌 Trade Entry: Take the trade only after 3:15 PM.
The position can be held for the next trading session if the trend remains strong.
The setup is based on breakout structure, price action, volume strength and trend analysis.
────────────────────
📈 Risk Management
Stop Loss is compulsory. Consider position sizing according to your risk and avoid risking more than you can afford to lose.
────────────────────
⚠️ Disclaimer:
This is a technical analysis setup for educational purposes only and not a buy/sell recommendation. Please do your own research and manage risk before taking any trade.  Long
Long
XAUUSD — Post-Fed Bullish RecoveryMarket Pulse
Gold is recovering strongly after the Fed raised rates by 25 bp to 3.75%–4.00%. The Fed still sees room for another hike this year, which keeps the medium-term rate backdrop restrictive. However, Gold has gained more than 1% today as the U.S. dollar eased from a seven-week high and oil prices moved lower.
Short-term Treasury yields remain elevated, so the recovery may stay volatile even if buyers keep control.
What the Chart Says
XAUUSD has made a strong bullish recovery on H1 after the sharp Fed-driven sweep toward the 4,260 area.
Price reclaimed 4,300, pushed through the 4,330–4,345 zone, and has now broken above the previous CHoCH around 4,365.
That shift shows buyers have regained short-term control.
Gold is currently trading near 4,370, so chasing the move higher is less attractive. A controlled pullback could give a cleaner continuation setup.
The first area I am watching is 4,330–4,345. If buyers defend this zone, price may continue toward the upper 4,388–4,398 resistance area.
A deeper correction could reach 4,295–4,305, which remains the stronger demand zone below.
Levels That Matter
4,388–4,398 — Main resistance
4,365–4,370 — Breakout structure
4,330–4,345 — First support / retest zone
4,295–4,305 — Main demand zone
4,260–4,270 — Post-Fed swing low
My Main Plan
The main plan is bullish.
I prefer waiting for a pullback toward 4,330–4,345 rather than buying after the current expansion.
If this zone holds and bullish confirmation appears, Gold could continue toward 4,388–4,398.
A deeper pullback toward 4,295–4,305 could still keep the recovery structure valid if buyers return there.
What I Need to See
I want price to hold above the reclaimed structure and continue forming higher lows.
A sustained H1 move below 4,295 would weaken the immediate bullish recovery idea and increase the risk of another deeper correction.
Final Read
The H1 picture has improved sharply after the post-Fed liquidity sweep.
For now, buyers have the short-term advantage, but Gold is already extended from the lows. I prefer waiting for the pullback and bullish confirmation rather than chasing price near resistance. Long 
Buy Today, Sell Tomorrow for 3–5% – Daily Breakout SetupBEML LIMITED — BTST BREAKOUT SETUP
Entry, Stop Loss & Targets Are Clearly Defined — Helping You Plan Your Trade With Confidence.
📊 Stock Strength: 95/100
(Note: Higher score indicates stronger stock conditions, not guaranteed returns.)
A bullish breakout has appeared on the 1D timeframe with positive price action and strong volume expansion.
🔄 Trade Type: BTST
────────────────────
🎯 TRADE LEVELS
ENTRY: ₹2,089
🛑 STOP LOSS
ATR SL: ₹1,970
🎯 TARGETS
T1: ₹2,151 (+3%)
T2: ₹2,172 (+4%)
T3: ₹2,193 (+5%)
────────────────────
📈 VOLUME
20D Volume: 188%
1D Volume: 264%
────────────────────
⏱ Timeframe: 1 Day
📌 Trade Entry: Take the trade only after 3:15 PM.
The position can be held for the next trading session if the trend remains strong.
The setup is based on breakout structure, price action, volume strength and trend analysis.
────────────────────
📈 Risk Management
Stop Loss is compulsory. Consider position sizing according to your risk and avoid risking more than you can afford to lose.
────────────────────
⚠️ Disclaimer:
This is a technical analysis setup for educational purposes only and not a buy/sell recommendation. Please do your own research and manage risk before taking any trade.  Long
Long
 Long
Long
XAUUSD – Gold Recovery Meets Channel ResistanceXAUUSD – Gold Recovery Meets Channel Resistance
Gold is trying to extend its recovery after holding above the lower liquidity zone, but the market is not in a clean bullish continuation yet.
Price is now trading around 4,386 after recovering from the previous sellside liquidity area near 4,250 – 4,300. This reaction shows that buyers are still active from the lower part of the structure. However, the bigger chart still shows gold moving inside a wide descending channel, so the next resistance area will be very important.
From the market side, gold is supported by softer USD conditions, lower oil prices, and weaker U.S. Treasury yields. The daily close above the SMA 100 near 4,320 also helps buyers defend the recovery structure. But RSI remains neutral, which means momentum is not aggressive yet. Buyers still need confirmation before the move can become stronger.
Technical view:
Gold reacted from the sellside liquidity zone and recovered toward 4,386.
Price is still trading inside a broader descending channel.
The nearest key level is 4,332, which now acts as short-term support.
As long as gold holds above 4,332, buyers still have room to push higher.
The first upside resistance is around 4,430 – 4,480.
A clean break above this zone may open the way toward 4,641.
The 4,641 area is the larger sell zone and major resistance to watch.
If gold fails below the channel resistance, sellers may try to push price back toward 4,332 again.
Key levels to watch:
Current price: 4,386
Short-term support: 4,332
Liquidity support: 4,250 – 4,300
Sell scalping area: 4,480
Major sell zone: 4,641
Bullish confirmation: above 4,480
Bearish pressure returns: below 4,332
Main scenario:
If gold holds above 4,332 and continues to build higher lows, buyers may attempt to push price toward 4,480.
A clean break above 4,480 would show stronger bullish momentum and may open the next upside path toward 4,641.
Alternative scenario:
If gold rejects from the channel resistance or fails to hold 4,332, the recovery may weaken.
In that case, sellers may try to pull price back toward the previous liquidity zone around 4,250 – 4,300 before buyers return again.
Hannah’s view:
Gold is recovering, but the chart is still asking for confirmation.
The close above the SMA 100 gives buyers a better position, but the descending channel resistance is still the main barrier. I do not want to chase price in the middle of the move. The cleaner plan is to watch whether gold can hold 4,332 and break 4,480.
Main view: gold can continue recovering while 4,332 holds. A break above 4,480 supports continuation toward 4,641. If 4,332 fails, price may return to the lower liquidity area. No confirmation means no trade.
Do you think gold can break the channel resistance, or will sellers defend the 4,480 area again?
Long 
Fibo Retest Before the Next Bullish WaveFundamental Analysis
Gold is recovering as the U.S. dollar, Treasury yields and oil prices ease ahead of today’s Fed decision. Markets are pricing roughly a 93% probability of a 25 bp hike, so the Fed’s guidance may matter more than the rate move itself.
Technical Analysis
On H1, Gold has reacted strongly from the 4,250–4,265 SSL and confirmed a bullish CHoCH followed by BOS.
Price is now testing the 4,325–4,350 Fibo Zone. A controlled pullback into this area may offer the cleaner continuation setup.
If buyers defend the zone, the next upside focus is the 4,365–4,380 POC, followed by 4,400–4,415 BSL.
Important Key Levels
4,400–4,415 — BSL / Major Resistance
4,365–4,380 — POC
4,325–4,350 — Fibo Zone
4,250–4,265 — SSL / Main Support
Trading Scenario
Buy priority remains on a pullback into 4,325–4,350 followed by bullish H1 confirmation.
Target: 4,365–4,380 first, then 4,400–4,415.
Invalidation: H1 acceptance below the Fibo Zone.
Overall View
Short-term momentum has shifted toward recovery after the BOS. Rather than chase the current move, the cleaner plan is to wait for support to hold and follow the next bullish wave.
Will Gold retest the Fibo Zone before pushing toward 4,400? Long 
STYL : Cup & Handle Taking Shape — Demand Zone HoldsSeshaasai Technologies Ltd. NSE:STYL is developing an interesting Cup & Handle structure on the daily chart, with the handle currently testing an important demand/confluence area.
Key Observations :
1. Cup formation: After the post-listing decline, price formed a broad base and recovered toward the IPO/major high zone around ₹433–437, completing the larger cup structure.
2. Supply reaction: The first attempt near the previous high was rejected, followed by another pullback. This indicates that the ₹433–437 area remains the major supply/resistance zone.
3. Handle development: The subsequent decline has so far held the ₹343–358 demand zone, which is close to the lower portion of the developing handle.
4. EMA confluence: The demand area is supported by the 100 EMA around ₹346.5, while the 50 EMA around ₹370.8 is currently acting as an intermediate dynamic level.
5. Momentum: RSI has cooled from the previous overbought region and is now around the neutral zone. This gives the handle room to develop without the stock remaining excessively extended.
Trade Plan:
Trigger:
A sustained move above ₹394 and RSI above 50 can be treated as a confirmation of the developing handle breakout / short-term structure reversal.
Upside levels:
₹437–438: Major resistance / previous high
Above ₹437–438: price discovery becomes possible, subject to breakout strength and volume.
Invalidation:
A decisive breakdown below the ₹343–358 demand zone, particularly a daily close below the lower boundary, would weaken the current Cup & Handle thesis.
Risk management:
Rather than entering solely because price is inside the demand zone, the cleaner setup is to wait for price confirmation above ₹394, preferably accompanied by expanding volume. Position size should be calculated according to the predefined risk per trade.
Important technical distinction:
₹394 does not validate the demand zone itself. It validates the handle/recovery structure. The demand-zone thesis is already supported by the reaction from ₹343–358; ₹394 is the potential confirmation trigger.
------------------------------------------------------------------------------------------------------------
Disclaimer: This is a personal technical-market observation for educational/informational purposes and is not investment advice. I am not a SEBI-registered investment adviser/research analyst. Please conduct your own research and manage risk according to your individual circumstances.  Long
Long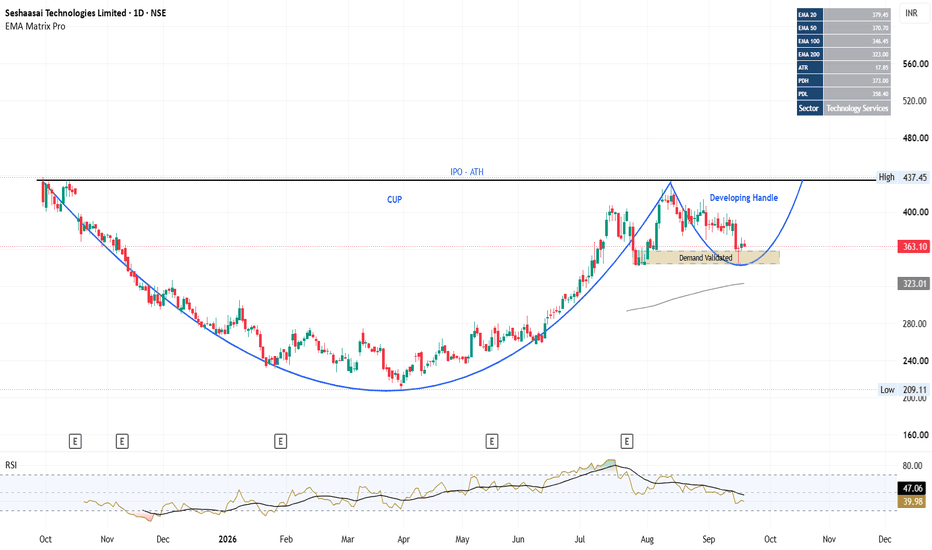
 Long
Long
Long 
BRIAN XAUUSD – GOLD HOLDS VALUE BEFORE NEXT MOVE BRIAN XAUUSD – GOLD HOLDS VALUE BEFORE NEXT MOVE
Gold is still trading inside a sensitive value area after the recent recovery attempt from the lower structure.
The macro background remains mixed. Gold recently received support from weaker oil prices and softer US Treasury yields, which reduced some upside pressure on the US dollar. However, the Fed’s September policy stance remains restrictive, and that keeps the market careful. When gold is supported by weaker yields but still capped by Fed uncertainty, price often moves inside value before choosing the next clean direction.
That is exactly what the chart is showing now.
Gold is not breaking strongly higher yet, but sellers have also not managed to push price back into a deeper bearish continuation. The current structure is a decision zone.
Technical structure
On the H3 chart, gold is trading around 4,390 - 4,400 after recovering from the recent downside channel.
The first important zone is the POC / Value Support – Key Acceptance Zone around 4,350 - 4,370. This area has acted as the main base where price started to stabilize again. As long as gold remains above this zone, buyers still have a chance to build another recovery leg.
Above the current price, the nearest reaction area is around 4,433 - 4,450. This is the upper value / HVN area and also the first important level where price may face short-term selling pressure. If gold breaks and accepts above this area, the next upside path can open toward the larger sell zone at 4,594 - 4,628.
That 4,594 - 4,628 zone is the major resistance on this chart. It sits below the highest price area of the week and represents a potential seller interest zone if gold rallies too aggressively without strong acceptance.
On the downside, if gold loses the 4,350 - 4,370 value support, the structure becomes weaker again. In that case, the market may rotate lower before buyers can create another meaningful reaction.
Important zones
Current price area: 4,390 - 4,400
Gold is recovering but still below the first upper value resistance.
POC / Value Support: 4,350 - 4,370
Main buyer defense zone and key acceptance area.
Upper Value / HVN: 4,433 - 4,450
First resistance and short-term reaction area.
Buyside liquidity: 4,350 - 4,380
Liquidity zone where price may retest before any stronger move.
Sell zone: 4,594 - 4,628
Major upper resistance and potential seller interest area.
Weekly high area: 4,650+
The highest price area of the week and the larger liquidity reference.
Trading scenario
Priority view: buy reaction if 4,350 - 4,370 holds
Entry:
Look for buy positions only if gold holds above the POC / Value Support around 4,350 - 4,370 and shows clear bullish rejection.
Stop Loss:
Below the local sweep low or below the value support zone.
Take Profit:
TP1: 4,433 - 4,450
TP2: 4,594 - 4,628
TP3: Trail higher only if gold breaks and accepts above the sell zone
This setup follows the current value-support reaction. Buyers are not fully dominant yet, but the structure still allows a recovery if the POC base holds.
Alternative sell scenario
If gold reaches 4,594 - 4,628 and shows strong rejection, sellers may try to rotate price lower again.
Entry:
Look for sell positions only if gold rejects clearly from the 4,594 - 4,628 zone.
Stop Loss:
Above the rejection high or above the weekly liquidity area.
Take Profit:
TP1: 4,450
TP2: 4,370
TP3: 4,350 if downside pressure expands
A sell setup from the upper zone is only cleaner if price reaches resistance first. Selling directly in the middle of value is not ideal.
Final view
Gold is currently holding value after a difficult corrective phase.
The short-term structure is trying to recover, but the market still needs confirmation above 4,433 - 4,450 before buyers can regain stronger control. If that zone breaks, the next larger target becomes 4,594 - 4,628.
For now, my map is simple:
Hold 4,350 - 4,370 = buyers still defend value.
Break 4,450 = recovery momentum improves.
Reach 4,594 - 4,628 = major resistance test.
Reject 4,594 - 4,628 = sellers may return.
Lose 4,350 = gold may rotate lower again.
Gold is not a clean chase market right now. It is still a value-confirmation market.
The key is whether buyers can keep price above the POC support and force acceptance above the upper value area. If they can, gold may continue toward the major sell zone. If not, the market may stay trapped inside value before the next bigger move.
Will gold reclaim the upper value zone, or will sellers defend 4,594 - 4,628 again?
Long 
XAUUSD — 4,290 Retest Before the Next Push?
Gold is trading around 4,317 after a strong post-Fed recovery.
M30 structure is improving, but price is still sitting inside a near-term decision area.
A bounce is not enough.
The pullback will tell us more.
The simple read
The key zone today is 4,285–4,298.
If buyers defend this pullback area, Gold may recover toward 4,335 first, then challenge the major resistance around 4,357–4,367.
A clean breakout above that zone could open the way toward 4,396–4,399.
If 4,285 fails, the 4,277 OB becomes the next support.
Key price zones
4,285–4,298 — key pullback zone
4,277 — OB support
4,357–4,367 — major resistance
4,396–4,399 — upper target
4,236–4,245 — major support
The recovery structure is improving, but I prefer the pullback rather than chasing price.
Can 4,290 hold and send Gold toward 4,36x? Long 
 Long
Long
 Long
Long