 Short
Short
XAUUSD — Bullish Wave Structure Toward 4,490
From Kelly’s view, gold is rebuilding a bullish structure after breaking away from the previous descending trendline. Price is trading around 4,391, and the recent recovery suggests buyers are trying to establish a new impulsive sequence toward the upper Fibonacci resistance zones.
The key idea is simple: the main trend may stay bullish while price continues to form higher lows, with 4,405–4,415 acting as the first important resistance test before a potential expansion toward 4,459 and the 4,488–4,497 area.
⟡ Market structure
Gold has recovered strongly from the 4,240–4,260 swing-low area and is now trading above the former descending trendline.
The short-term structure has shifted toward higher lows, while the projected Elliott Wave path suggests another bullish impulse may be developing.
The first obstacle is the Fibonacci resistance zone around 4,405–4,415. If buyers can absorb selling pressure here, price could continue toward 4,433 and 4,459.
Above that, the major resistance and projected Wave (5) completion zone sits around 4,488–4,497, close to the 2.618 Fibonacci extension.
➤ Key levels
◌ Current price area: 4,390–4,395
◌ Main bullish retest zone: 4,375–4,390
◌ Strong support: 4,335–4,350
◌ First resistance: 4,405–4,415
◌ Key resistance: 4,433
◌ First target: 4,459
◌ Main target: 4,488–4,497
◌ Invalidation: Below 4,335
⌁ Elliott Wave view
Wave (1): The current recovery may extend toward the 4,405–4,415 resistance area.
Wave (2): A controlled pullback toward approximately 4,375–4,390 could follow if buyers take profit near resistance.
Wave (3): If the pullback holds and bullish confirmation appears, the stronger expansion could target 4,459.
Wave (4): Price may then consolidate or retrace toward the 4,430–4,440 area.
Wave (5): The final bullish leg could extend toward 4,488–4,497, where the major Fibonacci resistance and projected Wave (5) target overlap.
▸ Trading scenario
Preferred bullish scenario
Entry: 4,375–4,390 after bullish confirmation
Stop Loss: Below 4,335
Take Profit 1: 4,410–4,415
Take Profit 2: 4,459
Take Profit 3: 4,488–4,497
The cleaner plan is to wait for buyers to defend the projected Wave (2) retracement area rather than chase price directly into Fibonacci resistance.
Alternative scenario:
If gold breaks and holds above 4,415 without a deeper pullback, a confirmed retest of this zone could support continuation toward 4,433–4,459.
◌ Invalidation
The bullish structure would weaken if price loses the 4,335–4,350 support area and begins trading back below the recent higher-low structure. A sustained break below 4,335 would invalidate the preferred bullish wave sequence.
⌁ Kelly’s view
Kelly’s main view remains bullish while gold continues to defend its higher-low structure above 4,335–4,350.
The immediate test is 4,405–4,415. If buyers can break and hold above this Fibonacci resistance, the next wave may open the way toward 4,459, followed by the larger 4,488–4,497 Wave (5) target.
Do you think gold will complete this bullish wave structure toward 4,490, or retest the key support zone first? Long 
Gold rises vs Fed — FOMO or liquidity trap?Gold is showing a strong technical rebound despite the bearish macro backdrop, recovering from the 4,250–4,280 area and pushing back toward 4,390–4,400. However, the broader H4 structure has not yet changed: price remains inside the descending channel and is approaching the upper trendline. This makes the current rally an important test rather than a confirmed bullish reversal.
The interesting part is the divergence between macro narrative and short-term price flow. The Fed delivered a 25bp rate hike and maintained a relatively hawkish stance, while the latest U.S. jobless claims also showed a resilient labor market. Normally, this combination should create pressure on Gold. However, Treasury yields subsequently pulled back, the USD weakened, and oil prices eased as concerns over supply disruptions diminished. These moves helped Gold rebound more than 2% on Thursday.
From the institutional-flow perspective, this is exactly why FOMO should be avoided. Gold is rising, but the rally is occurring into a major technical resistance area while the broader H4 structure remains bearish. If price reaches 4,400–4,420 and fails to break the descending trendline, this rebound could become another liquidity trap before sellers return.
Bearish Scenario — Preferred Bias
If Gold is rejected around 4,390–4,420 and fails to break the descending trendline, sellers could regain control and push price back toward 4,330–4,350, followed by the 4,260–4,280 Supply zone.
The ideal setup is therefore not to chase the current rally, but to wait for rejection and confirmation before following the bearish flow.
Bullish Scenario
If buyers can produce a clean H4 close above the descending trendline and hold above 4,420, the bearish structure would begin to weaken. In that case, Gold could extend toward 4,450–4,480.
For now, the market is giving us an important message: Gold can rally even when the headline macro narrative looks bearish if USD and yields reverse lower. Therefore, the next move should be judged by the interaction between price and the trendline, rather than simply assuming that the Fed hike must immediately push Gold lower.
KEY LEVELS:
🔴 4,390–4,420 — Descending trendline / key resistance
🔴 4,450–4,480 — Major recovery zone
🟢 4,330–4,350 — Near-term support
🟢 4,260–4,280 — Major Supply / downside target
BIAS: BEARISH — NO FOMO. WAIT FOR REJECTION AT THE TRENDLINE OR A CONFIRMED BREAKOUT.
The question now is not “Gold is going up, should we buy?” — but “Is this a genuine structural breakout, or liquidity being built before the next sell-off?” Short 
Gold Reclaims Structure — Is Liquidity Next?Timeframe: 2H XAUUSD
Price recently swept sell-side liquidity around the 4,250–4,270 area and reacted strongly.
Strong bullish displacement followed, showing a shift in short-term momentum.
Price has now reclaimed the 4,360–4,380 structure area, giving a bullish BOS/reclaim signal.
The broader structure is still mixed, but the short-term order flow has turned bullish with the latest higher low and impulsive move.
🔑 KEY LEVELS:
🟢 Bullish Demand / Order Block: 4,270–4,315
🔵 Reclaim / Confirmation: 4,360–4,380
🔴 Buy-Side Liquidity / Resistance: 4,470–4,500
⚠️ Major invalidation area: Below 4,250
Previous local highs around 4,400–4,430 may act as intermediate resistance.
🎯 TRADE SETUP — Bullish Scenario:
Entry: 4,340–4,365 on a confirmed pullback/retest
Stop Loss: 4,265
TP1: 4,400
TP2: 4,430
TP3: 4,480–4,500
Risk/Reward: Approximately 1:1 to TP1, 1:1.5 to TP2, and 1:2.5+ to TP3, depending on entry.
🚀 POSSIBLE NEXT MOVE:
Bullish: If price holds above the reclaimed 4,360–4,380 zone and prints bullish confirmation on a retest, continuation toward 4,400 → 4,430 → 4,480+ liquidity becomes the scenario to watch.
Bearish: If price fails to hold the reclaim and breaks back below the recent displacement base, a deeper retracement toward the 4,270–4,315 demand/order block becomes possible.
⚠️ INVALIDATION:
A decisive 2H close below the 4,250–4,270 liquidity-sweep low would invalidate the bullish structure and suggest the sell-side liquidity sweep failed. Long 
Gold After FOMC: The Battle at 4,400–4,420After FOMC, Gold has absorbed almost the entire selling pressure and bounced strongly from 4,234. Buyers have now regained most of their previous position, while M15 & H1 have formed bullish structures.
🔴 Key Decision Zone: 4,400–4,420
This is the final line of defense for sellers.
Rejection: Watch the reaction closely and look for a potential Sell scalp.
Break & Hold: Shift focus to Buy on pullbacks, with potential targets at 4,460 → 4,480 → 4,500 → 4,580 → 4,600.
🟢 Support Levels:
4,340 → 4,305 → 4,260
📌 Today’s Bias:
Prioritize Buy the dip. Sell scalps can still be considered around resistance, but stop looking for Sell setups if price breaks and holds above 4,420.
Market Psychology:
Sellers made a strong effort to keep the bearish move alive after FOMC, but they have not been able to maintain the downside momentum. The key question now is no longer “Can Gold continue lower?” but:
“Can sellers defend 4,400–4,420?”
4,420 is the line that matters. A clean break could mark the beginning of a new bullish wave. Long 
SRF Bulls Are Back! 2500 CE trade Momentum Trade Setup!Hello guy's let's focus on an options buying trade in SRF, as it has finally started showing some real momentum after spending days in a weak structure.
The important part is that price has moved above the short-term resistance with strong volume, while the 9/21 EMA structure is turning bullish.
TRADE SETUP 👇
Underlying: SRF
Timeframe: 15 Min
Entry: Around 2,532
Target: 2,590
Invalidation: Below 2,502
Option: SRF 2500 CE strike
Option Entry: Around 62-63
Keep stop loss at 45, and hold for the target of 71/80/90++
WHY I LIKE THIS SETUP
Breakout from the short term resistance zone
9/21 EMA showing bullish momentum
Strong volume expansion during the move
RSI has moved back above 60, showing buyers are active
Underlying price is holding above the breakout area
The main level I am watching now is 2,530 .
If SRF sustains above this level, the next move towards 2,590 can come into focus.
For the exact levels and structure, watch the chart above.
Risk Management is important. If the underlying loses 2,502, the setup gets invalidated.
Disclaimer: This is my personal market view for educational purposes only. Please do your own research before taking any investment or trading decision. Technical levels can fail and markets involve risk.
By— @TraderRahulPal
 Long
Long
XAUUSD 4384 recovery — 4475 is the trap XAUUSD 4384 recovery — 4475 is the trap
Gold is trying to breathe again.
After the heavy selloff into the 4,235 area, price finally found a reaction base and started pushing back above the old sellside liquidity zone. That recovery matters. Sellers did not get a clean continuation lower, and buyers are now trying to rebuild structure around 4,350 - 4,385.
But I still don’t see a clean bullish market yet.
Price is sitting under the next liquidity pocket, and the chart is showing a possible recovery into resistance first, not a free breakout. The first key level is 4,422. If gold can reclaim that area, the next draw is 4,475 — and that is where I would start paying close attention.
Why?
Because 4,475 is not just a target. It is also a trap zone.
That area sits above recent buy-side liquidity, and if price runs into it while traders chase late buys, sellers may use that move as a better short entry. With market caution still strong after the Fed decision, plus oil and geopolitical headlines creating unstable flows, gold can spike first and reverse fast.
Main bias: short-term recovery while gold holds above 4,300 - 4,330.
But the bigger structure still needs confirmation. A push into 4,422 - 4,475 can happen, but I don’t want to chase the move after it is already extended.
Trading scenario:
Buy idea only if gold holds above 4,330 and breaks 4,422 with clean candles.
Entry zone: 4,350 - 4,422 after confirmation
Deeper buy zone: 4,300 - 4,330 if price sweeps and reclaims
Stop loss: below 4,280
TP1: 4,422
TP2: 4,475
Sell reaction only if gold reaches 4,475 and rejects hard.
Sell zone: 4,422 - 4,475 after rejection
Stop loss: above 4,500
TP1: 4,350
TP2: 4,300
TP3: 4,260 if bearish momentum returns
No reclaim, no chase.
No rejection, no sell.
If gold breaks below 4,280 with pressure, the recovery idea is cooked. Then sellers can target the lower liquidity again.
For now, I’m reading this as a recovery from the 4,235 low, but 4,475 is where the real test begins.
You think gold grabs 4,475 first, or rejects before touching the trap?
Long 
BHARAT PETROLEUM (BPCL) – WEEKLY CHARTBullish Setup | Ascending Channel
BPCL is trading within an ascending channel, showing a potential bullish continuation setup. Price is near the channel support zone, with a possible move toward higher resistance levels.
🎯 TRADE LEVELS:
🟢 Entry: Above ₹315
🛑 Stop Loss: ₹298
🎯 Target 1: ₹330
🎯 Target 2: ₹350
🎯 Target 3: ₹370
📌 Wait for bullish candle confirmation. Trail SL as price moves in your favor.
DISCLAIMER :
This content is created by Logic Trade Room for educational and informational purposes only.
It is not financial advice, investment advice, trading advice, or a recommendation to buy or sell any security, index, futures contract, or options contract.
Trading and investing in the stock market involve substantial risk, including the risk of losing your entire invested capital. Past performance does not guarantee future results.
The entry, stop-loss, and target levels mentioned are illustrative chart-based levels and may change with market conditions. No trade setup or market prediction is guaranteed to be accurate.
Always conduct your own research, verify live market prices, and consult a qualified financial advisor before making investment decisions.
Trade with logic. Risk with discipline.
Logic Trade Room  Long
Long
XAUUSD — Post-Fed FVG Repricing Buy Setup
Gold is trading around $4,320 after a highly volatile post-FOMC session. The Fed raised rates by 25 bp to 3.75%–4.00% and signaled that additional tightening may still be needed, pushing the U.S. dollar to a seven-week high and lifting short-term Treasury yields. Despite that hawkish backdrop, Gold recovered more than 1% from the post-Fed low as traders reassessed positioning and oil prices eased from recent highs.
Brent crude has also pulled back toward $104, reducing some of the immediate energy-driven inflation pressure, although broader Middle East risks remain elevated.
SMC View
H1 price remains inside the broader descending channel, so the higher-timeframe structure is not fully bullish yet. However, the latest move swept buy-side liquidity near $4,350–$4,360, delivered a strong bearish displacement, and then reacted sharply from the lower portion of the channel.
The current rebound may represent bullish repricing after that liquidity event. The nearby FVG around $4,285–$4,305 is the key mitigation area to watch.
A controlled pullback into this imbalance, followed by a bullish MSS or CHOCH, could confirm that buyers are rebuilding short-term order flow toward the upper liquidity zones.
Main Trading Scenario
Buy Priority: $4,285–$4,305
Condition: Wait for Gold to retrace into the FVG / discount area and form bullish rejection, followed by a lower-timeframe bullish MSS or CHOCH.
Entry: $4,285–$4,305 after confirmation
SL: Below $4,260 and the reaction low
TP1: $4,345–$4,365
TP2: $4,390–$4,405
Key Zones to Watch
$4,401.403 — Premium Bearish OB
$4,345–$4,365 — Reclaimed buy-side liquidity / resistance
$4,285–$4,305 — Main FVG buy zone
$4,225–$4,245 — External SSL / Deep Discount Demand
$4,260 — Immediate bullish invalidation area
Descending channel resistance — Major structural barrier
Prime Gold View
The buy bias is focused on confirmed repricing from the FVG, not chasing the current recovery.
If buyers defend $4,285–$4,305 and produce a clean bullish structure shift, Gold could rotate back toward $4,350–$4,365, with the $4,400 Premium Bearish OB becoming the larger upside objective.
The broader channel remains bearish, so confirmation is essential before treating the recovery as sustainable.
No confirmation, no trade. Long 
Brent Crude started to roll over - is this a final top?Brent achieved a little over 78.6% retracement of the previous fall from the war peak in oil prices. Recently, I published an ED pattern on Brent that shows a possible top. Brent has the same pattern on the hourly chart, and it has broken down. On the daily chart, this ED is wave 5 of C, which means that this move higher in Oil could technically be coming to an end. The chart below is a daily chart on an arithmetic scale. On this scale, it is also near the top end of a rising channel. At this level, sentiment was 91% bullish, which has now fallen back a bit with prices. Logically, if the wave count is correct, oil prices should slowly keep easing from here for months to come. Similar to what happened after June 2022, when the Russia-Ukraine war was in its 6th month.  Short
Short
 Long
Long
 Long
Long
Gold: Possibility of Channel Breakout [Plan 18.09.2026: Fri]Probable Scenario Analysis:
⏺ Present Scenario:
Gold (XAUUSD) has been trading inside the downward-sloping channel for a long time. The price has been extremely volatile. Taking the support base at 4250, Gold OANDA:XAUUSD is now showing signs of reversal (from bearish to bullish). There is a high probability of a breakout from the channel. Probably, channel compression is over.
🟢 Bullish Scenario
Be bullish if the price decisively sustains above 4375. The probable bullish targets above 4375 are - 4405.25 and 4437.5. Strong resistance is at 4437.5.
🔴 Bearish Scenario
Be bearish if the price decisively trades below 4312.5. The probable bearish targets below 4312.5 are - 4482.25 and 4250. There is a strong support zone (SSZ) in the region (4482.25 - 4250).
🟡 No Trading Zone: (4375 - 4312.5).
⏺ Range of Consolidation (ROC): (4375 - 4250).
Here, 4312.5 is the median of the ROC. The median works like a trading session sentiment evaluator. The price trading above the median would offer bullish sentiment, while the price trading below the median would trigger bearish sentiment within the ROC.
● Events:
- 14 Sep (Mon): No events.
- 15 Sep (Tue): ADP Weekly Employment Change (05:45 PM IST, 🔵 Low Impact).
- 16 Sep (Wed): Core Retail Sales m/m (06:00 PM IST, 🟠 Medium Impact). Federal Funds Rate, FOMC Economic Projections, and FOMC Statement (11:30 PM IST, 🔴 High Impact).
- 17 Sep (Thu): Philly Fed Manufacturing Index (06:00 PM IST, 🟠 Medium Impact). Pending Home Sales m/m (07:30 PM IST, 🔵 Low Impact).
- 18 Sep (Fri): Capacity Utilization Rate (06:45 PM IST, 🔵 Low Impact). FOMC Member Bowman Speaks (07:00 PM IST, 🔵 Low Impact). FOMC Member Schmid Speaks (09:15 PM IST, 🔵 Low Impact).
● Intraday, Weekly, and Monthly Bias
Establish bias with respect to the opening price (of the particular session - Intraday, Weekly, and Monthly). If the price sustains above the opening price, then don't think of shorting. Look for bullish trades only. On the contrary, if the price sustains below the opening price, then don't think of going long. Look for bearish trades in that case.
● Disclaimer + End Note
- All the analyses would fail in the case of a major gap up, gap down, or price structure anomaly. Thus, practice PRAGMATISM in the live session.
- Trade only if there is a set-up. Remember, not trading is an extension of the trading activity.
- Mark your points. Trade your points. Price is GOD. Anything can happen in the markets. Thus, trade what you see, not what you believe.
- Always PRACTICE RISK MANAGEMENT. Always PROTECT YOUR CAPITAL. Be RESPONSIBLE.
- Be Strategic. Be Courageous. Be Patient. Be Wise.
- Every day is a new day. Thus, do not carry the baggage of past successes or failures. Leave the gardens of winning and losing. Establish yourself in equanimity. Always think from a new perspective.
- Let the joy of trading drive your effectiveness, not greed or fear. Believe in Possibilities.
Happy Trading! ANGEL ONE LTD – DAILY CHARTPrice is consolidating near the 0.382 Fibonacci level. A sustained move above ₹295.70 may support a bullish move toward the next resistance levels.
🎯 TRADE LEVELS:
🟢 Entry: ₹295.70
🛑 Stop Loss: ₹291.80
🎯 Target 1: ₹300.55
🎯 Target 2: ₹308.35
📌 Wait for candle confirmation. Trail SL as price moves in your favor.
DISCLAIMER :
This content is created by Logic Trade Room for educational and informational purposes only.
It is not financial advice, investment advice, trading advice, or a recommendation to buy or sell any security, index, futures contract, or options contract.
Trading and investing in the stock market involve substantial risk, including the risk of losing your entire invested capital. Past performance does not guarantee future results.
The entry, stop-loss, and target levels mentioned are illustrative chart-based levels and may change with market conditions. No trade setup or market prediction is guaranteed to be accurate.
Always conduct your own research, verify live market prices, and consult a qualified financial advisor before making investment decisions.
Trade with logic. Risk with discipline.
Logic Trade Room  Long
Long
Long 
NIFTY — POTENTIAL BULLISH REVERSAL SETUPNIFTY is showing an interesting technical structure that could indicate a shift from bearish momentum toward a potential bullish reversal.
The setup is based on two key technical observations across different timeframes:
🔹 15-Minute: 30 EMA & 50 EMA crossover + price reaction from the EMA zone
🔹 1-Hour: Prominent Doji formation following a sustained bearish move
The combination of these signals makes the current price action worth monitoring for confirmation of a possible upside move.
🔥 1. 15-MINUTE — EMA CROSSOVER SIGNAL :
On the 15-minute timeframe, the 30 EMA and 50 EMA have crossed, suggesting that short-term momentum may be undergoing a transition.
More importantly, NIFTY is showing a reaction around this EMA zone rather than continuing to accelerate lower.
The 30 EMA and 50 EMA can act as dynamic support/resistance during trending conditions. Therefore, if price continues to hold above this zone, it could indicate that buyers are gradually gaining control.
📌 What to watch:
Price sustaining above the 30/50 EMA zone
Bullish candles forming after the EMA reaction
Increasing buying momentum
Breakout above the recent intraday swing high
A sustained move above the EMA structure would provide stronger confirmation of the bullish thesis.
🕯️ 2. 1-HOUR — PROMINENT DOJI AFTER BEARISH MOMENTUM :
The second and potentially important component of this setup is visible on the 1-hour timeframe.
After a period of bearish momentum, a prominent Doji candle has formed.
A Doji represents a period where the opening and closing prices are relatively close, reflecting indecision between buyers and sellers.
When such a candle appears after an extended directional move, it can indicate that the prevailing momentum is losing strength.
🎯3. TARGET: 23,450
If the bullish reversal gets confirmed and NIFTY sustains the upward momentum, 23,450 can be considered a potential upside target.
Key Setup: 15M EMA crossover + EMA reaction + 1H Doji → potential bullish reversal toward 23,450 .
 Long
Long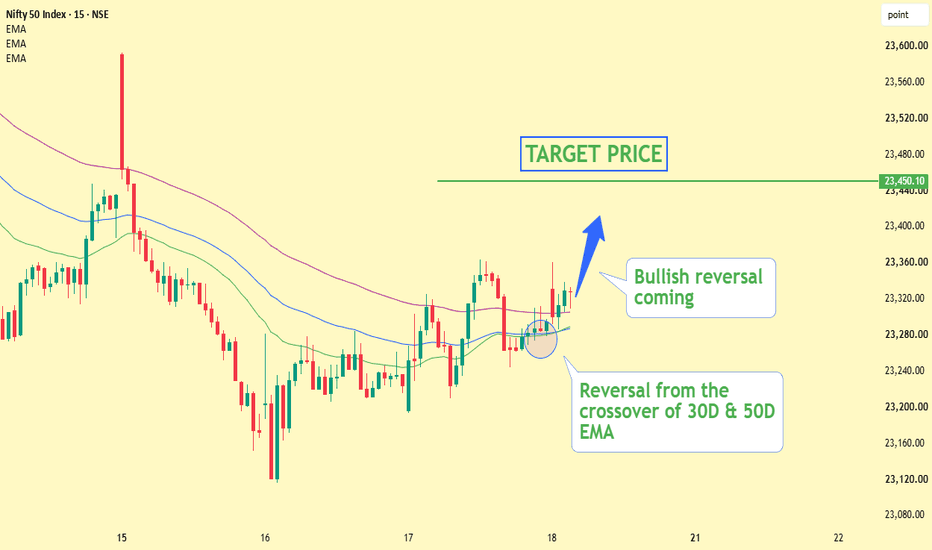


 Short
Short


 Long
Long


