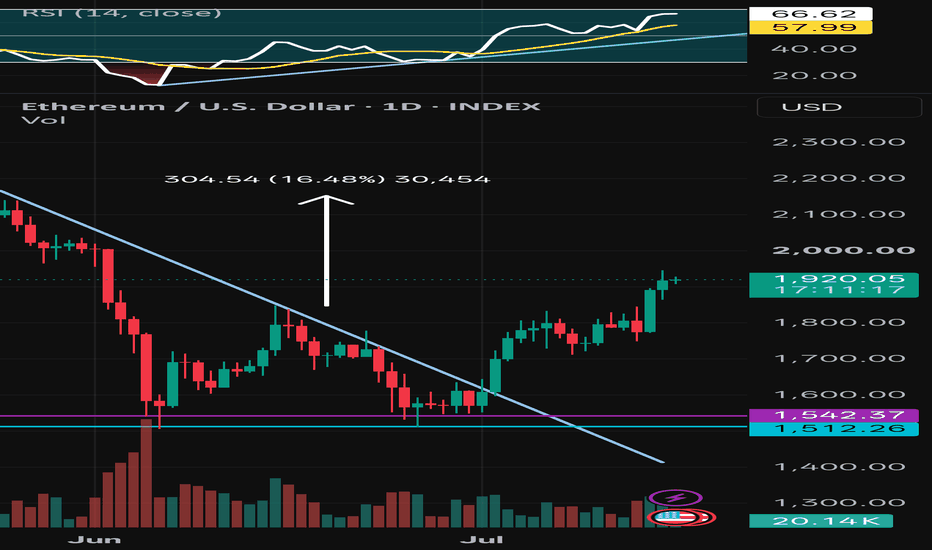
Day 1 - The 30 Trade Series The 30 Trade Series
In this series, we'll scan the markets each day in search of a very specific trend continuation setup. The objective is simple: take only 30 A+ quality trades that meet our criteria—no forcing setups, no unnecessary trades.
Once all 30 trades are completed, we'll analyze the results, review the statistics, and reflect on what we learned about the strategy's performance, execution, and consistency.
Community ideas
Premier Polyfilm cmp 70 Daily ChartPremier Polyfilm cmp 70 Daily Chart
- Support Zone 59 to 69 Price Band
- Resistance Zone 71 to 80 Price Band
- Support Zone made good ground for uptrend
Volumes are in good sync with average traded quantity
- Head & Shoulders + Cup & Handle + Rounding Bottom
- Breakout from Resistance Zone & Trendline seen attempted
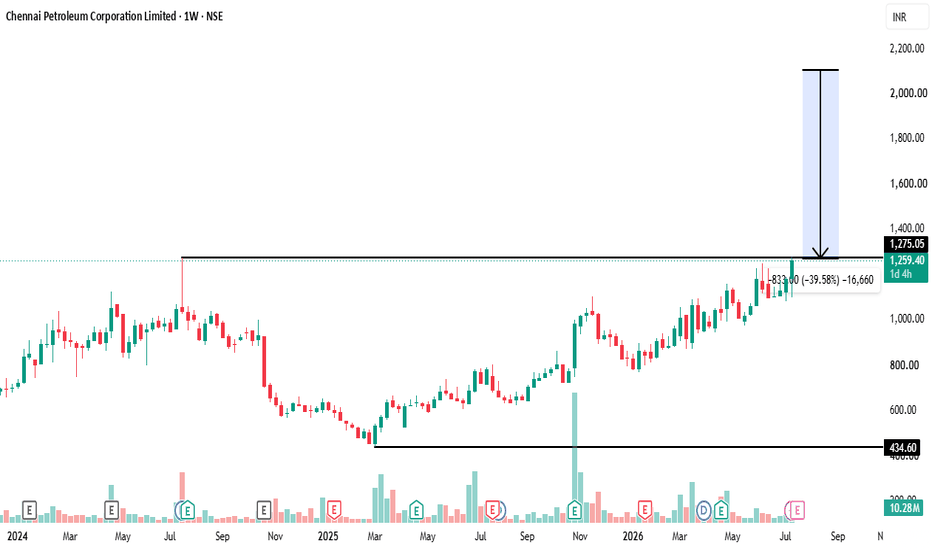
Chennai Petroleum Corporation Ltd🏆 Stock Setup of the Day | Chennai Petroleum Corporation Ltd. (NSE: CHENNPETRO)
📈 Timeframe: Weekly Chart
🚀 Multi-Year Breakout Near All-Time High Zone
Chennai Petroleum is displaying impressive relative strength after recovering from its 2025 lows. The stock is now consolidating just below a significant resistance area around ₹1,275, keeping the long-term uptrend intact.
🔹 Current Price: ₹1,260.50
🔹 Key Resistance: ₹1,275
🔹 Breakout Confirmation: Sustained weekly close above ₹1,275
🔹 Potential Target Zone: ₹2,100
🔹 Potential Upside: ~40%
📊 Technical View
✅ Strong long-term bullish structure with Higher Highs & Higher Lows
✅ Price is consolidating near resistance after a sustained rally—a healthy sign of strength
✅ Weekly trend remains positive with buyers maintaining control
✅ Volume expansion during the advance supports the bullish structure
👀 Key Levels to Watch
🟢 Support Zone: ₹1,180–₹1,220
🔵 Immediate Resistance: ₹1,275
🎯 Projected Target: ₹2,000–₹2,100
💡 Trading Perspective
A decisive breakout and weekly close above ₹1,275 could signal the next leg of the uptrend. Until then, watch for consolidation with improving volume, which often precedes strong directional moves.
⚠️ Disclaimer: This post is for educational and informational purposes only and should not be considered investment or trading advice. Please conduct your own research and follow proper risk management before taking any position.
🔥 Follow for daily high-probability breakout setups, trend analysis, and educational technical insights.
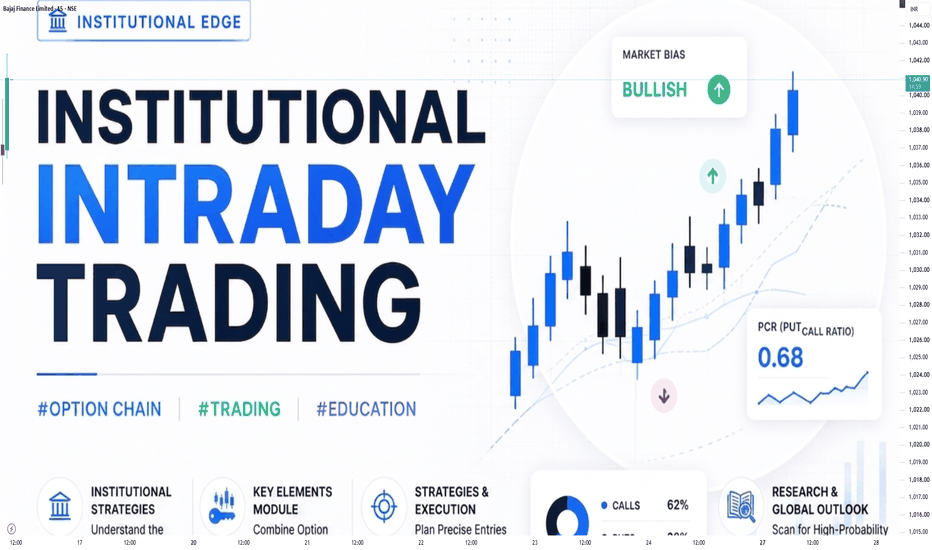
Institution Option TradingPCR (Put-Call Ratio) – Institutional Trading Strategy
What is PCR?
PCR = Put OI ÷ Call OI
It shows market sentiment of big players in indices like NIFTY 50.
Institutional Psychology
2. How Big Players Use PCR
Retail buys options randomly
Institutions control PCR zones to trap traders
👉 You follow PCR = You follow smart money
📈 PCR Levels (Game Changer)
3. Key Zones
PCR < 0.7 → Bearish sentiment (too many Calls) → ⚠️ Reversal possible
PCR 0.7 – 1 → Neutral zone
PCR > 1.2 → Bullish sentiment (too many Puts) → ⚠️ Reversal possible
👉 Extreme PCR = Trap zone (Institutional move coming)
Option AnalysisOptions Data
PCR at 0.90, slightly bearish reading
Max call pain sitting near 55,000, acting as a ceiling
What to Do
Short traders hold with stop-loss above 54,609 on daily close
Long trades only if index closes above 54,609
Avoid aggressive buying unless 56,400 is reclaimed with a proper closing
Key Risk
Crude oil above 100 dollars is a pressure point for India
Any global news on geopolitics can cause sudden sharp moves either way
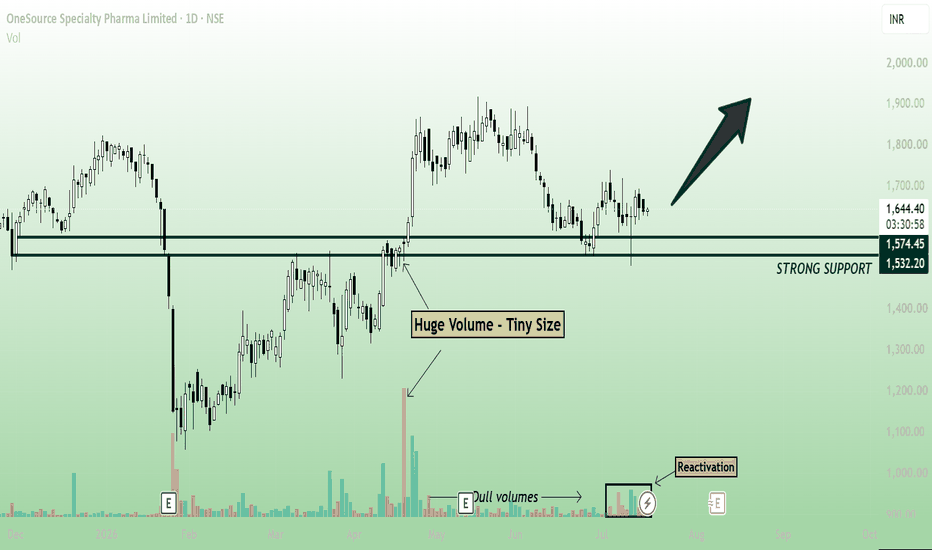
ONESOURCE - INTERESTING VOLUME ACTIVITY!DISCLAIMER: This publication is NOT a trade recommendation, but only my observation. Please do your own analysis before taking trades
Points to note:
------------------
1. First and foremost, the peculiar candle with such a small body but HUGE volumes. This is further confirmation of the importance of that zone.
2. Lots of orders in that zone. Now price is back there, and sustaining above the important support level.
3. Volumes keep drying up as the price moves away from the levels. Now that we're back there, volumes are returning.
4. We're also at the formation of the 2nd shoulder in the Head & Shoulders that is forming here.
Keeping these points in mind, the foll. trade:
-----------------------
ENtry CMP, SL 1499, TGT 1845
Oversold MarketsWhat is overbought?
When the market goes up too much, too fast — like it got overexcited. RSI crosses above 70. This means most people who wanted to buy have already bought. Not many buyers left. So the market will likely slow down or fall a bit.
What you do: don't buy now. If you're already in profit, book some of it. Keep your stop loss tight.
What is oversold?
When the market falls too much, too fast — like everyone panicked and sold everything. RSI drops below 30. Most of the panic selling is already done. So a bounce or recovery is likely coming.
What you do: don't rush in all at once. Wait for one green candle or a volume pickup as confirmation. Then buy in small parts.
Trading AnalysisWhere is Nifty right now?
Nifty closed at 23,689 on Thursday May 14. After a brutal fall earlier this week (it touched ~23,300), it bounced back for 2 days in a row. So right now it's in a recovery mood — but it hasn't really "fixed" itself yet. Think of it like someone who had a fever, now feeling slightly better, but not fully healthy.
2 What's the wall above? (Resistance)
If Nifty tries to go up next week, it will hit a wall around 23,500–23,600 first. That's the first test. If it somehow crosses that, the BIGGER wall is at 23,900–24,000 — where all the major moving averages (50-day & 200-day) are sitting. Lots of sellers will be waiting there to book profits. So going above 24,000 next week? Unlikely unless something very positive happens.
3 What's the floor below? (Support)
If Nifty starts falling, the first safety net is around 23,300–23,150. This zone has held multiple times recently. If it breaks this level decisively (and stays below it), then the next stop could be 23,000 or even 22,900. That's the danger zone — but that's not the most likely scenario for next week.

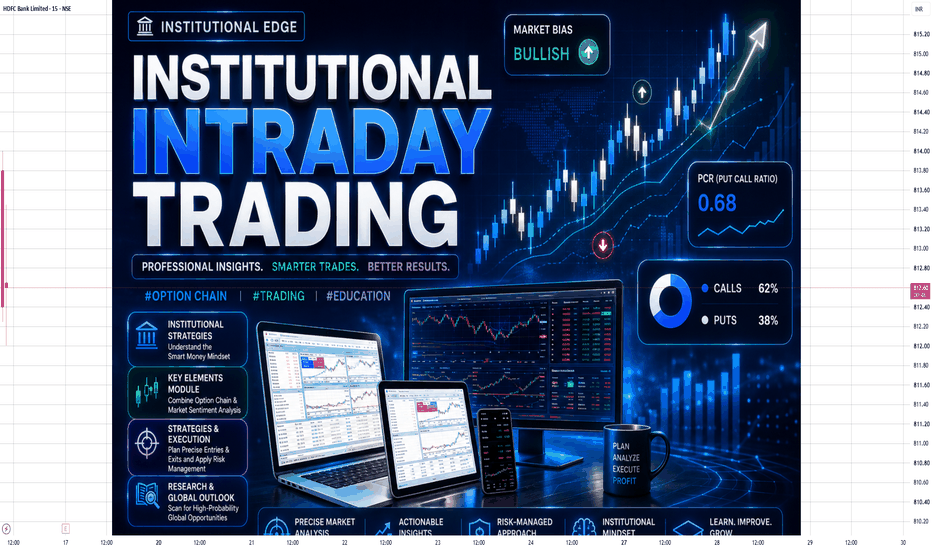
Intraday AnalysisOption Chain Analysis: Decoding Open Interest (OI) to find where the "Big Players" are positioned.
FII/DII Data: Understanding institutional activity and its impact on market direction.
Intraday Strategies: Scalping and swing setups using Price Action and key EMAs.
Global Market Cues: How GIFT Nifty and US Markets might influence our opening.
Trading Road Mapoptions trading and institutional trading are important parts of modern financial markets. Options trading offers flexibility and opportunities for profit, while institutional trading provides liquidity and stability to the market. However, beginners should learn market concepts carefully before entering options trading because losses can occur quickly without proper knowledge and risk management. Education, practice, and disciplined investing are essential for long-term success in trading.
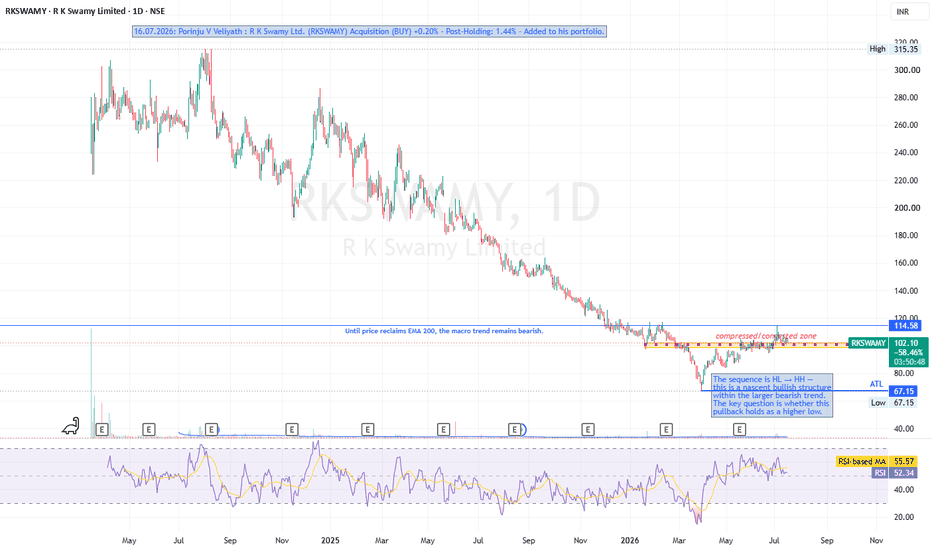
RKSWAMY: "Smart Money" Entry & Nascent Trend Reversal?Overview:
R K Swamy Limited (NSE: RKSWAMY) is presenting an incredibly compelling setup on the daily (1D) timeframe. After suffering a brutal macro downtrend that dragged the price from its highs above ₹300 down to an All-Time Low (ATL) of ₹67.15, the stock is finally showing signs of life. The most critical development is a massive fundamental catalyst: Ace investor Porinju V Veliyath recently acquired a stake, bringing his holding to 1.44%. This "smart money" accumulation often acts as a powerful tailwind for a technical turnaround.
Key Technical Observations:
Trend Structure (Macro vs. Micro): The macro trend remains undeniably bearish as long as the price trades below the 200 EMA. However, the micro-structure is shifting. The price has started printing a sequence of Higher Lows (HL) and Higher Highs (HH), creating a nascent bullish structure.
Compression Zone Resistance: The stock is currently facing stiff resistance at the ₹114.58 level. This area has turned into a compressed/congested zone. A decisive daily close above this level is required to confirm the next leg up.
Momentum (RSI): The Daily RSI is currently hovering around 52.62, sitting just below its RSI-based moving average (55.59). This neutral reading indicates that the recent pullback has successfully cooled off momentum, giving the stock room to breathe and build energy for a potential breakout attempt.
Key Levels to Watch:
Immediate Resistance: The ₹114.58 congestion zone. Reclaiming this is step one.
Macro Resistance: The 200 EMA (currently way above the price). Reclaiming this will definitively end the macro bear market.
Immediate Support: The current pullback zone (~₹100-₹102). It is crucial that this level holds to maintain the new Higher Low (HL) sequence.
Macro Support: The ATL at ₹67.15.
Directional Bias: CAUTIOUSLY BULLISH (Hold / Accumulate on Dips)
The convergence of a micro-trend reversal and high-profile institutional buying makes this a highly attractive risk-to-reward setup. The key question right now is whether the current pullback holds as a higher low.
For new entries: Look for accumulation near the ₹100 zone with a strict stop-loss below the recent structural higher low, or wait for a confirmed volume breakout above ₹114.58.
For existing positions: Hold and trail your stop loss to protect against a breakdown of the new bullish sequence.
Disclaimer: This analysis is for educational purposes only and does not constitute financial advice. Always manage your risk and position sizing carefully.
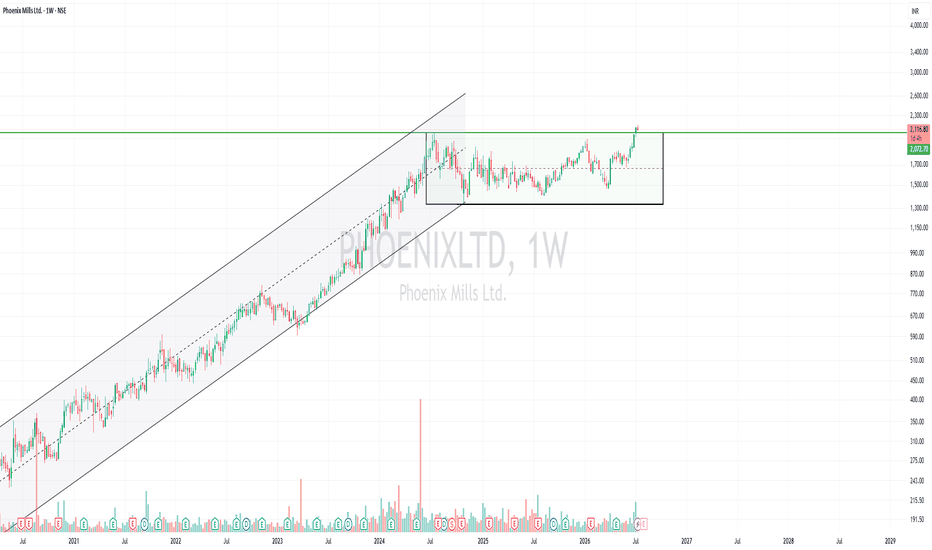
Phoenix Mills (PHOENIXLTD) – Stage 2 breakout and retest?Phoenix Mills (PHOENIXLTD)
Phoenix Mills belongs to the Real Estate / Realty sector (Retail-led commercial real estate, malls, offices, mixed-use developments). The realty sector has been showing improving relative strength, which adds a favorable sector tailwind.
Analysis
Stage 2 breakout appears to be underway after a prolonged consolidation.
The stock has broken out of a multi-month base and is now attempting a retest of the breakout zone, which is constructive if buyers continue to defend the breakout level.
Trading above all the key moving averages (50 DMA, 100 DMA and 200 DMA), confirming the primary uptrend remains intact.
Price structure continues to show higher highs and higher lows, a hallmark of a healthy Stage 2 trend.
The stock is slightly extended from the 50 DMA, so a pullback or period of consolidation would be completely normal. At current levels, the risk-to-reward may not be as attractive as it was during the base formation. Patience is often rewarded.
Fundamentals
The business continues to show strong operational momentum:
Sales (YoY):
FY25: ₹3,807 Cr
FY26: ₹4,423 Cr ▲
Profit After Tax (YoY):
FY25: ₹1,307 Cr
FY26: ₹1,557 Cr ▲
EPS (YoY):
FY25: ₹27.53
FY26: ₹34.22 ▲
Operating margins have also remained strong, with OPM improving to 60% in FY26.
The improving earnings profile supports the technical strength, but remember that price always leads fundamentals and markets can correct even when business performance remains excellent.
Points to Watch
Monitor whether the breakout level holds during the retest.
Watch for healthy volume on the next advance.
A sharp move away from the 50 DMA increases the probability of mean reversion.
Avoid chasing extended breakouts. Wait for your setup if the risk-to-reward isn't favorable.
Risk Management
Capital preservation comes first.
Always define your risk before entering a trade.
Never risk money you cannot afford to lose.
Even the strongest-looking setups fail. Position sizing and stop-loss discipline matter more than finding the "perfect" stock.
Disclaimer
This post is strictly for educational purposes to help traders learn technical analysis and market structure.
I am not a SEBI-registered research analyst or investment advisor. This is not a buy, sell, or investment recommendation. Please do your own due diligence before making any investment decisions.
One final thought: Don't blindly follow analysts, influencers, or social media posts—including this one. Learn to read charts, understand fundamentals, manage risk, and build your own process. Independent thinking and disciplined risk management are what help traders survive and improve over the long term.
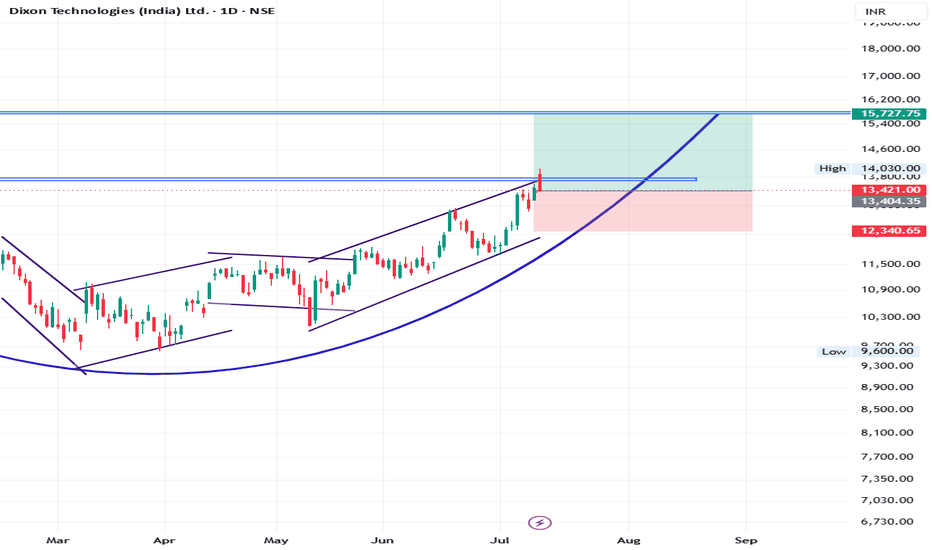
SWING Pick for 2 Months - DIXON - 18% upside possibility📈 SWING PICK: DIXON Technologies
Timeframe: 40–50 Days (1–2 Months)
We are tracking a strong swing setup on DIXON with a highly favorable risk-to-reward profile.
Current Market Price (CMP): ₹13,421
Target: ₹15,750+ (~18% potential upside)
Stop Loss (SL): ₹12,375 (~7.8% risk)
Risk-Reward Ratio: 1:2
Disclaimer: For educational purposes only. Please manage your risk accordingly. Happy Investing!
Leading/Ending Diagonal: Where #Triangles Can Secretly Form ...Most traders know that Leading Diagonals (LD) and Ending Diagonals (ED) consist of five overlapping waves.
However, one detail is often overlooked:
The corrective B-wave inside each motive leg can itself develop into a Triangle.
That's exactly what this chart illustrates.
What the chart shows
Each blue impulse leg (1), (2), (3), (4), and (5) is broken down into its internal A-B-C corrective structure.
Notice that:
Wave B of (1) can form a Triangle.
Wave B of (2) can form a Triangle.
Wave B of (3) can form a Triangle.
Wave B of (4) can form a Triangle.
Even Wave B of (5) can also form a Triangle before the final thrust.
These are highlighted throughout the chart.
Why is this important?
Many traders mistakenly assume that a Triangle automatically means the larger trend has ended.
In reality:
A Triangle inside the B-wave of an internal correction is perfectly valid and often appears during the development of a Leading or Ending Diagonal.
If you mislabel that Triangle as the completion of the entire pattern, you'll likely anticipate a reversal too early.
Practical takeaway
When you identify a Triangle, don't immediately ask:
"Is this the end of the trend?"
Instead ask:
"What degree is this Triangle?"
A Triangle inside an internal B-wave simply tells us:
The correction is consuming time.
One more C-wave of that correction is likely.
After the correction completes, the larger diagonal wave should continue.
Understanding the degree of the Triangle is far more important than simply recognizing its shape.
Key Learning :
✅ Triangles are not limited to Wave 4 or Wave B of higher-degree corrections.
They can also appear inside the internal B-wave of every leg of a Leading or Ending Diagonal.
Correctly identifying these internal Triangles can prevent premature entries and improve wave counting accuracy.
Educational Purpose Only
This post is intended to explain Elliott Wave structure and should not be considered trading or investment advice.
#ElliottWave #TradingEducation #LeadingDiagonal #EndingDiagonal #Triangle #WaveAnalysis #TechnicalAnalysis #PriceAction #TradingView #MarketStructure #NikhilKanal #ElliottWave
#ElliottWaveTheory #TradingEducation #TradingView #TechnicalAnalysis #WaveAnalysis #LeadingDiagonal #EndingDiagonal #TrianglePattern #ChartAnalysis #PriceAction #MarketStructure #MarketAnalysis #TradingPsychology #SmartMoney #StockMarket #StockMarketIndia #Nifty50 #NSEIndia #MCX #SwingTrading #PositionTrading #TrendFollowing #TradingStrategy #WaveCounting #ImpulseWave #CorrectiveWave #TradingCommunity #LearnTrading #TraderLife #FinancialEducation #Investing #TradingTips #ChartPatterns #TechnicalTrader #TradingMentor #MarketWisdom #TradingSkills #PriceStructure
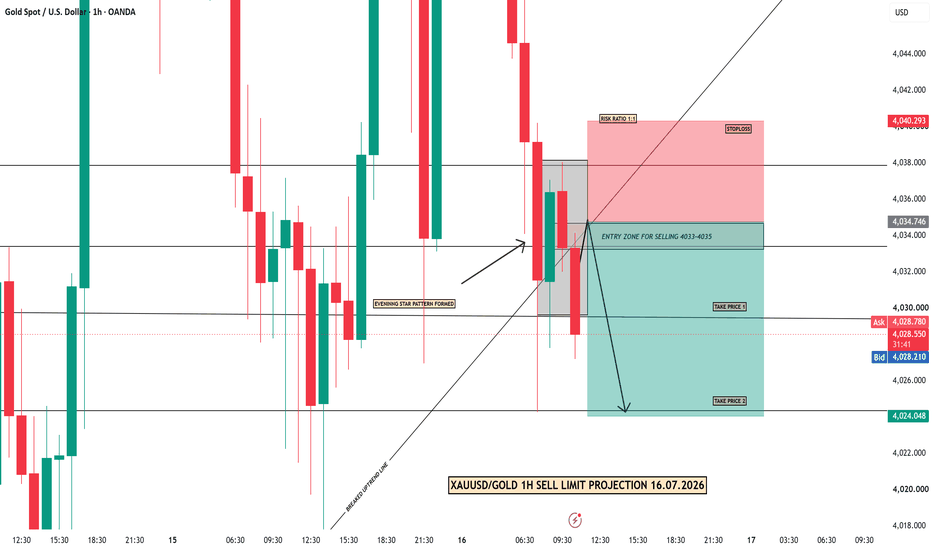
XAUUSD/GOLD 1H SELL LIMIT PROJECTION 16.07.26XAUUSD / GOLD – 1H Sell Limit Projection
Gold faced strong rejection near the 4038 resistance zone and formed an Evening Star pattern, indicating a possible bearish reversal. The previous uptrend line has also been broken, confirming weakening bullish momentum.
Sell Entry Zone: 4033–4035
Stop Loss: 4040.30
Take Profit 1: 4029–4030
Take Profit 2: 4024.05
The entry zone acts as a retest area after the trendline breakdown. TP1 offers approximately a 1:1 risk-to-reward ratio, while TP2 is the extended bearish target near the next major support.
A strong 1H candle close above 4040.30 would invalidate this bearish projection.
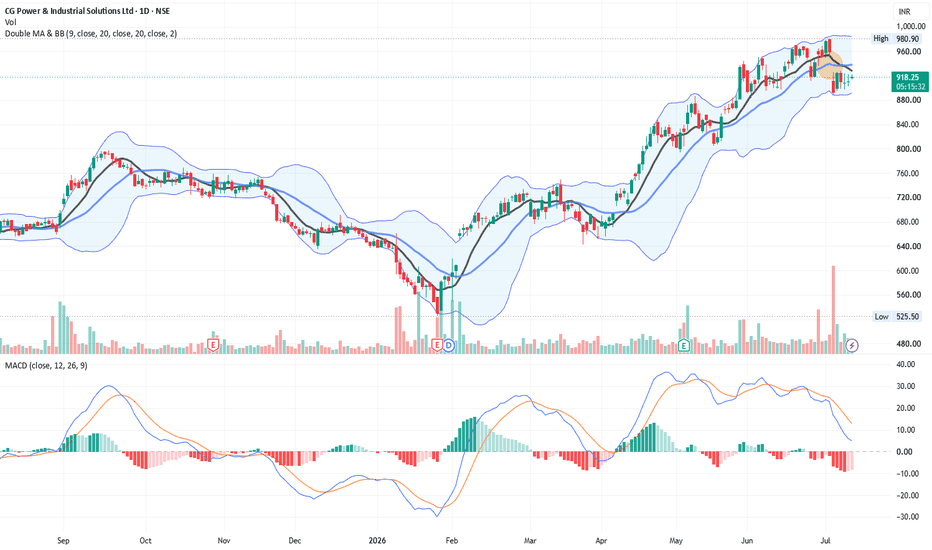
Keep An Eye - Gap Fill - CGPOWER📊 Script: CGPOWER
📊 Sector: Capital Goods
📊 Industry: Heavy Electrical Equipment
Key highlights: 💡⚡
📈 Keep an eye on stock it may fill gap, once the price is above 927.
BUY ONLY ABOVE 927
⏱️ C.M.P 📑💰- 918
🟢 Target 🎯🏆 - 950+
⚠️ Important: Always maintain your Risk & Reward Ratio.
✅Like and follow to never miss a new idea!✅
Disclaimer: I am not SEBI Registered Advisor. My posts are purely for training and educational purposes.
Eat🍜 Sleep😴 TradingView📈 Repeat 🔁
Happy learning with trading. Cheers!🥂
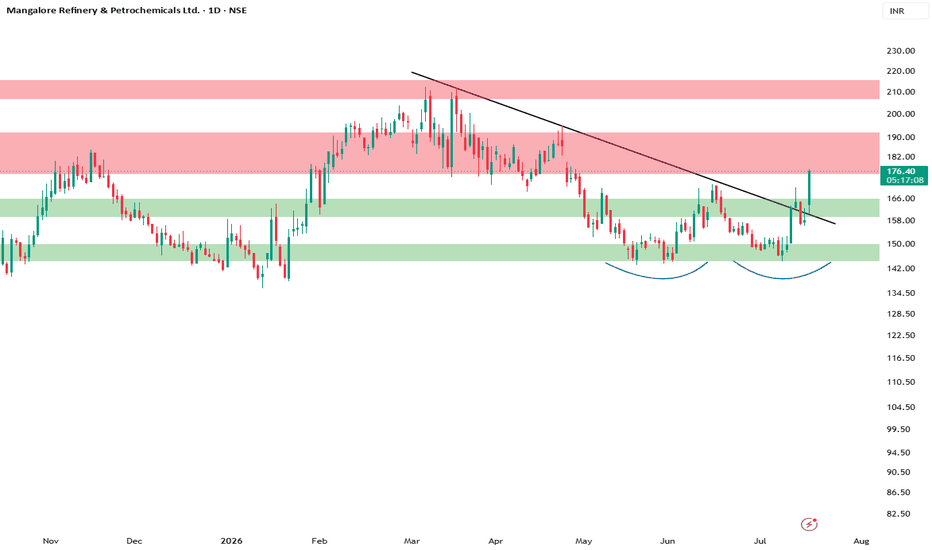
MRPL Breaks Long-Term Trendline – Bullish Structure EmergingMRPL has finally broken above its long-term descending trendline with strong bullish momentum, indicating a possible trend reversal. The stock is also forming a higher low structure, which adds strength to the breakout.
Key Levels:
Immediate Support: 165–166
Major Support: 158–160
Resistance 1: 188–190
Resistance 2: 208–212
As long as the price holds above 165–166, the breakout remains valid. A sustained move above 188–190 could open the way towards 208–212 in the coming sessions.
Traders should wait for confirmation and manage risk accordingly, as retests after a breakout are common.
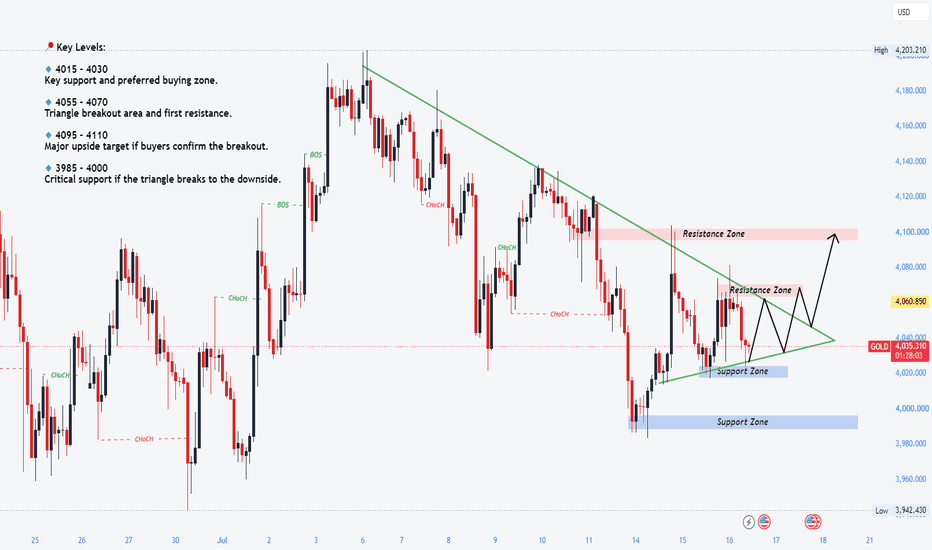
Gold triangle decision nears - bulls still hopefulGold continues to trade inside a tightening H2 symmetrical triangle, with both buyers and sellers gradually losing momentum. Price has tested the descending trendline several times without a confirmed breakout, while higher lows continue to form above the ascending support. This compression suggests volatility is decreasing, with a larger directional move likely once the range is broken.
From a technical perspective, the overall recovery scenario remains valid as long as price holds above the current support zone. However, the market still needs a decisive breakout above the triangle and nearby resistance to confirm bullish continuation. Until then, the preferred approach is to scalp within the range and prepare for a momentum trade once the breakout is confirmed.
📍 Key Levels:
🔹 4015 – 4030 Key support and preferred buying zone.
🔹 4055 – 4070 Triangle breakout area and first resistance.
🔹 4095 – 4110 Major upside target if buyers confirm the breakout.
🔹 3985 – 4000 Critical support if the triangle breaks to the downside.
✅ Preferred Scenario:
✔️ Gold continues respecting the triangle structure while holding above 4015–4030.
✔️ Intraday traders can continue scalping within the range until a confirmed breakout occurs.
✔️ A sustained move above 4055–4070 would validate bullish continuation and increase the probability of an extension toward 4095–4110.
✔️ If support fails and the triangle breaks lower, gold could revisit 3985–4000 before establishing a new direction.