Long
Long
### **45-Minute Chart Outlook ## **Market Overview**
Gold (XAU/USD) is currently trading around **4033**, consolidating after a strong recovery from the **3980 demand zone**. Price has entered a period of sideways movement following a bullish impulse, indicating that the market is waiting for a catalyst before its next directional move.
---
# **Trend Analysis**
### **Primary Trend (Higher Timeframes)**
* **4H:** Bearish
* **Daily:** Bearish
The higher-timeframe structure remains under pressure, suggesting that rallies may still encounter selling interest unless key resistance levels are decisively broken.
### **Intraday Trend**
* **45-Minute:** Bullish
* **5-Minute:** Bullish
* **15-Minute:** Bearish
This mixed alignment suggests a **short-term bullish correction within a broader bearish market**.
---
# **Market Structure**
### Bullish Observations
* Higher lows have formed since the rebound from **3980**.
* Price is holding above the dynamic support cloud.
* Buyers continue defending the **4020–4025** support region.
* Momentum has slowed rather than reversed, indicating accumulation rather than aggressive selling.
### Bearish Observations
* Overall market remains below previous swing highs.
* Major resistance is positioned near **4040–4060**.
* Daily and 4H bearish bias limits the probability of a sustained breakout without increased buying volume.
---
# **Key Price Levels**
### Support
* **4020–4025** (Immediate Support)
* **4000** (Psychological Level)
* **3980** (Major Swing Support)
### Resistance
* **4040** (Immediate Resistance)
* **4060** (First Upside Target)
* **4080–4100** (Major Supply Zone)
---
# **Momentum Assessment**
The recent consolidation reflects:
* Reduced selling pressure
* Stable buying activity
* Lower volatility before expansion
This behavior often precedes a breakout, making the next move important for confirming short-term direction.
---
# **Bullish Scenario**
A sustained move above **4040** would:
* Confirm continuation of the intraday uptrend.
* Open the path toward **4060**, followed by **4080**.
* Increase the probability of challenging the upper resistance zone.
**Bullish Target Sequence**
1. 4040
2. 4060
3. 4080
---
# **Bearish Scenario**
Failure to hold above **4020** would:
* Invalidate the current recovery.
* Shift momentum back toward sellers.
* Expose **4000**, followed by **3980**.
A break below **3980** would reinforce the higher-timeframe bearish trend.
---
# **Risk Assessment**
Current conditions suggest:
* Moderate volatility
* Mixed multi-timeframe signals
* Potential breakout after consolidation
Waiting for confirmation above resistance or below support may reduce the risk of entering during a range.
---
# **Professional Trading Bias**
**Short-Term Bias:** **Bullish** (intraday recovery)
**Medium-Term Bias:** **Neutral to Bearish**
**Long-Term Bias:** **Bearish**
---
# **Professional Conclusion**
The 45-minute chart shows that **XAU/USD is consolidating above key support after a recovery from the 3980 demand zone**. While intraday momentum remains constructive, the higher-timeframe trend is still bearish, meaning upside moves could face resistance around **4040–4060**. A confirmed breakout above **4040** would strengthen the bullish case toward **4060–4080**, whereas a breakdown below **4020** would likely shift momentum back to the downside, targeting **4000** and **3980**. Traders should monitor price action around these key levels for confirmation before committing to a directional trade.
 Long
Long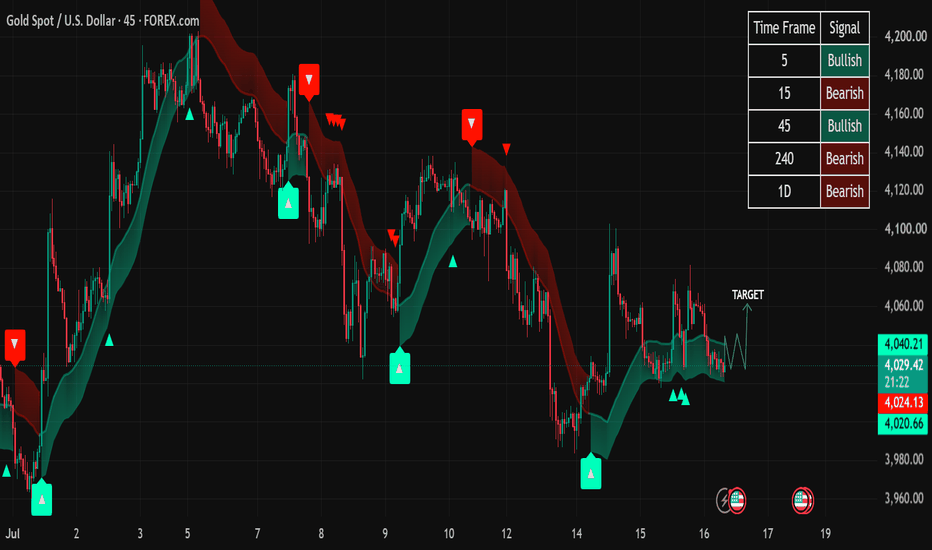
GOLD SELLING PRESSURE NEARBRIAN XAUUSD – GOLD UNDER SELL PRESSURE NEAR POC PIVOT
Gold is facing fresh supply on Thursday as energy-driven inflation concerns keep the market focused on the risk of a more hawkish Fed. At the same time, rising US-Iran tension is supporting safe-haven demand for the US dollar, adding pressure to XAUUSD during the session.
The macro backdrop is not friendly for gold right now. A stronger dollar, inflation risk from energy prices, and weak technical structure are keeping sellers active.
Technical structure
On the H1 chart, gold is trading below the recent Sell Reaction Zone around 4,055 - 4,058 after failing to hold higher value.
Price is now pressing into the POC Pivot Zone around 4,025 - 4,030. This is the current battlefield. If buyers cannot defend this zone, gold may continue rotating lower towards the Deep Demand Zone around 3,982 - 3,986.
The chart still shows bearish pressure. Every rebound is being rejected quickly, and price remains below the main volume resistance.
Important zones
Sell Reaction Zone: 4,055 - 4,058
Main short-term resistance where sellers may defend again.
POC Pivot Zone: 4,025 - 4,030
Current decision zone and key value area.
Deep Demand Zone: 3,982 - 3,986
Major lower support if sellers break the POC zone.
Highest peak of gold: 4,103
Upper reference level if buyers regain strength.
Trading scenario
Sell reaction from Sell Reaction Zone 4,055 - 4,058
Entry:
Look for sell positions only if price rebounds into 4,055 - 4,058 and shows clear rejection.
Stop Loss:
Above the Sell Reaction Zone or above the local rejection high.
Take Profit:
TP1: 4,025 - 4,030
TP2: 4,000
TP3: 3,982 - 3,986
This setup follows the current bearish structure and uses the upper Volume Profile resistance as the main sell area.
Final view
Gold is still under bearish pressure while price trades below the Sell Reaction Zone.
The key level now is 4,025 - 4,030. If this POC Pivot Zone holds, gold may attempt a small reaction. But if sellers break it cleanly, the next downside path opens towards 3,982 - 3,986.
For now, I prefer selling confirmed rebounds rather than buying early into pressure.
Trade the retest. Respect the volume zone. Short 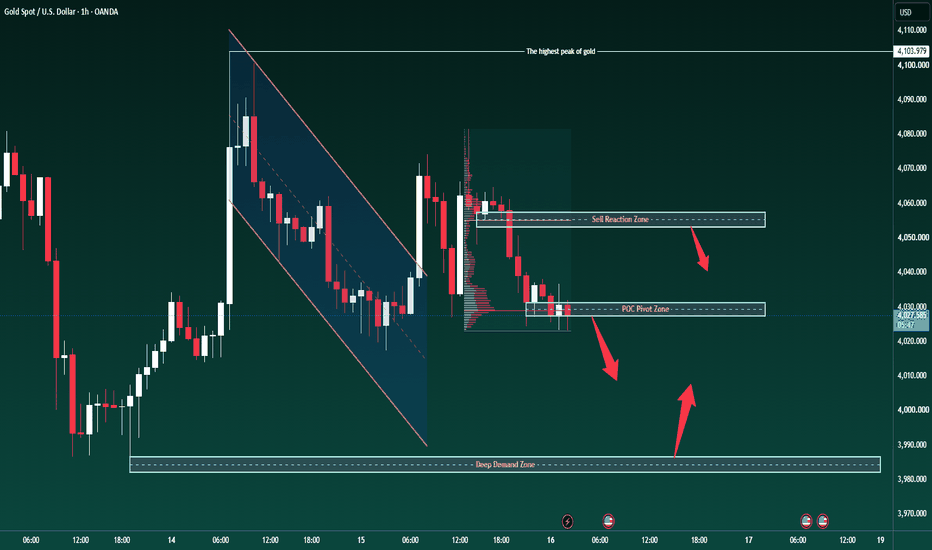
XAUUSD 4025 small OB — 4081 first draw XAUUSD 4025 small OB — 4081 first draw
That dip into 4,025 is the spot now.
Gold got sold again in Asia, pushed back near the prior low, and yeah, macro is still annoying for bulls. Weak CPI and PPI should help gold a bit, but oil staying high keeps Fed rate-hike talk alive. USD gets support from that. So the upside is not free.
But chart-wise?
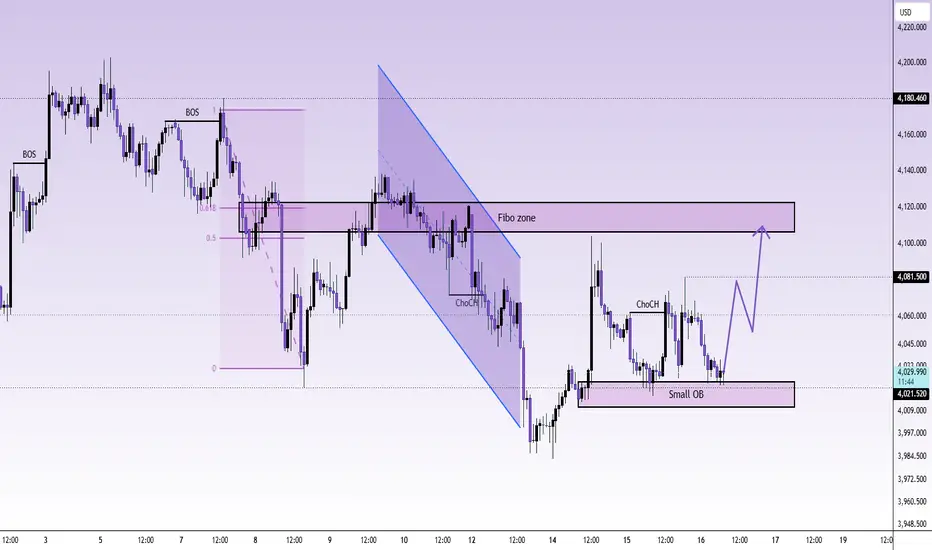
Price is sitting right on the small OB around 4,025 - 4,012. That is the little demand pocket. If this area holds, this can still be a trap against late sellers.
Look at the structure. Gold already printed a small ChoCH before. Then price pulled back into the OB instead of dumping clean through it. That matters. Sellers need to break this zone hard. If they can’t, buyers can squeeze price back toward 4,058 first.
The real test is 4,081. That is the next draw. Above 4,081, the bigger Fibo zone around 4,105 - 4,120 becomes the premium target. I would expect reaction there. Not chasing into it.
Main bias is bullish recovery while 4,012 holds.
Trading scenario:
Buy idea only if price holds the small OB around 4,025 - 4,012 and gives a clean reclaim above 4,034 - 4,046.
Entry zone: 4,012 - 4,025 after confirmation
Stop loss: below 3,995
TP1: 4,058
TP2: 4,081
TP3: 4,105 - 4,120
No hold inside the OB, no buy. Simple.
If gold closes hard below 4,012, this bounce idea is cooked. Then sellers can drag price back toward 3,982 and maybe 3,972.
For now, I’m watching if this small OB traps sellers again.
You buying the 4,025 reaction or waiting for 4,081 to break first?
Long 
Liquidity Sweep - Bullish and Bearish 📌 Overview
Liquidity Sweeps occur when price briefly moves beyond a significant support or resistance level, triggering stop-loss orders before reversing direction. This concept helps traders understand how liquidity is collected and why confirmation is important before making trading decisions.
___________________________________________________________
📘 Definition
A Liquidity Sweep is a temporary move beyond a key price level that is often followed by a reversal.
Bullish Liquidity Sweep : Price moves below support, sweeps liquidity, and then reverses upward.
Bearish Liquidity Sweep : Price moves above resistance, sweeps liquidity, and then reverses downward.
These movements can occur around important support and resistance zones.
___________________________________________________________
📌 Key Points
Liquidity often exists above resistance and below support.
A temporary break of a key level does not always indicate a true breakout.
Strong rejection after the sweep may indicate a shift in short-term momentum.
Waiting for confirmation can help avoid reacting to false breakouts.
Liquidity Sweeps are commonly analyzed together with market structure and price action.
___________________________________________________________
📊 Chart Explanation
Bullish Example
• Price approaches a support level.
• Price briefly moves below support, sweeping liquidity.
• Buyers regain control and price reverses higher.
Bearish Example
• Price approaches a resistance level.
• Price briefly moves above resistance, sweeping liquidity.
• Sellers regain control and price reverses lower.
The examples shown illustrate possible market behavior and are intended for educational purposes.
___________________________________________________________
📉 Summary
Liquidity Sweeps highlight areas where price may temporarily move beyond important levels before reversing. Understanding this concept may help traders better interpret market behavior and avoid confusing temporary liquidity grabs with confirmed breakouts.
___________________________________________________________
💡Why It Matters
• Helps identify potential false breakouts.
• Improves understanding of market liquidity.
• Encourages waiting for price confirmation instead of reacting immediately.
• Can be combined with support and resistance, trend analysis, and market structure for additional context.
___________________________________________________________
📌 Conclusion
Liquidity Sweeps are a widely discussed price action concept that illustrates how markets can temporarily move beyond key levels before changing direction. Like any technical concept, they should be used alongside confirmation and sound risk management rather than in isolation.
___________________________________________________________
⚠️ Disclaimer
📘 For educational purposes only.
🙅 Not SEBI registered.
❌ Not a buy/sell recommendation.
🧠 Purely a learning resource.
📊 Not Financial Advice Short 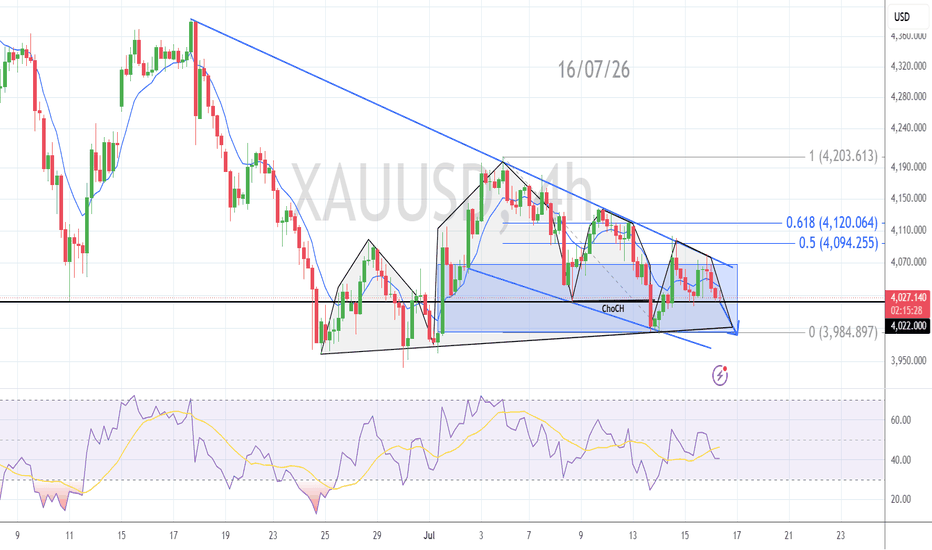
Short 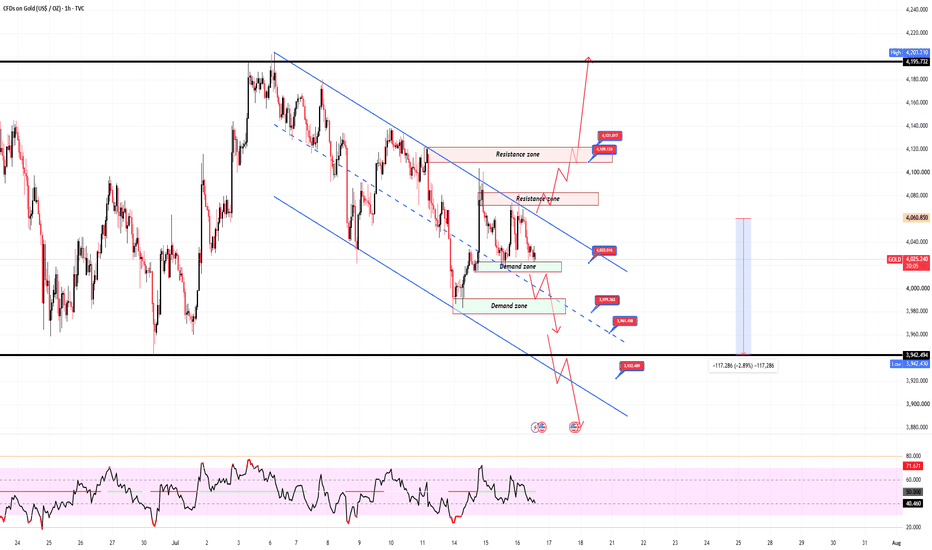
 Long
Long
 Long
Long
Chennai Petroleum Corporation Ltd🏆 Stock Setup of the Day | Chennai Petroleum Corporation Ltd. (NSE: CHENNPETRO)
📈 Timeframe: Weekly Chart
🚀 Multi-Year Breakout Near All-Time High Zone
Chennai Petroleum is displaying impressive relative strength after recovering from its 2025 lows. The stock is now consolidating just below a significant resistance area around ₹1,275, keeping the long-term uptrend intact.
🔹 Current Price: ₹1,260.50
🔹 Key Resistance: ₹1,275
🔹 Breakout Confirmation: Sustained weekly close above ₹1,275
🔹 Potential Target Zone: ₹2,100
🔹 Potential Upside: ~40%
📊 Technical View
✅ Strong long-term bullish structure with Higher Highs & Higher Lows
✅ Price is consolidating near resistance after a sustained rally—a healthy sign of strength
✅ Weekly trend remains positive with buyers maintaining control
✅ Volume expansion during the advance supports the bullish structure
👀 Key Levels to Watch
🟢 Support Zone: ₹1,180–₹1,220
🔵 Immediate Resistance: ₹1,275
🎯 Projected Target: ₹2,000–₹2,100
💡 Trading Perspective
A decisive breakout and weekly close above ₹1,275 could signal the next leg of the uptrend. Until then, watch for consolidation with improving volume, which often precedes strong directional moves.
⚠️ Disclaimer: This post is for educational and informational purposes only and should not be considered investment or trading advice. Please conduct your own research and follow proper risk management before taking any position.
🔥 Follow for daily high-probability breakout setups, trend analysis, and educational technical insights.  Long
Long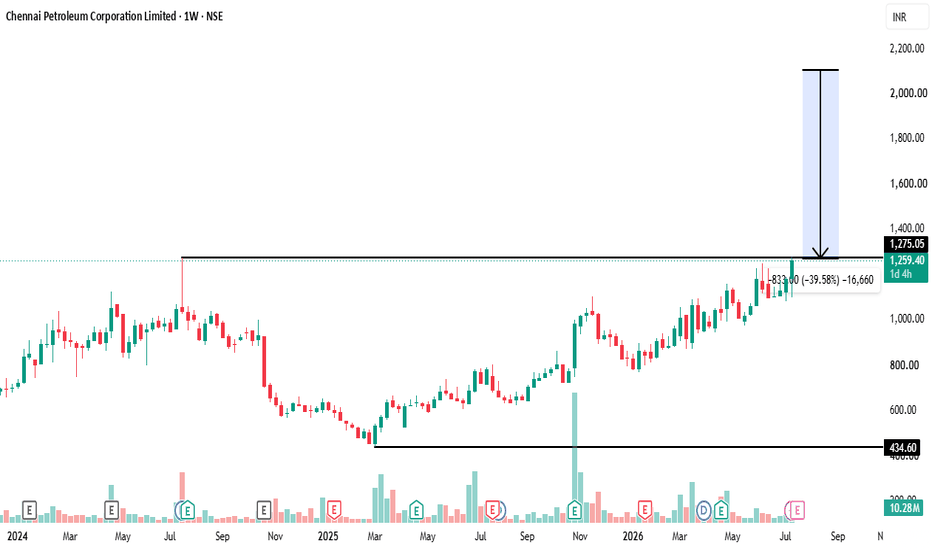

 Long
Long

Trading AnalysisWhere is Nifty right now?
Nifty closed at 23,689 on Thursday May 14. After a brutal fall earlier this week (it touched ~23,300), it bounced back for 2 days in a row. So right now it's in a recovery mood — but it hasn't really "fixed" itself yet. Think of it like someone who had a fever, now feeling slightly better, but not fully healthy.
2 What's the wall above? (Resistance)
If Nifty tries to go up next week, it will hit a wall around 23,500–23,600 first. That's the first test. If it somehow crosses that, the BIGGER wall is at 23,900–24,000 — where all the major moving averages (50-day & 200-day) are sitting. Lots of sellers will be waiting there to book profits. So going above 24,000 next week? Unlikely unless something very positive happens.
3 What's the floor below? (Support)
If Nifty starts falling, the first safety net is around 23,300–23,150. This zone has held multiple times recently. If it breaks this level decisively (and stays below it), then the next stop could be 23,000 or even 22,900. That's the danger zone — but that's not the most likely scenario for next week.



 Education

 Long
Long
 Long
Long