XAUUSD — Sell Pressure Below 4,300XAUUSD — Sell Pressure Below 4,300
Gold is still trading with a bearish intraday structure after failing to reclaim the upper liquidity zone. From Kelly’s view, the chart suggests that XAUUSD remains under selling pressure, and the current rebound is likely just a temporary pause before price continues lower.
The key idea is simple: as long as gold stays capped below the 4,290–4,300 sell zone, the market may continue rotating down toward the 4,254 support, then extend lower into the 4,235 area and possibly the final wave target near 4,160–4,170.
⟡ Market structure
Gold is currently trading around 4,290, right below the short-term liquidity sell zone. The recent price action keeps printing lower highs, which tells us that sellers still control the structure.
The area around 4,290–4,300 is important because it acts as immediate resistance. If price continues rejecting from this zone, the market may retest 4,254 first. A break below that support would likely expose the next reaction zone around 4,235–4,245.
From the Elliott Wave view, the chart still supports a bearish continuation. The current movement looks like a corrective wave before another downside leg develops. If sellers stay in control, the market may complete the next push lower toward the 4,160–4,170 target zone.
➤ Key levels
◌ Current price area: 4,290
◌ Sell zone liquidity: 4,288–4,300
◌ Intraday resistance: 4,300–4,310
◌ Strong support: 4,254
◌ Buy scalping wave 4 zone: 4,235–4,245
◌ Main bearish target: 4,160–4,170
◌ Bearish invalidation: above 4,310
⌁ Elliott Wave view
The chart shows a bearish Elliott Wave continuation structure.
Price is struggling below the sell liquidity zone, which may be the ceiling for the current recovery attempt.
If gold cannot break above 4,300, the next move may be a decline toward 4,254.
After that, a short rebound from the 4,235–4,245 wave 4 support zone may appear.
But if the broader bearish structure stays intact, the next selling leg could extend toward 4,160–4,170 to complete the downside wave sequence.
This is why Kelly is still prioritizing the bearish scenario while price remains below resistance.
▸ Trading scenario
Preferred bearish scenario
Entry: Sell around 4,288–4,300 if price shows bearish rejection
Stop Loss: Above 4,310
Take Profit 1: 4,254
Take Profit 2: 4,235–4,245
Take Profit 3: 4,160–4,170
Alternative scenario
If gold breaks above 4,300 and holds above that zone, short-term downside pressure may weaken. In that case, price could recover higher first before sellers return.
◌ Confirmation
Bearish confirmation comes if price continues rejecting below 4,300 and breaks down through 4,254.
◌ Invalidation
The bearish view becomes weaker if gold closes above 4,310 with strong momentum. That would suggest the market is no longer respecting the current sell zone.
⌁ Kelly’s view
Kelly’s main view remains bearish while gold stays below the 4,288–4,300 liquidity zone. The chart still favors selling rallies rather than chasing buys at the current level.
If sellers defend resistance, gold may continue lower toward 4,254, then 4,235–4,245. A deeper extension could later complete near 4,160–4,170.
Do you think gold will reject directly from this sell zone, or make one more small bounce before the next leg down?  Short
Short
 Short
Short
TCS: The Flag That Volume Almost RuinedTCS has been moving sideways for weeks now. Slow charts like this often get ignored. But a slow chart can still be telling a story — you just have to read it patiently. Here is what I am seeing.
The Big Move First
Back in July, TCS made a sharp low near 1,977 and then rallied fast, almost in a straight line, up to about 2,495. That rally was clean and steady — no big overlaps, just strong steps up. I am marking this move as wave A (or wave 1, if you prefer the impulsive count).
The Pause After That
Since early August, the stock has been drifting down in a slow, tilted channel. Notice how the candles overlap each other here — that is very different from the sharp, clean climb before it. Overlapping price action like this usually means the market is resting, not reversing the bigger trend. This looks like a flag — a pause after a strong pole, not a breakdown.
What Volume Is Saying
Volume has been shrinking through this pause. That is a good sign — it tells us sellers are not pushing hard, they are just taking profit. But the latest session broke that pattern. It printed the biggest volume of the whole pause, and yet the candle opened high and closed near its low. That is not the kind of volume you want to see just yet. It looks more like a test that got rejected than a breakout. So for now, this is a caution flag, not a green light.
Invalidation Level:
Every idea needs a level where it breaks. For this setup, that level is around 2,088. This is the 0.786 retracement of the July-August rally. As long as TCS holds above this zone, the flag idea stays alive. A close below 2,088 would mean this is no longer a simple pause — it would call for a fresh look at the chart, not a hope-and-hold approach.
What I Am Watching Next
I want to see two things before trusting this setup: price holding above the 2,088 zone, and a strong up move that comes with rising volume, not shrinking volume. Only then does the flag idea get real support. Until that shows up, this remains a wait-and-watch chart, not a chase-it chart.
Disclaimer:
I am not a SEBI registered research analyst. This post is shared only for education and learning purposes, based on my personal reading of the chart. It is not a buy or sell recommendation. Please do your own research or speak to a registered advisor before taking any trading decision.  Long
Long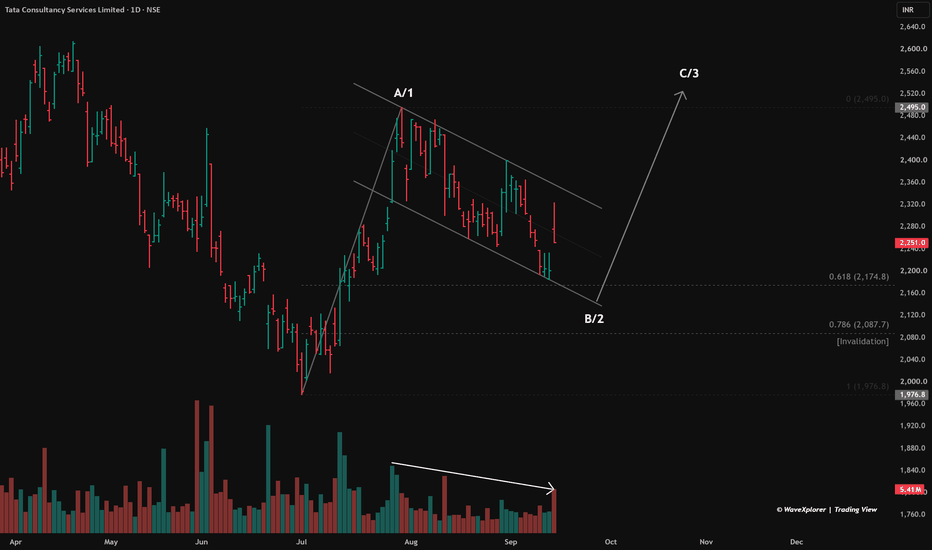
NIFTY — INTRADAY TRADING PLAN | 16-SEP-202615-Minute Chart • Price Action • Opening Scenarios
MARKET BIAS
NIFTY remains in a bearish structure with lower highs and lower lows. The immediate decision zone is 23,152–23,195 .
Primary Bias: Bearish / Sell on Rise
Bullish Shift: Sustained acceptance above 23,360
━━━━━━━━━━━━━━━━━━
KEY LEVELS & ACTION PLAN
23,443 — Major Resistance
Strong overhead supply zone.
• Rejection → Short setup after confirmation
• 15-min close above → Bullish breakout possibility
23,360 — Last Intraday Resistance
First major hurdle during any recovery.
• Rejection → Look for short
• Break + retest → Long toward 23,443
23,152–23,195 — Opening Resistance / Support Zone
KEY DECISION ZONE.
• Sustains above → Bullish intraday setup
• Rejection below → Bearish setup
23,037 — Last Intraday Support
• Hold + reversal → Bounce possible
• 15-min close below → Downside continuation
22,701–22,607 — Buyer’s Support / Consolidation Zone
Wait for selling exhaustion and bullish confirmation before considering longs.
━━━━━━━━━━━━━━━━━━
OPENING SCENARIOS
Using approximately 100 points as the gap reference:
GAP UP → Above ~23,272
Do not chase the gap.
• Sustains above opening → Long on confirmation
• Targets: 23,360 → 23,443
• Falls back below 23,195 → Gap-failure short setup
FLAT / NORMAL OPEN → ~23,072–23,272
Wait for reaction around 23,152–23,195 .
• Hold above → Long toward 23,360
• Reject below → Short toward 23,037
GAP DOWN → Below ~23,072
Do not short blindly at the open.
• Weak recovery + rejection → Short
• Breakdown below 23,037 → 22,701–22,607 becomes next major support
• Reclaim 23,152–23,195 → Avoid shorts; recovery can target 23,360
━━━━━━━━━━━━━━━━━━
EXECUTION RULE
Break → 15-min Close → Retest → Confirmation → Entry
Avoid trading the first 15–30 minutes impulsively, particularly after a large gap.
RISK MANAGEMENT
• Risk only a small portion of trading capital per trade.
• Prefer minimum 1:2 Risk/Reward .
• Maximum 2–3 quality trades; avoid overtrading.
• Never average a losing intraday position emotionally.
• Options traders should account for time decay and volatility.
• Protect capital first; profit comes second.
KEY LEVEL OF THE DAY:
23,152–23,195
The level is not the trade — the reaction at the level is the trade.
━━━━━━━━━━━━━━━━━━
DISCLAIMER
This post is for educational and informational purposes only . I am NOT a SEBI Registered Research Analyst or Investment Adviser . This is not investment advice or a recommendation to buy or sell any security.
Trading in stocks, futures and options involves substantial risk. Please conduct your own research and consult a SEBI-registered professional before making financial decisions.
Trade the setup. Manage the risk. Protect the capital.
 Long
Long
 Education
NSE:SBICARD – 670 to reclaim support?Trade Bias: Long
Time Horizon: Swing / Positional
Setup Type: At Low / Range Reclaim
1. Technical Perspective
Trend & Multi-Timeframe Structure: On the weekly chart of NSE:SBICARD , the ₹670.00–₹671.00 level served as a critical multi-year structural horizontal demand shelf marked by multiple historical pivot bounces. The subsequent breakdown beneath ₹670 down to the ₹560 level was swiftly met with strong accumulation wicks, forming a classic rounded liquidity trap (Bear Trap) and springing straight back above the breakdown pivot at ₹670.95.
Moving Averages: The aggressive weekly expansion is driving price back through short-term dynamic moving averages, with a higher-timeframe mean reversion trajectory pointing directly toward the overhead 50-week and 200-week EMAs clustered near ₹800–₹880.
Volume & Momentum: Weekly trading volume spiked to 2.78M shares during the reclaim candle, validating institutional absorption and short-covering at range lows while the RSI crosses up from deeply oversold levels.
2. The Trade Opportunity
Pattern / Structure: Textbook 2B Failed Breakdown / Liquidity Sweep reclaim of major multi-year horizontal support at ₹670.95.
Trigger Condition: Weekly candle close confirmed above ₹670.95 and holding the retest band between ₹665.00–₹675.00 on sustained buying volume.
3. Fundamental Perspective
Catalysts: Sequential stabilization in retail asset quality, gradual normalization in credit costs, and acceleration in festive discretionary card spending heading into Q3/Q4.
Valuation & Health: The stock trades at an attractive historical discount relative to its long-term average price-to-earnings multiples, providing a wide valuation margin of safety for a market-leading credit card franchise.
4. Sector & Market Context
Sector Index Alignment: The Nifty Financial Services index ($NSE:FINNIFTY) remains firmly supported within a structural uptrend, with sector capital rotating into beaten-down, high-quality consumer finance franchises.
Relative Strength: Following extended multi-month underperformance, NSE:SBICARD is showing pronounced bottoming divergence and early relative strength against broader lending peers.
5. Trade Execution (Levels & Risk Management)
Entry Zone: ₹665.00 – ₹675.00 (Current weekly confirmation/retest zone)
Stop Loss (SL): ₹644.25 (Below the immediate swing retest base; ~4.5% risk)
Take Profit 1 (TP1): ₹800.60 (Intermediate structural supply / prior swing pivot; ~18.6% upside)
Take Profit 2 (TP2): ₹903.70 (Primary overhead horizontal resistance shelf; ~33.9% upside)
Take Profit 3 (TP3): ₹927.35 – ₹929.55 (Extended range resistance boundary; ~37.7% upside)
Risk-to-Reward Ratio (R:R): 1:4.1 (to TP1) | 1:7.5 (to TP2)
 Long
Long
H2 Rebound Into POC Before Lower Liquidity
Fundamental Analysis
Gold is caught between two opposing forces. August U.S. CPI rose 0.4% MoM and 3.4% YoY, lifting expectations for a Fed rate hike next week to around 85%–87%. At the same time, renewed Middle East tensions continue to support safe-haven demand, keeping volatility elevated.
Technical Analysis
On H2, Gold remains inside a broader bearish structure after the recent CHoCH and BOS.
Price is now near 4,349, above the lower liquidity area. A corrective rebound could first develop toward the 4,420–4,450 POC zone, where previous structure and Volume Profile resistance overlap.
If sellers defend this area, the next bearish wave could target the 4,280–4,310 SSL.
Important Key Levels
4,601 — Major POI
4,510 — OB / Resistance
4,420–4,450 — POC / Sell Zone
4,280–4,310 — SSL / Main Liquidity
Trading Scenario
Sell priority remains on a rebound into 4,420–4,450 followed by bearish H2 confirmation.
Target: 4,280–4,310 SSL.
Invalidation: H2 acceptance above the POC zone and continued bullish structure.
Overall View
The H2 bias remains bearish, but price is already near lower levels. The cleaner setup is to wait for a corrective rebound into the POC before looking for the next move toward SSL.
Will Gold retest 4,440 before sweeping the liquidity below 4,300? Short 
 Long
Long
 Long
Long
BTC/USD – 15-Minute Technical AnalysisBitcoin is currently showing a potential Head & Shoulders formation on the 15-minute chart.
🔹 Pattern: Head & Shoulders
🔹 Left Shoulder: ~77,600
🔹 Head: ~79,500
🔹 Right Shoulder: ~77,200
🔹 Neckline / Key Support: ~76,600–76,700
The price has already rejected from the right-shoulder area and is now trading below the key neckline zone, which keeps the bearish setup active.
🎯 Downside Levels
If the neckline fails decisively, the next important levels are:
76,100 → 75,600 → 74,600 → 74,570
A sustained move below the neckline could accelerate the downside momentum.
⚠️ Invalidation
A strong 15-minute close back above 77,250–77,300 would weaken the bearish Head & Shoulders setup and could trigger a recovery toward higher levels.
Bias: BEARISH below 77,250–77,300
Key Level: 76,600–76,700
This is a technical analysis setup, not financial advice. Always manage risk and wait for confirmation.
#Bitcoin #BTC #BTCUSD #Crypto #BitcoinAnalysis #TechnicalAnalysis #HeadAndShoulders #Trading #CryptoTrading #PriceAction #BTCUSDT  Short
Short
 Long
Long
XAUUSD: FOMC May Decide the 4,255 Break XAUUSD: FOMC May Decide the 4,255 Break
Market Context
Gold remains under pressure near multi-week lows as traders wait for the key two-day FOMC policy meeting.
The market is not giving buyers much confidence here. Higher Fed rate expectations, inflation concerns, firm Treasury yields, and geopolitical risk are still supporting the US Dollar. That keeps gold limited, especially because gold does not offer yield and usually struggles when the USD and yields stay strong.
The important point is this: gold is not just moving sideways. It is still trading inside a descending structure, and every recovery attempt remains weak until buyers reclaim the key resistance zones above.
Technical Structure
Gold is currently trading around 4,290 after failing to build a meaningful recovery above 4,300.
The chart still shows a clear bearish channel. Price continues to form lower highs, and the latest rebound is still trapped below the descending trendline. This tells us that sellers are still controlling the structure.
The nearest key area is 4,255 - 4,285. This is the current liquidity and decision zone. If gold holds this area, a short-term recovery may appear before FOMC volatility expands. But if 4,255 breaks cleanly, sellers may push price deeper toward 4,220 and 4,200.
Above current price, 4,365 - 4,400 is the nearest resistance zone. This area overlaps with the LTF Bearish OB, making it an important sell reaction zone if gold rebounds.
Higher up, 4,410 - 4,440 remains the bearish mitigation zone and internal liquidity area. As long as gold trades below this structure, any recovery can still be treated as corrective.
Key Levels
Current Price: 4,290
Key Liquidity / Decision Zone: 4,255 - 4,285
Immediate Downside Target: 4,220 - 4,200
Nearest Resistance: 4,365 - 4,400
Bearish Mitigation Zone: 4,410 - 4,440
Buy-Side Liquidity / Supply: 4,465 - 4,490
HTF Bearish OB / Major Premium POI: 4,590 - 4,620
Bullish Recovery: Above 4,400
Bearish Continuation: Below 4,255
Trading Plan
Primary Sell Scenario
Entry: 4,365 - 4,400 after bearish confirmation
SL: Above 4,425
TP: 4,300 / 4,285 / 4,255
Condition: Price rebounds into the LTF Bearish OB but fails to break above the descending structure. A rejection from this zone would keep sellers in control.
Breakdown Sell Scenario
Entry: Below 4,255 after breakdown and retest
SL: Above 4,285
TP: 4,220 / 4,200 / 4,180
Condition: Gold loses the key decision zone and fails to reclaim it. This would confirm stronger downside continuation, especially if FOMC strengthens the USD further.
Buy Reaction Scenario
Entry: 4,255 - 4,285 after strong bullish confirmation
SL: Below 4,230
TP: 4,320 / 4,365 / 4,400
Condition: Buyers must show a clean reaction from the liquidity zone. This is only a short-term recovery setup, not a full bullish reversal unless gold reclaims 4,400 with strength.
Bullish Recovery Scenario
Entry: Above 4,400 after breakout and retest
SL: Below 4,365
TP: 4,440 / 4,465 / 4,490
Condition: Gold must break above the LTF Bearish OB and hold above 4,400. Only then does the short-term bearish pressure begin to weaken.
Overall Bias
Gold remains bearish while price stays below 4,365 - 4,400.
The current market is sitting near a dangerous decision zone. Buyers may try to defend 4,255 - 4,285, but the structure still belongs to sellers until gold breaks back above 4,400.
If 4,255 breaks, the next downside leg may open toward 4,220 and 4,200. If buyers defend the zone, a corrective rebound toward 4,365 - 4,400 is possible, but that area may still attract sellers again.
Best approach: do not chase price before FOMC. Wait for either a confirmed reaction from 4,255 - 4,285 or a clear rejection from 4,365 - 4,400.
Will gold defend 4,255 before the Fed decision, or will sellers break the floor and extend the decline?
Long 
Long 
BRIAN XAUUSD – GOLD WEAK BELOW 4,338 BRIAN XAUUSD – GOLD WEAK BELOW 4,338
Gold remains under pressure as the market moves into the FOMC decision window.
Price is now trading around 4,275 after another failed recovery attempt, while the broader short-term structure continues to show lower highs and weak buyer follow-through. Fundamentally, the market is still cautious. Gold is marking another down day as traders wait for the two-day FOMC policy meeting, and this keeps positioning defensive ahead of the rate decision.
When gold trades near a one-month low before a major Fed event, the market usually becomes very sensitive to any rejection or breakdown around key value zones. That is exactly what the current chart is showing.
Technical structure
On the H1 chart, gold is trading below the Current VAH / POC immediate volume zone around 4,290 - 4,306.
This zone is important because it was the latest short-term value area. Price tried to stabilize there, but the reaction was weak. As long as gold stays below this zone, buyers do not have real control.
The next important resistance is the Key Rotation Area around 4,338 - 4,365. This is the area where any recovery may face stronger selling pressure. If gold pulls back into this zone and rejects, the bearish continuation view remains valid.
Above that, the Upper Value Rejection zone around 4,500 remains the major seller interest area. This was where the larger bearish rotation started, and it continues to define the upper structure.
On the downside, gold is now approaching the 4,232 area. If sellers keep control below 4,306, the market can rotate lower into this level before any stronger buyer reaction appears.
Important zones
Current price area: 4,265 - 4,280
Gold is trading near the lower part of the structure after losing short-term value.
Current VAH / POC: 4,290 - 4,306
Immediate resistance. Buyers need to reclaim this area to slow the bearish pressure.
Key Rotation Area: 4,338 - 4,365
Main reaction zone if gold attempts a deeper pullback.
Strong Acceptance Zone: 4,290 - 4,310
Previous value support, now acting as a pressure area after the breakdown.
Upper Value Rejection: 4,490 - 4,510
Major seller interest zone and higher resistance.
Downside liquidity: 4,232 - 4,240
Next lower target if sellers continue pushing the auction lower.
Trading scenario
Priority view: sell on recovery below 4,306
Entry:
Look for sell positions only if gold rebounds into 4,290 - 4,306 or higher into 4,338 - 4,365 and shows clear bearish rejection.
Stop Loss:
Above the rejection high or above the reclaimed value zone.
Take Profit:
TP1: 4,250
TP2: 4,232 - 4,240
TP3: 4,200 if FOMC-driven momentum supports another downside expansion
This setup follows the current bearish structure. Gold has already lost short-term value, so chasing sell late near the low is not ideal. The cleaner plan is to wait for a retest and rejection from resistance.
Alternative buy scenario
A buy setup is only interesting if gold sweeps the 4,232 - 4,240 liquidity area and shows strong bullish rejection.
Entry:
Buy only after clear confirmation from the lower liquidity zone.
Stop Loss:
Below the local sweep low.
Take Profit:
TP1: 4,290 - 4,306
TP2: 4,338
TP3: 4,365 if buyers reclaim momentum
This would only be a reaction-buy setup, not a full bullish reversal yet. For a stronger recovery, gold needs to reclaim 4,306 first, then hold above 4,338.
Final view
Gold is still under seller control while trading below 4,306.
The market is heading into the FOMC meeting with weak momentum, and the current chart suggests that sellers are still defending every recovery attempt. The nearest downside area to watch is 4,232 - 4,240. If price reaches this zone, buyer reaction may appear, but confirmation is needed before considering any long setup.
For now, my map is simple:
Below 4,306 = sellers keep control.
Reject 4,306 = downside pressure continues.
Break 4,338 = recovery improves.
Reject 4,338 - 4,365 = bearish structure remains valid.
Lose 4,232 = downside can extend toward 4,200.
Gold is not in a clean bullish position yet. The best approach is patience: wait for either a confirmed rejection from resistance or a strong reaction from the lower liquidity zone.
Will gold defend 4,232 before the FOMC decision, or will sellers force one more deep flush first?
Long