 Long
Long
 Long
Long
GRCL: The V-Shaped Recovery and Explosive Vertical Breakout1. The Macro Perspective: The Deep Washout and Capitulation
I am taking a LONG bias on Gayatri Rubbers & Chemicals Ltd. (GRCL) on the weekly (1W) timeframe.
When analyzing pure market structure, the speed of a recovery tells you everything you need to know about institutional intent. Look at the structural development on this chart. The stock suffered a brutal, highly volatile markdown phase that dragged the price all the way down toward the 300 level. This deep correction successfully washed out all weak hands and forced mass capitulation. However, instead of bleeding into a permanent bear market, the stock found an absolute concrete floor.
2. The Educational Setup: The V-Shaped Right Side
To understand the sheer strength of this current breakout, look at how the price behaved on the right side of the curve:
No Pauses: In a standard "Cup and Handle" pattern, the stock rallies to the neckline, gets rejected, and chops sideways for weeks to build a handle. Notice how GRCL completely ignored that playbook.
Institutional Urgency: The stock formed a highly aggressive V-shaped recovery. Buyers were stepping in with such sheer force and urgency that they refused to let the stock breathe or consolidate. They powered straight through the dashed 457.20 mid-level pivot and marched directly up to the ultimate historical ceiling at 520.45.
3. Current Price Action: Blue Sky Territory
Look at the most recent weekly candle on the far right. The momentum is absolutely parabolic. Buyers have effortlessly shattered the solid black 520.45 macro ceiling with a massive, near-vertical momentum thrust, pushing the price straight toward the 600 century mark. By decisively clearing this massive historical accumulation zone without even pausing to build a handle, GRCL has officially entered "Blue Sky Territory" (pure price discovery). Historical overhead supply has been completely eliminated.
4. The Trade Plan: Entries, Targets, and Risk Management
Entry Strategy: Momentum is at extreme levels right now near 587.65. Chasing a massive, vertical expansion candle on the weekly timeframe carries a severe risk of an agonizing intraday or daily drawdown as the stock naturally breathes after such an explosive run. Do not buy the absolute top of a green expansion candle. The highest-probability, lowest-risk entry involves stepping down to a daily or hourly timeframe and waiting for the dust to settle. Look to place limit orders to catch a potential structural pullback or consolidation flag to retest the 520.00 to 540.00 breakout zone. Letting that heavy historical resistance prove itself as a new, indestructible support floor offers a phenomenal risk-to-reward ratio.
Take Profit (Targets): Because the stock is in pure price discovery, we use measured structural targets based on the depth of the macro base. By taking the depth of the massive washout (roughly 220 points from the ~300 floor up to the 520.45 ceiling) and projecting it upward from the breakout line, our primary structural macro target sits comfortably in the 730.00 to 740.00 zone. Immediate psychological milestones are 600.00 and 650.00.
Invalidation (Stop Loss): A momentum trade thesis is only valid if the velocity holds or converts into a high-level base. A hard stop loss should be placed safely below the breakout line and the mid-level structure, around the 480.00 to 500.00 level. A definitive weekly close completely back inside the old base and below the 457.20 pivot would act as a massive warning sign of a failed macro breakout and severe bull trap.
5. Time Horizon:
Because this technical setup is built on a 1-Week chart capturing a massive V-shaped recovery into fresh price discovery, this is a medium-to-longer-term position trade designed to capture the explosive markup phase. Let the new trend run!  Long
Long
XAUUSD 1H – Market Analysis (Sep 15, 2026)XAUUSD 1H – Market Analysis (Sep 15, 2026)
Market Structure: Mixed — Macro Bearish, Micro Reversal Attempt
Since the 4,540 high (~Sep 20) and the failed retest of the Supply Zone near Sep 4, price has printed a clear sequence of lower highs and lower lows (4,500 → 4,420 equal-high → 4,340 BOS → 4,290 BOS). That's structurally bearish on this timeframe. However, the most recent leg shows a liquidity sweep below the last swing low followed by a reaction higher into your OTE/POI zone — the early signature of a potential CHoCH, not yet confirmed.
Key Support & Resistance
Resistance: Un-Meg-Supply / Equal-High 4,400–4,420, then Supply Zone 4,460–4,500
Support: OTE/POI 4,330–4,350, key level 4,308–4,320 (price is sitting on this right now), Demand Zone 4,230–4,265
Liquidity Zones
Buy-side liquidity resting above the 4,420 equal-high and above the 4,500–4,540 supply highs
Sell-side liquidity below the swept low near 4,280–4,290 and below the deep Demand Zone at 4,230
BOS / CHoCH / OB / Sweeps (as marked)
BOS down through ~4,340 → continuation lower
CHoCH attempt near the 4,420 equal-high that failed to hold — trapped breakout buyers inducement.
Second BOS down near 4,290, sweeping resting sell-side liquidity below the prior low
Current OTE/POI (4,330–4,350) is the discount zone from which the reaction higher is developing
Best Entries
Buy: 4,312–4,320, reacting off the current key level / lower edge of the OTE zone, ideally with a bullish LTF confirmation candle
Sell: 4,400–4,420 (Un-Meg-Supply/Equal-High) on a clear bearish rejection
Stop Loss & Targets
(using standard gold convention: 1 pip ≈ $0.10, so 100 pips ≈ $10 — note this is a tight stop for gold's normal volatility, so treat it as a scalp/LTF-confirmed entry, not a wide swing stop)
Buy:
SL: 4,305 (~100 pips)
TP1: 4,350 → RR ≈ 3.5:1
TP2: 4,400 → RR ≈ 8.5:1
TP3: 4,460 → RR ≈ 14.5:1
Sell:
SL: 4,420 (~100 pips)
TP1: 4,350 → RR ≈ 6:1
TP2: 4,315 → RR ≈ 9.5:1
TP3: 4,260 → RR ≈ 15:1
Bullish / Bearish Probability
Short-term reaction: ~55% bullish (sweep + reaction into OTE), but macro structure since Sep 4 is still ~45–55% bearish until price closes back above the 4,420 equal-high. This is genuinely a decision-zone chart — it can go either way depending on how price reacts around 4,308–4,350.
Retail Trap Areas
4,400–4,420 (Un-Meg-Supply/Equal-High) — the marked "Inducement" already caught late breakout buyers once
The 4,280–4,290 sweep — classic stop-hunt of early breakout sellers before the bounce
Current 4,308–4,320 chop — likely to fake out traders on both sides before the real directional move
Beginner-Friendly Explanation
Price rallied hard, got rejected at a supply zone, and has been grinding lower since — like a staircase heading down. Along the way it broke a few short-term "floors" (BOS), tricked buyers at one point (CHoCH/inducement), and just recently dipped below an old low to grab stop-losses before bouncing. Right now price is sitting exactly on an important line in the sand (4,308). If buyers hold this line, the bounce can extend toward the next resistance zones. If sellers break it, the next real support is much lower, near 4,230–4,265.
Final Verdict: WAIT
Confidence: ~55% (moderate — this is a genuine decision point, not a high-conviction setup)
Wait for either a confirmed close above 4,350 (favors the buy toward Un-Meg-Supply) or a confirmed close below 4,300/4,290 (favors the sell toward the Demand Zone) before committing size.
If price stays above 4,308, my bias remains bullish; if price closes below it, my bias flips bearish.
SENORES: The Structural Staircase and Explosive High-Level Break1. The Macro Perspective: The Deep Washout and the Climb
I am taking a LONG bias on Senores Pharmaceuticals Ltd. (SENORES) on the daily (1D) timeframe.
When analyzing pure market structure, the healthiest and most sustainable trends climb stairs. Look at the massive structural development on the left side of this chart. After suffering a deep, volatile markdown phase that dragged the price into the high 600s, the stock successfully washed out all weak hands. Institutional capital then stepped in, initiating a methodical, multi-month recovery. The stock systematically absorbed overhead supply, carving out a massive primary base and aggressively marching back to challenge the historical macro ceiling at the solid black 870.90 line.
2. The Educational Setup: Conquering the Stepping Stones
To understand the sheer strength of this current breakout, look at how the price behaved after it finally conquered that 870.90 macro ceiling:
Flipping the Script: Once the price broke above 870.90 (and the dashed 885.20 pivot), it didn't suffer a "bull trap" rejection. Instead, buyers ruthlessly defended that old resistance zone, locking in the gains.
The High-Level Base: Notice what happened next. Using the massive momentum from the breakout, the stock established a brand-new, high-level support floor at the solid black 929.90 line. Consolidating tightly directly above a prior major breakout zone forms a textbook "Step-Up Base" or "High-Level Flag." This acts like a pressure cooker, gracefully transferring shares from impatient retail traders taking quick profits over to strong-handed institutional buyers, storing immense kinetic energy for the next leg higher.
3. Current Price Action: Blue Sky Territory
Look at the most recent daily candles on the far right. The high-level pressure cooker has exploded. Buyers have aggressively defended the 929.90 floor, printing massive green expansion candles and pushing the price straight toward the 980 zone. By decisively launching out of this high-level accumulation step, SENORES has officially entered "Blue Sky Territory" (pure price discovery). Historical overhead supply in this region has been entirely eliminated.
4. The Trade Plan: Entries, Targets, and Risk Management
Entry Strategy: Momentum is exceptionally strong right now near 973.75. Chasing a near-vertical daily expansion candle always carries a higher risk of an immediate intraday drawdown as the stock naturally breathes. The highest-probability, lowest-risk entry involves placing limit orders to catch a potential minor structural pullback to retest the high-level base floor in the 930.00 to 945.00 zone. Letting that new structural floor prove itself as indestructible support offers a phenomenal risk-to-reward ratio.
Take Profit (Targets): Because the stock is in pure price discovery, we use measured structural targets and psychological magnets. By taking the depth of the macro recovery (roughly 200 points from the ~680 floor to the 870.90 ceiling) and projecting it upward from the recent breakout, our primary structural macro target sits beautifully in the 1,070.00 to 1,100.00 zone. The immediate, massive psychological milestone is the 1,000.00 century mark.
Invalidation (Stop Loss): A trade thesis is only valid if the new market structure holds. A hard stop loss should be placed safely below the 929.90 step-up base and the recent dashed pivot, around the 880.00 to 890.00 level. A definitive daily close completely back below the foundational 870.90 line would act as a massive warning sign of a failed structural breakout and a severe bull trap.
5. Time Horizon:
Because this technical setup is built on a 1-Day chart capturing a Step-Up Base completion into fresh price discovery, this is a short-to-medium-term swing trade designed to capture the explosive markup phase toward the 1,000 mark and beyond. Let the new trend run!  Long
Long
WPIL: Massive Box Accumulation and Explosive Volume Breakout1. The Micro Perspective: The Washing Machine
I am taking a LONG bias on WPIL Limited (WPIL) on the daily (1D) timeframe.
When analyzing pure market structure, some of the most violent and profitable momentum thrusts originate from prolonged periods of sideways consolidation. Look at the structural development perfectly highlighted by the shaded box on this chart. For weeks, the stock was trapped in a highly volatile horizontal channel. Sellers repeatedly defended the box ceiling near the 444.00 level, while buyers aggressively defended the concrete floor near 408.00. This sideways, choppy action is the ultimate "washing machine"—it frustrates impatient retail traders into selling, allowing heavy institutional capital to quietly absorb shares without driving the price up prematurely.
2. The Educational Setup: The Horizontal Pressure Cooker
To understand the sheer strength of this current breakout, look at the mechanics of the box:
The Squeeze: By trapping the price in a strictly defined range, the stock acts like a pressure cooker. Moving averages catch up, indicators reset, and kinetic energy is stored.
The Institutional Footprint: Look at the volume profile at the bottom of the chart during the sideways chop. The volume was generally low and flat. Institutions were hiding their footprints, quietly accumulating.
3. Current Price Action: The Lid Blows Off
Look at the most recent daily candle on the far right, accompanied by a massive, undeniable surge in buying volume that dwarfs the previous weeks of trading. The pressure cooker has absolutely exploded. Buyers have effortlessly shattered the box ceiling, printing an enormous green expansion candle. While there is a noticeable upper wick (indicating some natural intraday profit-taking after such a violent vertical run), the sheer volume confirms that heavy capital has officially forced this stock out of accumulation and into a brand-new markup phase.
4. The Trade Plan: Entries, Targets, and Risk Management
Entry Strategy: Momentum is at extreme levels right now near 456.90. Chasing a massive, near-vertical daily expansion candle always carries a higher risk of an immediate intraday or daily drawdown as the stock naturally breathes and digests the volume spike. The highest-probability, lowest-risk entry involves stepping down to an hourly timeframe and placing limit orders to catch a potential minor structural pullback to perfectly retest the top of the box in the 440.00 to 445.00 zone. Letting that old heavy box resistance prove itself as a new, indestructible support floor offers a phenomenal risk-to-reward ratio.
Take Profit (Targets): We use measured structural targets based on the depth of the consolidation box. By taking the depth of the box (roughly 36 points from the 408 floor to the 444 ceiling) and projecting it upward from the breakout line, our primary structural target sits perfectly in the 480.00 zone. The ultimate psychological milestone and momentum magnet is the 500.00 century mark.
Invalidation (Stop Loss): A box breakout thesis is only valid if the stock refuses to fall back into the trap. A hard stop loss should be placed safely below the top quarter of the box and the recent breakout volume, around the 425.00 to 430.00 level. A definitive daily close completely back inside the lower half of the box (below 425) would act as a massive warning sign of a failed breakout and a severe bull trap.
5. Time Horizon:
Because this technical setup is built on a 1-Day chart capturing an explosive volume breakout from a tight consolidation box, this is a short-to-medium-term swing trade designed to capture the violent momentum thrust. Let the new trend run!  Long
Long
PRIMECAB: Massive Rounding Bottom and Explosive Structural Break1. The Macro Perspective: The Deep Washout and the Concrete Floor
I am taking a LONG bias on Prime Cable Industries Limited (PRIMECAB) on the daily (1D) timeframe.
When analyzing pure market structure, the most reliable and explosive breakouts come from stocks that have fully digested their historical supply. Look at the structural development on the left side of this chart. The stock suffered a deep, highly volatile markdown phase that completely washed out weak hands. However, instead of collapsing into a permanent bear trend, institutional buyers established an absolute concrete floor at the solid black 70.77 line. After successfully defending this floor, the stock initiated a methodical, multi-month process of bottom accumulation, slowly carving out a massive "Cup" or U-shaped recovery.
2. The Educational Setup: The Pressure Cooker Handle
To understand the sheer strength of this current breakout, look at how the price systematically dismantled historical resistance on the right side of the curve:
The Structural Stepping Stone: Notice how the stock used the dashed 111.96 line as a mid-level pivot. It broke above it, paused to digest, and used it as a higher launchpad.
The High-Level Base: When the price reached the ultimate macro neckline at the solid black 119.29 line, amateur traders expected a brutal double-top rejection. Instead, institutional buyers aggressively defended the structure, establishing a tight consolidation zone directly underneath the resistance. Consolidating tightly for weeks right below a major historical ceiling forms a textbook "Handle." This acts like a pressure cooker, gracefully transferring shares from impatient retail traders taking quick profits over to strong-handed institutional buyers, storing immense kinetic energy.
3. Current Price Action: Blue Sky Territory
Look at the most recent daily candles on the far right. The pressure cooker has absolutely exploded. Buyers have effortlessly shattered the 119.29 macro ceiling, printing a massive, full-bodied green expansion candle and surging toward the 130 mark. By decisively clearing this massive high-level accumulation zone, PRIMECAB has officially entered "Blue Sky Territory" (pure price discovery). There is absolutely zero historical overhead supply left. Every single investor holding this stock is now in profit, meaning natural selling pressure evaporates.
4. The Trade Plan: Entries, Targets, and Risk Management
Entry Strategy: Momentum is exceptionally strong right now near 125.50. Chasing a massive, near-vertical daily expansion candle always carries a higher risk of an immediate intraday drawdown as the stock naturally breathes. The highest-probability, lowest-risk entry involves placing limit orders to catch a potential minor structural pullback to perfectly retest the 118.00 to 120.00 breakout zone. Letting that old heavy historical resistance prove itself as a new, indestructible support floor offers a phenomenal risk-to-reward ratio.
Take Profit (Targets): Because the stock is in pure price discovery, we use measured structural targets based on the depth of the macro base. By taking the massive depth of the rounding bottom (roughly 48.5 points from the 70.77 floor up to the 119.29 ceiling) and projecting it upward from the breakout line, our primary structural macro target sits comfortably in the 165.00 to 170.00 zone. Immediate psychological milestones are 140.00 and 150.00.
Invalidation (Stop Loss): A trade thesis is only valid if the new market structure holds. A hard stop loss should be placed safely below the high-level base and the dashed mid-level pivot, around the 108.00 to 110.00 level. A definitive daily close completely back below the 111.96 line would act as a massive warning sign of a failed macro breakout and severe structural weakness.
5. Time Horizon:
Because this technical setup is built on a 1-Day chart capturing a massive Cup & Handle completion into fresh price discovery, this is a short-to-medium-term swing trade designed to capture the explosive markup phase. Let the new trend run!  Long
Long
NIMBSPROJ: The Accumulation Base and Explosive Breakaway Gap1. The Micro Perspective: The Washing Machine Base
I am taking a LONG bias on Nimbus Projects Limited (NIMBSPROJ) on the daily (1D) timeframe.
When analyzing pure market structure, tight consolidation zones act as the launchpads for massive momentum thrusts. Look at the structural development on this chart over the last few weeks. The stock was trapped in a highly volatile horizontal channel. Sellers repeatedly defended the solid black 206.30 ceiling (and the dashed 203.76 pivot), pushing the price down into the 160s to shake out weak hands. However, buyers aggressively stepped back in, forming a V-shaped recovery to march right back to the resistance line. This sideways chop is the ultimate washing machine, quietly transferring shares to strong-handed institutional buyers.
2. The Educational Setup: The Breakaway Gap
To understand the sheer strength of this current breakout, look at how the price cleared the resistance zone. It didn't just casually drift higher.
The Setup: The stock printed a powerful green daily candle that pushed right up to the 206.30 ceiling and closed near its highs. This told us the pressure cooker was at maximum capacity.
The Execution: The very next day (the floating candle on the far right), the stock opened significantly higher, completely skipping over the 206.30 line. In technical analysis, this is called a "Breakaway Gap." It indicates extreme institutional urgency—buyers wanted in so badly that they refused to wait for the market to open at the previous close, instantly blowing past all remaining historical supply.
3. Current Price Action: Pure Momentum
Look at that massive green candle currently trading near the 225.00 mark. A breakaway gap that holds its gains and forms a full-bodied green candle is one of the most bullish signals in trading. It traps everyone who was shorting the 206.30 resistance and forces them to cover, adding extreme fuel to the fire. NIMBSPROJ has officially escaped its accumulation base and entered a violent markup phase.
4. The Trade Plan: Entries, Targets, and Risk Management
Entry Strategy: Momentum is at extreme levels right now as the stock pushes past 225.00. Chasing a massive gap-up always carries intraday risk. The highest-probability, lowest-risk entry involves waiting for the stock to naturally digest this move. Look to place limit orders to catch a potential "Gap Fill" or structural retest of the 206.00 to 210.00 zone. Letting that old heavy resistance prove itself as a new, indestructible support floor offers a phenomenal risk-to-reward ratio.
Take Profit (Targets): We use measured structural targets based on the depth of the recent base. By taking the depth of the consolidation (roughly 45 points from the ~160 lows to the 206.30 ceiling) and projecting it upward from the gap, our primary structural swing target sits in the 250.00 to 255.00 zone.
Invalidation (Stop Loss): A gap-and-go thesis is only valid if the gap acts as a new foundation. A hard stop loss should be placed safely below the 206.30 breakout line and inside the body of the previous day's pre-gap candle, around the 185.00 to 195.00 level. A definitive daily close completely back inside the old base and filling the gap downward would act as a massive warning sign of a bull trap.
5. Time Horizon:
Because this technical setup is built on a 1-Day chart capturing an explosive breakaway gap from a tight consolidation base, this is a short-to-medium-term swing trade designed to capture the violent momentum thrust. Let the new trend run!  Long
Long
WELINV: The Ascending Pressure Cooker and Explosive Vertical Bre1. The Macro Perspective: The Aggressive Accumulation Trend
I am taking a LONG bias on Welspun Investments & Commercials Ltd. (WELINV) on the weekly (1W) timeframe.
When analyzing pure market structure, the steepness of a trendline tells you everything you need to know about institutional urgency. Look at the massive structural development on this chart. After recovering from its macro lows, the stock established a steep, unbroken ascending trendline. Every single time the price pulled back, heavy institutional capital aggressively stepped in at higher and higher prices. They refused to let the stock suffer a deep correction, indicating a massive, underlying accumulation phase.
2. The Educational Setup: The High-Level Squeeze
To understand the sheer strength of this current breakout, look at how the price systematically squeezed historical resistance to form a textbook "Ascending Triangle":
The Structural Floors: Notice how the stock used the dashed 1,316.50 line as a mid-level stepping stone. Once it broke above it, buyers defended it, establishing a higher high-level floor.
The Pressure Cooker Ceiling: The stock's markup phase was temporarily capped by a formidable horizontal resistance line at 1,509.05.
The Squeeze: By aggressively pressing up against the 1,509.05 horizontal ceiling while riding the ascending trendline, the stock acted like the ultimate pressure cooker. It systematically squeezed out early sellers and transferred shares to strong-handed buyers, storing immense kinetic energy for the final launch.
3. Current Price Action: Entering the Price Vacuum
Look at the most recent weekly candles on the far right. The high-level pressure cooker has absolutely exploded. Buyers have effortlessly shattered the 1,509.05 macro ceiling with a massive, near-vertical momentum thrust, pushing the price well into the 1,650 zone. By decisively clearing this massive high-level accumulation step, WELINV has officially entered "Blue Sky Territory" (pure price discovery). Historical overhead supply has been completely eliminated.
4. The Trade Plan: Entries, Targets, and Risk Management
Entry Strategy: Momentum is exceptionally strong right now near 1,652.40. Chasing a massive, vertical expansion candle on the weekly timeframe always carries a high risk of agonizing intraday drawdowns as the stock naturally breathes. The highest-probability, lowest-risk entry involves stepping down to a daily timeframe and waiting for the dust to settle. Look to place limit orders to catch a potential structural pullback to retest the 1,500.00 to 1,520.00 breakout zone. Letting that heavy historical resistance prove itself as a new, indestructible support floor offers a phenomenal risk-to-reward ratio.
Take Profit (Targets): Because the stock is in pure price discovery, we use measured structural targets based on the depth of the pattern. By taking the depth of the recent massive swing (roughly 600 points from the ~900 trendline origin to the 1,509.05 ceiling) and projecting it upward, our primary structural macro target sits comfortably in the 2,100.00 to 2,150.00 zone. Immediate psychological milestones are 1,800.00 and 2,000.00.
Invalidation (Stop Loss): A trade thesis is only valid if the new market structure holds. A hard stop loss should be placed safely below the breakout line and the dashed mid-level pivot, around the 1,280.00 to 1,300.00 level. A definitive weekly close completely back inside the triangle and breaking below the ascending trendline would invalidate the immediate continuation thesis and signal a severe macro bull trap.
5. Time Horizon:
Because this technical setup is built on a 1-Week chart capturing a massive structural phase transition and ascending triangle breakout, this is a medium-to-longer-term position trade designed to capture the explosive new markup phase. Let the new trend run!  Long
Long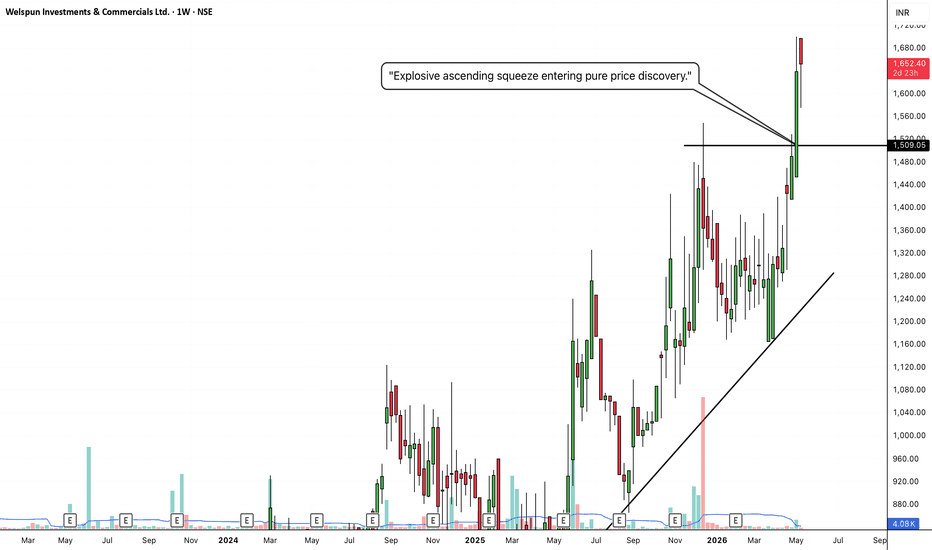
GODFREY PHILLIPS INDIA (GODFRYPHLP) — Ascending Channel Support 1. Technical Perspective
Time Frame Analysis (Daily): On the daily chart, Godfrey Phillips India continues to operate within a well-defined, multi-year ascending channel characterized by a persistent sequence of Higher Highs (HH) and Higher Lows (HL).
Channel Support Test: Following a extended retracement from its all-time peak near ₹3,950, the stock has retested the lower boundary of its ascending trendline near the ₹2,000–₹2,100 zone.
Volume & Price Action: Volume activity has stabilized at the lower boundary, showing signs of absorption and diminishing selling pressure. The current daily price action (trading around ₹2,107) reflects buyers defending the primary dynamic support line.
Moving Averages: The price is attempting to consolidate above its immediate short-term moving averages (20 EMA/50 EMA confluence zone), paving the way for a mean-reversion move toward the median and upper bounds of the channel.
2. Opportunity
Structure Type: Channel Support Rebound / Structural Value Buy
Trade Setup: The stock offers a favorable risk-to-reward entry at the bottom of an ascending channel where historical reactions have consistently triggered long-term upward legs.
3. Fundamental Perspective
Core Business & Financial Health: Godfrey Phillips is a leading player in India's tobacco and FMCG sector, backed by strong brand equity (including key partnerships and flagship brands).
Profitability & Capital Efficiency: The company boasts strong returns on capital, maintaining a high ROCE (~25%–31%) and ROE (~24%–26%) with a robust, virtually debt-free balance sheet (Debt/Equity ~0.04 to 0.06).
Earnings & Dividend Track Record: Demonstrates consistent revenue and net profit growth over multi-year periods alongside a steady history of cash distributions and dividend payouts.
4. Sector Index State
Nifty FMCG Overview: The broader Nifty FMCG index has undergone a prolonged period of consolidation and price correction, moving its overall valuation (P/E ratio) below long-term historical medians.
Sector Outlook: Sector rotation into defensive staples and pricing power in key cigarette/tobacco segments are providing strong structural support for top-tier market leaders within the sector.
5. Trade Parameters (TP / SL)
Entry Zone: ₹2,080 – ₹2,120
Stop Loss (SL): ₹1,940 (Closing basis below the ascending channel trendline support)
Target 1 (TP1): ₹2,550 (Intermediate resistance / mid-channel level)
Target 2 (TP2): ₹3,150 (Major swing high pivot)
Target 3 (TP3): ₹3,800+ (Upper boundary of the primary ascending channel)
 Long
Long
XAUUSD — Internal Supply Retest Sell Setup
Market Context
Gold is trading around $4,350 after rebounding from the recent lows, but the broader H2 structure remains clearly bearish. Consecutive downside BOS and the descending HTF bearish trendline continue to define seller control, while the current bounce appears more like corrective repricing than a confirmed bullish reversal.
Macro pressure remains important ahead of today’s U.S. CPI. August PPI rose 0.4% month-on-month, while markets are pricing roughly a 70% probability of a Fed rate hike next week. Oil above $100 is adding further inflation pressure, keeping Treasury yields and the dollar supported and creating a difficult backdrop for Gold despite ongoing geopolitical risk.
SMC View
The H2 chart continues to show bearish delivery beneath the HTF trendline. Recent BOS confirms that lower highs and lower lows remain intact, while the recovery from the current low has not yet reclaimed meaningful bearish structure.
The $4,380–$4,400 Internal Supply is the main decision zone. A retracement into this area could mitigate the latest bearish displacement before another sell-side expansion. The H2 Bearish OB near $4,442 remains the stronger structural invalidation barrier.
Main Trading Scenario
Condition:
Gold retraces into the $4,380–$4,400 Internal Supply and forms a clear bearish rejection. A lower-timeframe bearish MSS or CHOCH is required before entry.
Entry: $4,380–$4,400 after bearish confirmation
SL: Above $4,442 and the H2 Bearish OB
TP1: $4,320–$4,330
TP2: $4,275–$4,305
Key Zones to Watch
Current price: $4,350.070
Main sell zone: $4,380–$4,400
H2 Bearish OB: $4,441.990
External SSL / Major Demand: $4,275–$4,305
HTF bearish trendline: Dynamic resistance
Invalidation: Acceptance above $4,442
Confirmation: Bearish rejection with MSS or CHOCH
Prime Gold View
The sell bias remains valid while Gold stays below Internal Supply, the H2 Bearish OB and the descending HTF trendline.
If sellers defend $4,380–$4,400, price could resume bearish delivery toward the exposed External SSL around $4,300. Acceptance above $4,442 would weaken the immediate sell setup.
No confirmation, no trade.  Short
Short
BAJAJCON: Multi-Year Macro Base and Explosive Vertical Breakout1. The Macro Perspective: The Multi-Year Washout and Recovery
I am taking a LONG bias on Bajaj Consumer Care Limited (BAJAJCON) on the absolute macro monthly (1M) timeframe.
When analyzing pure market structure on a monthly chart, we are looking at cycles that take years to play out. Look at the massive structural development on this chart. After establishing an ultimate historical ceiling at the solid black 423.15 line in 2018, the stock suffered a brutal, multi-year markdown phase that dragged the price all the way down toward the 120 zone. This deep correction completely washed out weak hands and impatient retail investors. However, instead of bleeding into a permanent bear market, the stock found an absolute concrete floor. Over the last few years, it has been quietly carving out a massive "Rounding Bottom" accumulation phase, systematically absorbing overhead supply and grinding its way back up the chart.
2. The Educational Setup: Conquering the Stepping Stones
To understand the sheer strength of this current right-side recovery, look at how the price methodically conquered historical supply before the final launch:
The Mid-Level Boss: The stock first had to clear the heavy structural pivot at the solid black 284.40 line. Once buyers shattered this level, they refused to give it back, flipping it into a higher macro launchpad.
The High-Level Approach: By establishing a higher floor above 284.40, institutional capital could safely apply pressure directly underneath the ultimate 423.15 macro ceiling. This high-level absorption acts like a pressure cooker, transferring millions of shares to strong-handed buyers and storing immense kinetic energy.
3. Current Price Action: Blue Sky Territory
Look at the most recent monthly candles on the far right, accompanied by a massive surge in buying volume (visible on the bottom panel). The multi-year pressure cooker hasn't just opened; it has completely exploded. Buyers have effortlessly shattered the 423.15 macro ceiling with a violent, near-vertical momentum thrust, slicing straight through the dashed 511.85 level and pushing toward 550. By decisively clearing this massive multi-year accumulation zone, BAJAJCON has officially entered "Blue Sky Territory" (pure price discovery). Historical overhead supply has been completely eliminated.
4. The Trade Plan: Entries, Targets, and Risk Management
Entry Strategy: Momentum is at extreme levels right now near 547.95. Because this is a massive vertical expansion candle on the monthly timeframe, chasing it on smaller timeframes carries a high risk of agonizing intraday or weekly drawdowns as the stock naturally breathes. The highest-probability, lowest-risk entry involves stepping down to a weekly or daily timeframe and waiting for the dust to settle. Look to place limit orders to catch a potential structural pullback or consolidation flag to retest the 450.00 to 500.00 zone, or ideally the 423.15 breakout line. Letting that multi-year resistance prove itself as indestructible support offers a phenomenal risk-to-reward ratio.
Take Profit (Targets): Because the stock is in pure price discovery, we use measured structural targets based on the depth of the macro base. By taking the depth of the multi-year accumulation zone (roughly 300 points from the ~120 floor to the 423.15 ceiling) and projecting it upward from the breakout line, our primary structural macro target sits comfortably in the 720.00 to 750.00 zone. Immediate psychological milestones are 600.00 and 650.00.
Invalidation (Stop Loss): A macro trade thesis is only valid if the new market structure holds. A hard stop loss should be placed safely below the recent monthly breakout structure, around the 380.00 to 400.00 level. A definitive monthly close completely back inside the old base and below the 423.15 line would invalidate the immediate continuation thesis and signal a severe macro bull trap.
5. Time Horizon:
Because this technical setup is built on a 1-Month chart capturing a massive, multi-year structural phase transition into fresh price discovery, this is a long-term position trade designed to capture a secular markup phase. Let the macro trend run!
 Long
Long
TATACONSUM: High-Level Base Breakout1. The Macro Perspective: The Deep Washout and the Cup
I am taking a LONG bias on Tata Consumer Products Limited (TATACONSUM) on the weekly (1W) timeframe.
When analyzing pure market structure, the most reliable and explosive breakouts come from stocks that have fully digested their historical supply. Look at the massive structural development on this chart. After establishing an ultimate historical ceiling near the 1,233 zone, the stock suffered a deep, highly volatile markdown phase. This correction successfully washed out all the weak hands and impatient retail buyers. However, instead of collapsing into a permanent bear trend, the stock initiated a methodical, multi-month process of bottom accumulation, slowly carving out a massive "Cup" recovery to march right back to the scene of the crime.
2. The Educational Setup: The Pressure Cooker Handle
To understand the sheer strength of this current breakout, look at how the price systematically dismantled historical resistance on the right side of the curve:
The Absorption: When the stock rallied back to the massive solid black 1,233.85 macro ceiling, amateur traders expected a brutal double-top rejection. Notice how that didn't happen.
The High-Level Base: Instead of selling off, institutional buyers aggressively defended the structure, establishing a tight consolidation zone using the 1,199.15 line as a high-level floor. Consolidating tightly for months directly underneath major historical resistance forms a textbook "Handle." This acts like a pressure cooker, gracefully transferring shares from impatient retail bag-holders to strong-handed institutional buyers and storing immense kinetic energy.
3. Current Price Action: Blue Sky Territory
Look at the most recent weekly candle on the far right. The pressure cooker has absolutely exploded. Buyers have effortlessly shattered the 1,233.85 macro ceiling, printing a solid green expansion candle and pushing the price above 1,250. By decisively clearing this massive high-level accumulation zone, TATACONSUM has officially entered "Blue Sky Territory" (pure price discovery). There is absolutely zero historical overhead supply left. Every single investor holding this stock is now in profit, meaning natural selling pressure evaporates.
4. The Trade Plan: Entries, Targets, and Risk Management
Entry Strategy: Momentum is exceptionally strong right now near 1,253.00. The highest-probability, lowest-risk entry involves stepping down to a daily timeframe and placing limit orders to catch a potential minor structural pullback to perfectly retest the 1,200.00 to 1,235.00 breakout zone. Letting that old heavy historical resistance prove itself as a new, indestructible support floor offers a phenomenal risk-to-reward ratio.
Take Profit (Targets): Because the stock is in pure price discovery, we use measured structural targets based on the depth of the macro base. By taking the depth of the recent massive consolidation phase (roughly 330 points from the ~900 floor up to the 1,233.85 ceiling) and projecting it upward from the breakout line, our primary structural macro target sits comfortably in the 1,550.00 to 1,570.00 zone. The immediate psychological milestone is the 1,400.00 mark.
Invalidation (Stop Loss): A trade thesis is only valid if the new market structure holds. A hard stop loss should be placed safely below the high-level base and recent swing lows, around the 1,120.00 to 1,140.00 level. A definitive weekly close completely back below the 1,199.15 base floor would act as a massive warning sign of a failed macro breakout and severe structural weakness.
5. Time Horizon:
Because this technical setup is built on a 1-Week chart capturing a massive Cup & Handle completion into fresh price discovery, this is a medium-to-longer-term position trade designed to capture the explosive markup phase. Let the macro trend run!  Long
Long
THERMAX: The Accumulation Box and Explosive Mid-Level Breakout1. The Macro Perspective: The Washout and the Box
I am taking a LONG bias on Thermax Limited (THERMAX) on the weekly (1W) timeframe.
When analyzing pure market structure, we have to respect the psychology of a deep correction. Look at the macro structure on this chart. After establishing a massive historical ceiling at the solid black 5,662.90 line, the stock suffered a brutal, highly volatile markdown phase that dragged the price all the way down below 3,000. This deep correction successfully washed out all the weak hands. However, instead of collapsing into a permanent bear trend, the stock found an absolute floor. Notice the shaded box on the chart: for months, the stock chopped sideways in a tight, defined accumulation zone, acting as a washing machine to frustrate retail while institutional capital quietly loaded the boat.
2. The Educational Setup: Conquering the Stepping Stones
To understand the sheer strength of this current right-side recovery, look at how the price systematically transitioned from accumulation to markup:
The Box Breakout: The stock didn't just drift higher; it violently exploded out of the accumulation box with massive green expansion candles, confirming a definitive shift in the macro trend.
The Mid-Level Boss: In every major recovery, there is a primary structural hurdle before the ultimate highs. For THERMAX, this was the heavy historical pivot at the solid black 3,989.55 line.
3. Current Price Action: The Break and Retest
Look at the most recent weekly candles on the far right. The momentum from the box breakout carried the stock straight through the 3,989.55 resistance ceiling. Now, look at the current red weekly candle. To amateur traders, this looks like a failed rally. To structural traders, this is exactly what a healthy market does. The stock is simply taking a breather, pulling back to perfectly test that 3,989.55 line from above. The old, heavy mid-level resistance is officially being flipped into a brand-new, rock-solid support floor.
4. The Trade Plan: Entries, Targets, and Risk Management
Entry Strategy: Momentum is exceptionally strong right now in the 4,500 zone. Because the stock recently printed a massive vertical thrust, chasing it blindly carries intraday risk. The highest-probability, lowest-risk entry involves stepping down to a daily timeframe and placing limit orders to catch a potential deeper structural pullback to retest the 4,000.00 to 4,200.00 breakout zone. Letting that mid-level resistance prove itself as indestructible support offers a phenomenal risk-to-reward ratio.
Take Profit (Targets): The primary macro target is undeniable. Because the stock has cleared its primary mid-level hurdle, the door is wide open for a full macro retest of the ultimate historical ceiling sitting at 5,662.90. The 5,000.00 century mark will act as an immediate psychological magnet along the way.
Invalidation (Stop Loss): A trade thesis is only valid if the new market structure holds. A hard stop loss should be placed safely below the 3,989.55 breakout line and the recent swing lows, around the 3,600.00 to 3,700.00 level. A definitive weekly close completely back below 3,989.55 would invalidate the immediate continuation thesis and signal a potential deeper consolidation phase.
5. Time Horizon:
Because this technical setup is built on a 1-Week chart capturing a massive box breakout and mid-level structural continuation, this is a medium-to-longer-term position trade designed to capture the explosive right-side recovery phase. Let the macro trend run!  Long
Long
MANKIND: Rounding Bottom Continuation1. The Macro Perspective: The Deep Washout and Trend Shift
I am taking a LONG bias on Mankind Pharma Ltd. (MANKIND) on the daily (1D) timeframe.
When analyzing pure market structure, identifying the exact moment a stock transitions from a prolonged accumulation phase into a brand-new markup phase offers some of the highest risk-to-reward setups possible. Looking at this chart, the stock suffered a deep, highly volatile markdown phase from its historical highs, dragging the price all the way down to establish an absolute concrete floor at the solid black 1,921.15 line. This brutal correction successfully washed out all the weak hands. However, instead of collapsing further, capitulation set in. For months, the stock chopped sideways, carving out an enormous "Rounding Bottom" and allowing heavy institutional capital to quietly absorb shares at a massive discount.
2. The Educational Setup: The Pressure Cooker Ceiling
To understand the sheer strength of this current breakout, look at how the price systematically built a reversal structure:
The Accumulation Lid: For an extended period, the stock's recovery was capped by the heavy solid black resistance line at 2,290.50. This acted as the defining neckline of the entire bottoming structure.
The Absorption: Notice the price action just before and immediately after crossing that 2,290.50 line. The stock didn't just spike and fail (a bull trap). It pressed up against the resistance, broke through, and then consolidated slightly above it. By refusing to fall back into the box, the market officially accepted these higher valuations, flipping that old heavy resistance into a brand-new support floor.
3. Current Price Action: The Markup Phase Begins
Look at the most recent daily candles on the far right. After successfully digesting the breakout, the stored kinetic energy is being unleashed. Buyers have aggressively stepped back in, printing strong, consecutive green expansion candles and surging past the 2,450 mark. By decisively clearing the multi-month accumulation zone and holding its ground, MANKIND has officially confirmed a macro trend reversal. The markdown phase is over; the markup phase has begun.
4. The Trade Plan: Entries, Targets, and Risk Management
Entry Strategy: Momentum is exceptionally strong right now near 2,465.40. While the "golden entry" was closer to the 2,300 retest zone, aggressive momentum traders are stepping in here. The highest-probability, lowest-risk entry for new capital involves placing limit orders to catch a potential minor intraday or daily structural pullback to the 2,400.00 to 2,420.00 zone.
Take Profit (Targets): Because the stock is systematically working its way back up the historical chart, we have crystal clear structural targets. The immediate objective is the dashed mid-level pivot resting at 2,617.75. Once cleared, the ultimate macro target is a full retest of the massive red historical ceiling sitting at 2,685.45.
Invalidation (Stop Loss): A trade thesis is only valid if the new market structure holds. A hard stop loss should be placed safely below the breakout line and the recent consolidation structure, around the 2,200.00 to 2,240.00 level. A definitive daily close completely back inside the old accumulation box and below the 2,290.50 line would invalidate the immediate reversal thesis and signal a potential bull trap.
5. Time Horizon:
Because this technical setup is built on a 1-Day chart capturing a massive structural phase transition and bottom breakout, this is a short-to-medium-term swing trade designed to capture the explosive new markup phase toward historical highs. Let the new trend run!  Long
Long
NIFTY: Pullback Into Supply. Bearish trend will continue Nifty has seen a sharp decline from the 24,000+ zone and is now attempting a recovery from the recent low.
This recovery looks like a pullback after the breakdown, rather than a confirmed reversal.
The important zone is 23,555–23,789, marked as supply. If Nifty moves into this zone and gets rejected, it could resume the larger downtrend.
🔻 Below 23,555 → weakness can continue
🔻 Rejection from 23,555–23,789 → bearish continuation
🔺 Sustained move above 23,789 → bearish view weakens
For now, the bounce needs to prove itself. I’m watching the supply zone for signs of rejection.  Short
Short
GRAPHITE: Multi-Year Ascending Triangle Breakout to Fill the Mac1. The Macro Perspective: The Boom, The Bust, and The Base
I am taking a LONG bias on Graphite India Limited (GRAPHITE) on the absolute macro monthly (1M) timeframe.
When analyzing pure market structure on a monthly chart, we are looking at the true footprints of heavy institutional capital playing out over years. Look at the massive structural development on this chart. In 2018, the stock established its ultimate historical ceiling at the solid red 883.50 line. What followed was a brutal, multi-year markdown phase that completely decimated weak hands. However, instead of bleeding into a permanent bear market, the stock found an absolute floor in 2020. For the last four years, the stock has been quietly carving out a massive accumulation phase, systematically grinding its way back up the chart.
2. The Educational Setup: The Ascending Pressure Cooker
To understand the sheer strength of this current breakout, look at how the price systematically squeezed historical resistance to form a textbook macro "Ascending Triangle":
The Dual Ceilings: The stock's recovery was heavily capped by a formidable dual-resistance zone consisting of the solid black lines at 662.90 and 698.50.
The Aggressive Trendline: Notice the defining feature of this right-side recovery: the steep, unbroken ascending trendline originating from the 2020 lows. Every time the stock pulled back from the black resistance lines, institutional buyers stepped in earlier and earlier, forming a beautiful sequence of higher lows.
The Squeeze: By aggressively pressing up against the horizontal ceilings while forming higher lows, the stock acted like the ultimate pressure cooker. It squeezed short-sellers and transferred millions of shares to strong-handed buyers, storing immense kinetic energy for the final launch.
3. Current Price Action: Entering the Price Vacuum
Look at the most recent monthly candle on the far right. The multi-year pressure cooker has absolutely exploded. Buyers have effortlessly shattered both the 662.90 and 698.50 macro ceilings with a massive, full-bodied green momentum thrust. By decisively clearing this multi-year accumulation zone, GRAPHITE has officially confirmed a secular trend shift. More importantly, it has entered a "Price Vacuum." Looking to the left, there is very little structural resistance between the current price and the ultimate red 883.50 level.
4. The Trade Plan: Entries, Targets, and Risk Management
Entry Strategy: Momentum is exceptionally strong right now near 731.30. Because this is a monthly breakout, chasing a massive vertical expansion candle on smaller timeframes carries a higher risk of agonizing drawdowns. The highest-probability, lowest-risk entry involves stepping down to a weekly or daily timeframe and waiting for the dust to settle. Look to place limit orders to catch a potential structural pullback to retest the 680.00 to 700.00 breakout zone. Letting those years of heavy resistance prove themselves as a new, indestructible support floor offers a phenomenal risk-to-reward ratio.
Take Profit (Targets): The primary macro target is undeniable: the massive red historical resistance line sitting at 883.50. The stock is attempting to complete a massive, multi-year round trip to fill that void.
Invalidation (Stop Loss): A macro trade thesis is only valid if the new market structure holds. A hard stop loss should be placed safely below the recent monthly accumulation and the ascending trendline, ideally near the dashed 550.85 mid-level pivot. A definitive monthly close completely back inside the old base and below 600.00 would invalidate the immediate continuation thesis and signal a severe macro bull trap.
5. Time Horizon:
Because this technical setup is built on a 1-Month chart capturing a massive, multi-year structural phase transition, this is a long-term position trade/investment designed to capture a secular markup phase that could play out over several quarters. Let the macro trend run!  Long
Long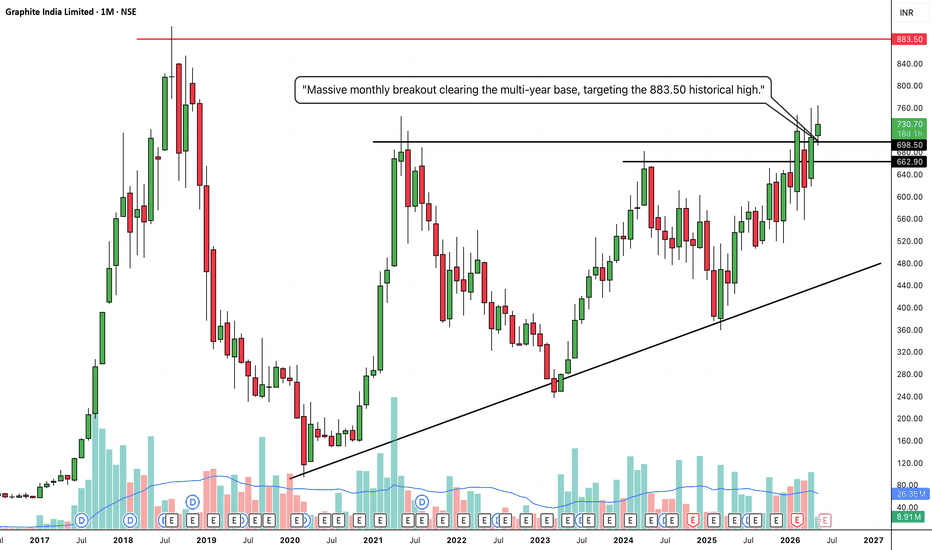
APCOTEXIND: Massive Rounding Bottom and Explosive Momentum Break1. The Macro Perspective: The Deep Washout and Trend Shift
I am taking a LONG bias on Apcotex Industries Ltd (APCOTEXIND) on the weekly (1W) timeframe.
When analyzing pure market structure, identifying the exact moment a stock transitions from a prolonged accumulation phase into a brand-new markup phase offers some of the highest risk-to-reward setups possible. Looking at the left side of this chart, the stock suffered a deep, highly volatile markdown phase, dragging the price all the way down to establish an absolute concrete floor below the 300 level. This brutal correction successfully washed out all the weak hands. However, instead of collapsing further, capitulation set in. For months, the stock chopped sideways, carving out an enormous "Rounding Bottom" and allowing heavy institutional capital to quietly absorb shares at a massive discount.
2. The Educational Setup: The Pressure Cooker Ceiling
To understand the sheer strength of this current breakout, look at how the price systematically built a reversal structure:
The Accumulation Lid: For an extended period, the stock's recovery was capped by the heavy solid black resistance line at 426.10. This acted as the defining neckline of the entire bottoming structure.
The High-Level Squeeze: Notice how in the weeks leading up to the breakout, the stock formed a clear higher low structure. Buyers stepped in aggressively in the 340-360 zone, refusing to let the price fall back to the base floor. By pressing up against major resistance while printing higher lows, the stock acted like a pressure cooker, transferring shares from impatient sellers to strong-handed buyers and storing immense kinetic energy.
3. Current Price Action: The Reversal Confirmed
Look at the most recent weekly candle on the far right, accompanied by a massive, undeniable surge in buying volume (visible on the bottom panel). The pressure cooker has absolutely exploded. Buyers have effortlessly shattered the 426.10 resistance ceiling with a powerful, vertical momentum thrust, slicing straight through the dashed 513.55 mid-level pivot as well. By decisively clearing this massive multi-month accumulation zone with such sheer force, APCOTEXIND has officially confirmed a macro trend reversal. The markdown phase is over; the markup phase has begun.
4. The Trade Plan: Entries, Targets, and Risk Management
Entry Strategy: Momentum is exceptionally strong right now near 520.65. Chasing an enormous, vertical weekly expansion candle always carries a much higher risk of an immediate intraday or daily drawdown as the stock naturally breathes. The highest-probability, lowest-risk entry involves stepping down to a daily timeframe and waiting for the dust to settle. Look to place limit orders to catch a potential structural pullback or consolidation flag that retests the 426.00 to 450.00 breakout zone. Letting that old heavy resistance prove itself as a new, indestructible support floor offers a phenomenal risk-to-reward ratio.
Take Profit (Targets): Because the stock is systematically working its way back up the historical chart, we use measured structural targets. By taking the depth of the massive macro base (roughly 145 points from the sub-280 floor to the 426.10 neckline) and projecting it upward from the breakout line, our primary structural target sits comfortably in the 570.00 to 580.00 zone. The ultimate psychological milestone is the 600.00 century mark.
Invalidation (Stop Loss): A trade thesis is only valid if the new market structure holds. A hard stop loss should be placed safely below the breakout line and the recent higher-low pivot structure inside the base, around the 375.00 to 385.00 level. A definitive weekly close completely back inside the old accumulation box and below the 426.10 line would invalidate the immediate reversal thesis and signal a potential bull trap.
5. Time Horizon:
Because this technical setup is built on a 1-Week chart capturing a massive structural phase transition and bottom breakout, this is a medium-to-longer-term position trade designed to capture the explosive new markup phase. Let the new trend run!  Long
Long
SURYODAY: Massive Rounding Bottom and Explosive Volume Breakout1. The Macro Perspective: The Deep Washout and Trend Shift
I am taking a LONG bias on Suryoday Small Finance Bank Limited (SURYODAY) on the weekly (1W) timeframe.
When analyzing pure market structure, identifying the exact moment a stock transitions from a prolonged accumulation phase into a brand-new markup phase offers some of the highest risk-to-reward setups possible. Looking at this chart, the stock suffered a deep, highly volatile markdown phase from its historical highs above 215, dragging the price all the way down to establish an absolute concrete floor near the 100 level. This brutal correction successfully washed out all the weak hands. However, instead of collapsing further, capitulation set in. For months, the stock chopped sideways, carving out a massive "Rounding Bottom" and allowing heavy institutional capital to quietly absorb shares at a massive discount.
2. The Educational Setup: The Pressure Cooker Ceiling
To understand the sheer strength of this current breakout, look at how the price systematically built a reversal structure:
The Accumulation Lid: For an extended period, the stock was capped by the heavy solid green resistance line at 151.24. This was the defining neckline of the entire bottoming structure.
The Higher Lows: Notice how in the weeks leading up to the breakout, the pullbacks became shallower. Buyers stepped in aggressively, forming higher lows and compressing tightly up against the 151.24 neckline. By pressing against major resistance without making new macro lows, the stock acted like a pressure cooker, transferring shares from impatient sellers to strong-handed buyers and storing immense kinetic energy.
3. Current Price Action: The Reversal Confirmed
Look at the most recent weekly candle on the far right, accompanied by a massive, undeniable surge in buying volume (visible on the bottom panel). The pressure cooker has absolutely exploded. Buyers have effortlessly shattered the green 151.24 resistance ceiling with a powerful, near-vertical momentum thrust, pushing the price straight into the 179 zone. By decisively clearing this multi-month accumulation zone with such sheer force, SURYODAY has officially confirmed a macro trend reversal. The markdown phase is over; the markup phase has begun.
4. The Trade Plan: Entries, Targets, and Risk Management
Entry Strategy: Momentum is exceptionally strong right now near 179.93. Chasing a massive, near-vertical weekly expansion candle always carries a higher risk of an immediate intraday or daily drawdown. The highest-probability, lowest-risk entry involves stepping down to a daily timeframe and placing limit orders to catch a potential minor structural pullback to perfectly retest the 150.00 to 155.00 breakout zone. Letting that old heavy resistance prove itself as a new, indestructible support floor offers a phenomenal risk-to-reward ratio.
Take Profit (Targets): Because the stock is systematically working its way back up the historical chart, our immediate structural target is the dashed mid-level pivot at 189.13. Once cleared, the primary macro objective is a full retest of the ultimate historical red ceiling sitting at 194.92. Extended psychological milestones sit at 210.00+.
Invalidation (Stop Loss): A trade thesis is only valid if the new market structure holds. A hard stop loss should be placed safely below the breakout line and the recent higher-low structure inside the base, around the 130.00 to 135.00 level. A definitive weekly close completely back inside the old accumulation box and below the 151.24 green line would invalidate the reversal thesis and signal a potential bull trap.
5. Time Horizon:
Because this technical setup is built on a 1-Week chart capturing a massive structural phase transition and bottom breakout, this is a medium-to-longer-term position trade designed to capture the explosive new markup phase. Let the new trend run!  Long
Long
XAUUSD - Bullish Continuation Setup and Further Upside Expansion🔍 Market Overview
Gold continues to maintain a positive bullish structure on the daily timeframe after recovering strongly from the 4,120–4,198 support zone. The previous rally pushed price toward higher levels, while the current correction has not yet broken the broader bullish structure.
As long as buyers continue to defend the marked support zone and the higher-low structure remains intact, the overall trend continues to favor further upside expansion in XAUUSD.
📈 Market Structure Analysis
Market Trend: Bullish
Momentum: Corrective / Consolidating
Current Phase: Bullish Continuation
The price structure shows that Gold broke away from the lower consolidation area with strong bullish momentum. The recent decline is bringing price lower, but for now, it still appears to be a pullback within the broader uptrend rather than a confirmed bearish reversal.
Price remaining comfortably above the main support zone suggests that buyers still have the advantage. A clear bullish reaction from the current structure could trigger the next upside expansion.
🚀 Trading Scenario
✅ Bullish Scenario
Main trend conditions:
Price continues to hold above the 4,120–4,198 support zone.
The higher-low structure remains intact.
Selling pressure begins to weaken during the correction.
Price regains bullish momentum after the pullback.
Trading Plan:
Look for buying opportunities after a confirmed bullish reaction rather than chasing price while the correction is still developing. A recovery of the short-term bullish structure would provide stronger confirmation for trend continuation.
🎯 Target 1: 4,612
🎯 Target 2: 4,755
❌ Bullish Invalidation Conditions
Price decisively breaks below the main support zone.
A daily candle closes strongly below 4,120.
Market structure begins forming lower lows.
The correction develops into a strong bearish expansion.
A confirmed breakdown below the support zone would significantly weaken the current bullish setup and could open the door for a deeper correction.
🎯 Key Support Zone: 4,120–4,198
📍 Key Levels to Watch
🟢 Nearest Resistance: 4,612
🟢 Main Target: 4,755
🔴 Nearest Support: 4,198
🔴 Key Support: 4,120
⚠️ Trading View
The overall structure remains bullish while XAUUSD holds above the key demand zone. The current decline may simply represent a corrective and reaccumulation phase before buyers attempt to regain control.
If price stabilizes and bullish momentum returns, 4,612 becomes the first upside target. A convincing breakout above this area could extend the move toward 4,755.
However, losing the 4,120–4,198 support zone would materially change the structure and require a reassessment of the bullish scenario.
🧠 Expert View
The current setup is supported by:
Strong recovery from the main support zone.
The higher-timeframe bullish structure remains intact.
Price has not returned below the previous breakout area.
The current decline still has the characteristics of a pullback.
The potential for another higher low remains intact.
Clear upside targets at 4,612 and 4,755.
Preferred approach: Avoid trying to catch the exact bottom and avoid chasing price. Wait for the market to show that buyers are genuinely returning before considering positions in the direction of the broader trend.
🛡️ Risk Management
Risk only 1–2% of trading capital per position.
Define the invalidation level before entering.
Place stop losses according to the relevant support structure.
Do not increase position size simply because price continues to correct.
Wait for price-action confirmation rather than relying purely on prediction.
If the support structure fails, respect the market signal and reassess the bias.
Disclaimer: This analysis is provided for educational purposes and to share a market perspective only. It should not be considered financial or investment advice. Long 
#NIFTY Intraday Support and Resistance Levels - 15/09/2026Nifty 50 is expected to open flat, with the index around 23,435. The chart shows a recovery from the 23,250–23,300 zone, but the index is now facing resistance near 23,450–23,500. This makes the opening range important for determining the next move.
On the bullish side, a sustained move above 23,500 can strengthen the recovery and open the way toward 23,650, 23,700 and 23,750. Holding above 23,500 would indicate that buyers are gaining control after the recent recovery.
On the bearish side, failure to sustain above 23,450 can bring selling pressure back. A decisive break below 23,400 can lead to targets around 23,350, 23,300 and 23,250. The 23,250 area remains an important support zone.
Overall, 23,400–23,500 is the key decision zone for today's session. With a flat opening, traders should wait for a confirmed breakout or breakdown instead of taking positions in the middle of the range. A move above 23,500 can support further recovery, while weakness below 23,400 can resume the downside. #BANKNIFTY Intraday PE & CE Levels(15/09/2026)Bank Nifty is expected to open flat, with the index around 56,606. The chart shows a strong recovery from the recent lower levels, and the index is now trading above the important 56,550 support zone. However, it is approaching the next major resistance near 56,950, so the opening session may remain range-bound until a clear breakout.
On the bullish side, 56550 is the immediate support. If Bank Nifty sustains above this level and moves decisively higher, the index can continue its recovery toward 56750, 56850 and 56950. A sustained breakout above 56950 can further strengthen the bullish momentum.
On the bearish side, failure to hold 56550 can bring selling pressure back into the market. A break below 56450 may lead to a correction toward 56250, 56150 and 56050, with 56,050 acting as an important support.
Overall, 56,550–56,950 is the key trading range for the session. With a flat opening, traders should wait for a confirmed move outside this range. Holding above 56,550 keeps the recovery structure intact, while a sustained breakout above 56,950 can signal further upside.  Long
Long


