AI Is Booming. But Where Are The Returns?The AI story is no longer just about what the technology can do. It is increasingly about how much companies are spending to build it, how quickly that spending translates into revenue, and whether the returns will justify the investment.
Over the past few years, artificial intelligence has become one of the biggest investment themes in global markets. Major technology companies are committing substantial capital to data centres, advanced chips, cloud infrastructure and AI models. The logic is
Community ideas
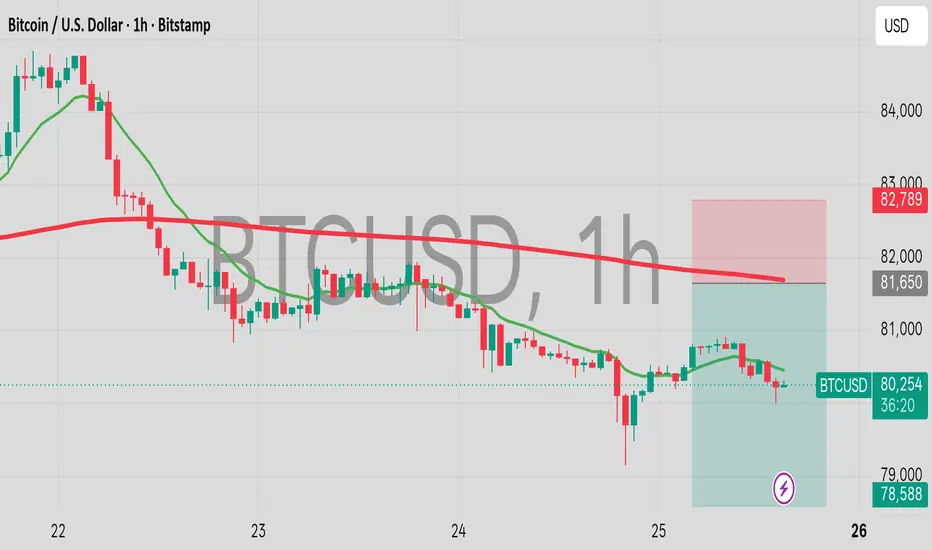
BTCUSD (Bitcoin) | Bearish Setup – 15 Min ChartBitcoin remains under selling pressure on the 15-minute chart following a sharp decline.
The recent recovery is facing resistance around the 80,300–80,313 zone. Watching for a possible rejection and continuation towards the recent lows.
Entry: $80,229.90
Target: $79,998.87
Stop Loss: $80,313.25
A 15-minute candle closing above the red stop-loss line would invalidate this bearish setup.
Technical observation only. Not investment advice.
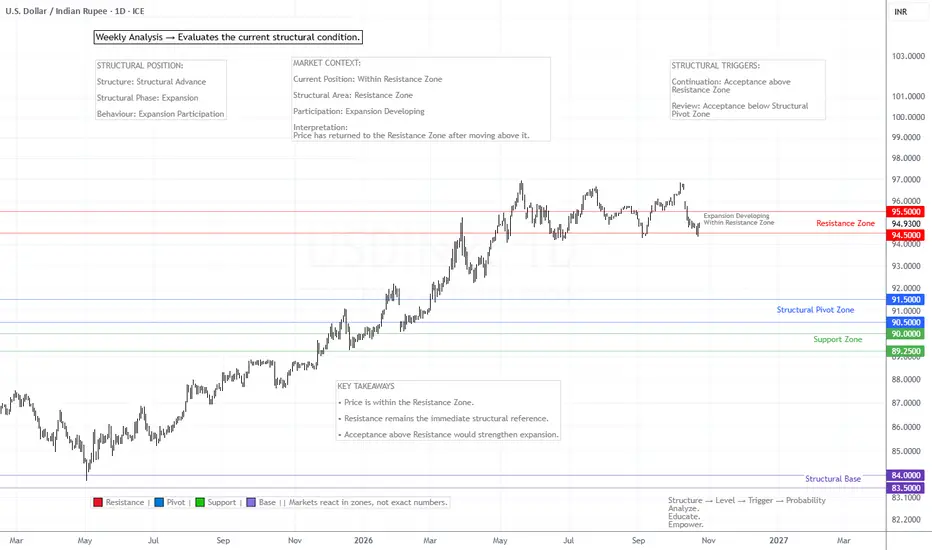
USDINR — Weekly Structural Observation | Week 4325 October 2026
Introduction
USDINR has returned within its established Resistance Zone. In Week 41, price was positioned above Resistance; the Week 43 observation places it back inside the same zone.
The primary structural levels remain unchanged. The current focus is on price behaviour and acceptance around Resistance.
Structure
Structural Advance
Structural Phase
Expansion
Market Context
Current Position: Within Resistance
Structural Area: Resistance Zone — 94.5–95.5
Participatio
S&P 500 — Weekly Structural Observation | Week 4325 October 2026
Introduction
The S&P 500 remains above its established Resistance Zone. Compared with Week 41, the displayed price is lower, but its structural position remains above Resistance.
The distinction between a price pullback and a change in structural position remains central to this observation.
Structure
Structural Advance
Structural Phase
Expansion
Market Context
Current Position: Above Resistance
Structural Area: Resistance Zone — 7,300–7,600
Participation: Expansion De
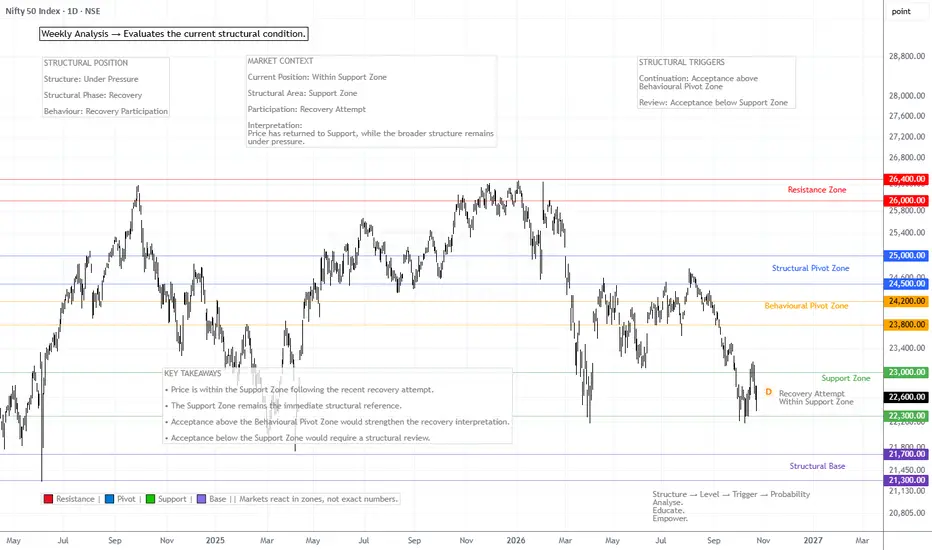
NIFTY 50 — Weekly Structural Observation | Week 4325 October 2026
Introduction
NIFTY 50 remains within its established Support Zone. Compared with Week 41, the displayed price is slightly higher, but the broader structural context remains under pressure.
The recovery attempt must be assessed against the existing structural references rather than the price change alone.
Structure
Under Pressure
Structural Phase
Recovery
Market Context
Current Position: Within Support
Structural Area: Support Zone — 22,300–23,000
Participation: Reco
U.S. 10-Y Treasury Yield — Weekly Structural Observation25 October 2026
Introduction
The U.S. 10-Year Treasury Yield has returned within its established Resistance Zone. In Week 41, the yield was positioned above Resistance; the Week 43 observation places it back inside the same zone.
The structural levels remain unchanged. The focus is on how price behaves within Resistance and whether acceptance develops beyond it.
Structure
Range Structure
Structural Phase
Recovery
Market Context
Current Position: Within Resistance
Structural Area: Resis
U.S. Dollar Index (DXY) — Weekly Structural Observation |Week 4325 October 2026
Introduction
DXY remains within its established Structural Pivot Zone. Compared with Week 41, the displayed price has eased, but the current position remains within the same structural area.
The focus is on how price behaves inside the Pivot Zone and whether acceptance develops beyond its boundaries.
Structure
Range Structure
Structural Phase
Recovery
Market Context
Current Position: Within Structural Pivot
Structural Area: Structural Pivot Zone — 99.5–102.5
Participat
Crude Oil (XTIUSD) — Weekly Structural Observation | Week 4325 October 2026
Introduction
Crude Oil remains above its established Structural Pivot Zone. Compared with Week 41, price has extended further above the Pivot, while the Resistance Zone remains the next major structural reference.
The observation is focused on the relationship between the Pivot, current position and developing recovery participation.
Structure
Range Structure
Structural Phase
Recovery
Market Context
Current Position: Above Structural Pivot
Structural Area: Structural Pi
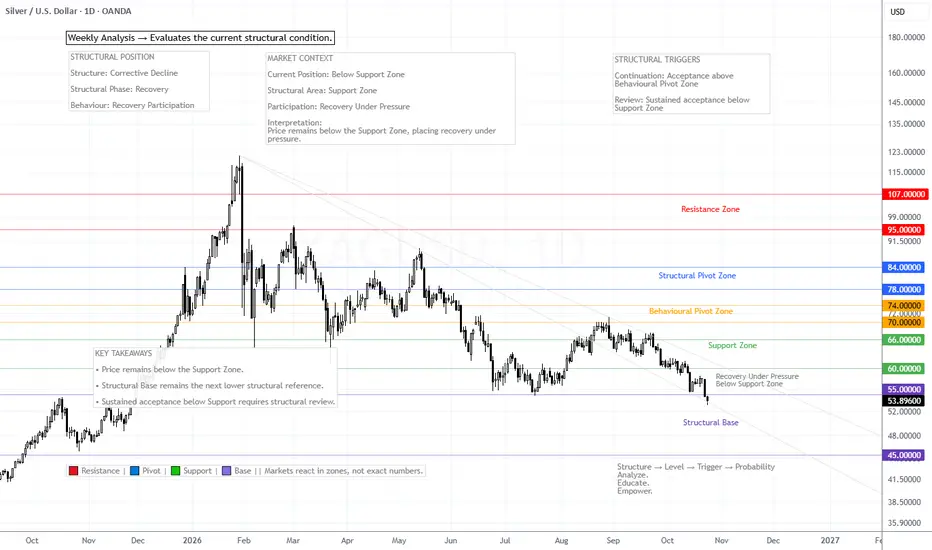
Silver (XAGUSD) — Weekly Structural Observation | Week 4325 October 2026
Introduction
Silver has moved below its established Support Zone. Compared with Week 41, price has crossed the lower boundary of the existing zone, placing recovery participation under pressure.
The focus remains on price position, structural references and subsequent acceptance.
Structure
Corrective Decline
Structural Phase
Recovery
Market Context
Current Position: Below Support
Structural Area: Support Zone — 60–66
Participation: Recovery Under Pressure
Interpretati
Gold (XAUUSD) — Weekly Structural Observation | Week 4325 October 2026
Introduction
Gold has moved below its established Support Zone. This marks a change in price position relative to the previous published reference, while the primary structural levels remain unchanged.
The current observation focuses on the distinction between a positional break and a confirmed structural change.
Structure
Corrective Decline
Structural Phase
Recovery
Market Context
Current Position: Below Support
Structural Area: Support Zone — 4,000–4,200
Participatio
Xagusd silver weekly Updates level 26.10.2026..30.10.2026*🟡 XAG USD(SILVER) – WEEKLY UPDATE 🟡 ⏰*
*Validity: 26-10-26 to 30-10-26*
*🔹 Bullish Scenario (BUY)*
*• Trend Confirmation: Above 58.60*
*• Targets: 60.70 – 62.80*
*🔻 Bearish Scenario (SELL)*
*• Trend Confirmation: Below 51.50*
*• Targets: 50.00 – 47.00*
*🔄 Key Reversal / Entry Level: 55.00*
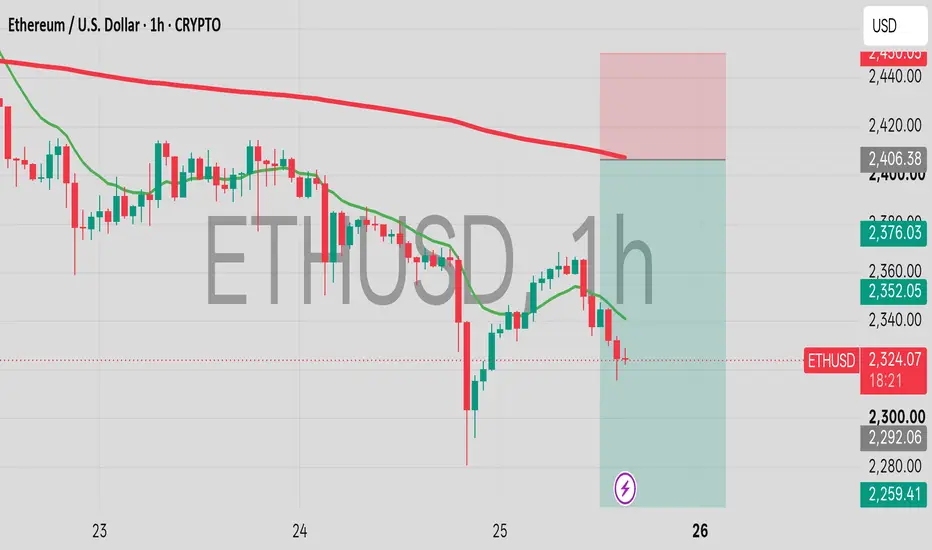
ETHUSD WEEKLY UPDATES LEVEL 25.10.2026..31.10.2026*🟡 ETH USD – WEEKLY UPDATE 🟡 ⏰*
*Validity: 25-10-26 to 31-10-26*
*🔹 Bullish Scenario (BUY)*
*• Trend Confirmation: Above 2530*
*• Targets: 2620 – 2730*
*🔻 Bearish Scenario (SELL)*
*• Trend Confirmation: Below 2230*
*• Targets: 2140 – 2000*
*🔄 Key Reversal / Entry Level: 2380*
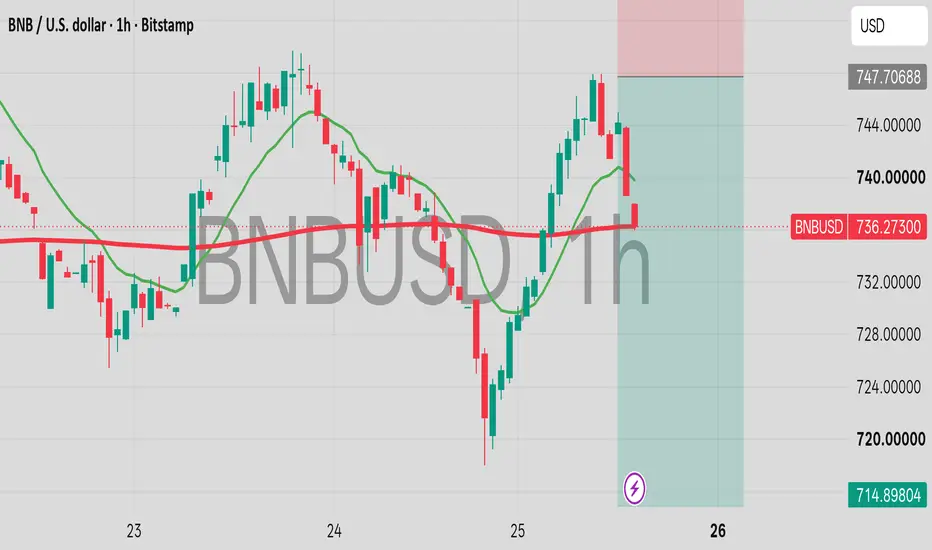
BNBUSD WEEKLY UPDATES LEVEL 25.10.2026..31.10.2026*🟡 BNB USD – WEEKLY UPDATE 🟡 ⏰*
*Validity: 25-10-26 to 31-10-26*
*🔹 Bullish Scenario (BUY)*
*• Trend Confirmation: Above 755*
*• Targets: 773 – 795*
*🔻 Bearish Scenario (SELL)*
*• Trend Confirmation: Below 705*
*• Targets: 688 – 670*
*🔄 Key Reversal / Entry Level: 730*
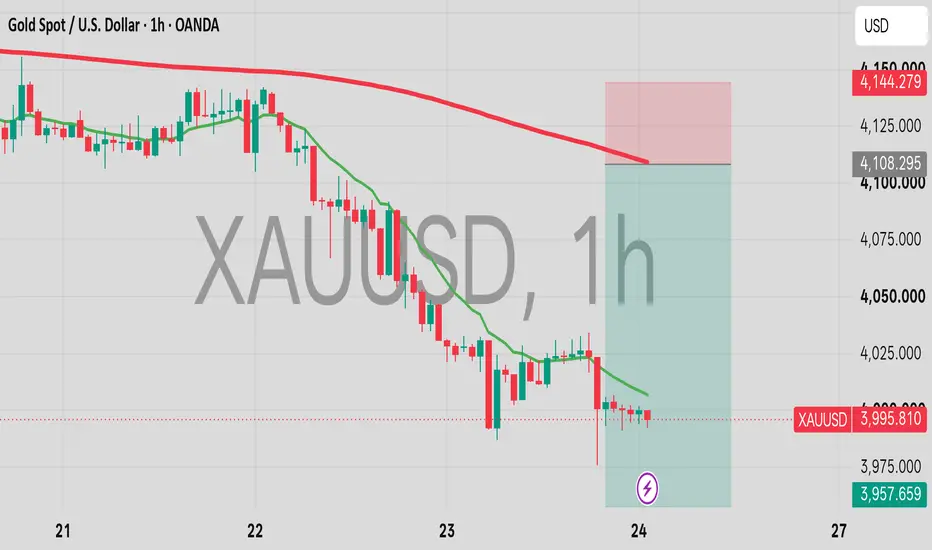
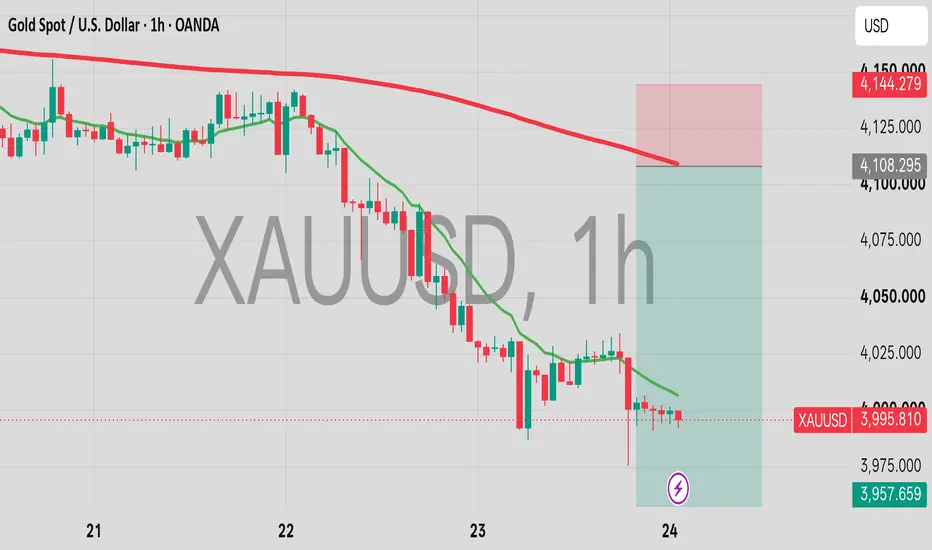
Xauusd gold Tommorow update level 26.10.2026.*🟡 XAU USD (GOLD) – TODAY UPDATE 🟡 ⏰*
*Validity: 26-10-26*
*🔹 Bullish Scenario (BUY)*
*• Trend Confirmation: Above 4035*
*• Targets: 4060– 4087*
*🔻 Bearish Scenario (SELL)*
*• Trend Confirmation: Below 3967*
*• Targets: - 3945-3914*
*🔄Key Reversal /Entry : 4002*
Xauusd gold weekly Updates level 26.10.2026..30.10.2026*🟡 XAU USD(GOLD) – WEEKLY UPDATE 🟡 ⏰*
*Validity: 26-10-26 to 30-10-26*
*🔹 Bullish Scenario (BUY)*
*• Trend Confirmation: Above 4194*
*• Targets: 4265 – 4345*
*🔻 Bearish Scenario (SELL)*
*• Trend Confirmation: Below 3910*
*• Targets: 3840 – 3710*
*🔄 Key Reversal / Entry Level: 4054*
BTCUSD WEEKLY UPDATES LEVEL 25.10.2026..31.10.2026*🟡 BTC USD – WEEKLY UPDATE 🟡 ⏰*
*Validity: 25-10-26 to 31-10-26*
*🔹 Bullish Scenario (BUY)*
*• Trend Confirmation: Above 85000*
*• Targets: 87000 – 89000*
*🔻 Bearish Scenario (SELL)*
*• Trend Confirmation: Below 77700*
*• Targets: 76000 – 72500*
*🔄 Key Reversal / Entry Level: 81300*