Sona BLW Precision ForgingsSona BLW Precision Forgings | Weekly Breakout Setup Near Multi-Month Resistance
Sona BLW Precision Forgings (SONACOMS) is approaching a key resistance zone near ₹721, following a strong reversal from its long-term base. The overall structure remains bullish, with buyers consistently defending higher levels.
Technical Observations
Strong recovery from the ₹379 support zone.
Clear higher highs and higher lows on the weekly timeframe.
Price is approaching a significant resistance level.
Momentum continues to improve with sustained buying interest.
A confirmed breakout above ₹721 could trigger the next phase of the long-term uptrend.
Key Levels
Current Price: ₹714.55
Breakout Level: ₹721
Immediate Support: ₹680–690
Major Support: ₹379
Long-Term Target Zone: ₹1,050+
Trading Plan
✔ Watch for a strong weekly close above ₹721.
✔ A successful retest of the breakout zone may offer a favorable risk-reward opportunity.
✔ Failure to sustain above ₹721 could lead to short-term consolidation before the next directional move.
Disclaimer: This analysis is shared for educational purposes only and should not be considered investment advice. Always conduct your own research and use proper risk management.
Community ideas
CMP: ₹1,385 | CDSL @ NSECMP: ₹1,385 | CDSL @ NSE
Structure
Stock was trading inside a falling channel from July 2025 highs (~₹1,850), with a rising trendline forming from the March 2026 low of ~₹1,200. Price has now broken out of the falling channel with strong volume — a clean structural shift after months of lower-highs.
The Setup Now
Post-breakout, price is doing what a healthy breakout should do — retesting the earlier resistance zone of ₹1,370–1,390, which now flips into support (classic role-reversal / polarity flip). Today's -1.79% dip into this zone is the retest candle, not weakness.
Key Levels
Retest support (must hold): ₹1,370–1,390 (earlier resistance → now support)
Deeper support: ₹1,340 (last defense before structure weakens)
Immediate resistance: ₹1,425 (today's high)
Breakout target: ₹1,500 (upper channel + measured move)
Extended target: ₹1,580–1,600 if 1,500 breaks with volume
Invalidation: 3D close below ₹1,340
Read
As long as ₹1,370–1,390 holds as support on closing basis, the breakout stays valid and the path of least resistance is up. A bounce from this zone with follow-through volume = green light for ₹1,500. If price slips below ₹1,340 on closing basis, breakout fails and stock re-enters the old range — that's the line in the sand.
Bias: Bullish above 1,370. Retest zone offers better R:R than chasing the breakout candle. Ideal entry = bullish reversal candle from 1,370–1,390 with rising volume.
Trigger: Watch how price behaves in this retest zone over the next 1–2 sessions. Hold = continuation. Break = failed breakout.
⚠️ Disclaimer: This is a personal technical view shared for educational and informational purposes only. It is not investment advice, buy/sell recommendation, or a solicitation to trade. I am not a SEBI-registered analyst. Markets carry risk; past chart patterns do not guarantee future outcomes. Please do your own research and consult a SEBI-registered financial advisor before taking any position. I / my family may or may not hold positions in the stock mentioned.
ADVAIT ENERGY TRANSITIONS — ELLIOTT WAVE ABC IN PROGRESSNSE:ADVAIT is unfolding a well-structured ABC corrective pattern on the daily timeframe. Within the C wave, a 5-wave impulse structure is clearly visible, and price appears to be completing wave 4, setting up for a final wave 5 rally toward the ₹2800 zone.
Wave structure breakdown
Wave A (impulse) - 13 bars up
Wave B (retracement) -21 bars — 1.6× of A
Wave 1 (in C) - 27 bars up
Wave 2 (in C) -13 bars — −16.39%
Wave 3 (in C) -21 bars up
Wave 4 (current) -assuming to winding up in 10–11 bars · −16.39%
Trade setup
Buy zone - ₹2080 – ₹2150
Target - ₹2800 (wave 5)
Invalidation
Below ₹1900
Expected timing
Wave 4 bottom: Jul 1–2
This analysis is for educational and informational purposes only and should not be considered investment advice. Market investments are subject to risks. Please consult your financial advisor before making any investment decisions.
Breakout ongoing – will gold confirm bullish reversal?Gold enters the new trading week with the first encouraging technical signal after breaking slightly above the descending H4 trendline that has capped price action throughout the recent decline. Although the breakout is still modest, it suggests selling pressure is gradually weakening and buyers are beginning to regain control.
The broader market structure, however, has not fully shifted into a bullish trend. The 4040–4060 area remains the most important resistance, where the H4 descending trendline and previous supply converge. This will be the decisive zone to determine whether the current recovery is merely a corrective bounce or the beginning of a larger bullish reversal.
As long as gold continues holding above the breakout area and forms higher lows, the bullish recovery scenario remains favored. A confirmed break and sustained acceptance above 4040–4060 would likely attract fresh buying momentum and open the way toward the psychological 4100 resistance, where the market will face its next major technical test.
For the coming sessions, the preferred strategy is to buy on pullbacks while price remains above the newly broken trendline. Scalping opportunities can still be taken within the current range, but traders should be prepared to shift into breakout trading once resistance is cleared with strong momentum.
📍 Key Levels
🔹 3970 – 3990 Major support zone and preferred buying area.
🔹 4015 – 4045 Breakout support and H4 trendline retest zone.
🔹 4040 – 4060 Key resistance. A confirmed breakout would strengthen the bullish structure.
🔹 4090 – 4105 Primary upside target before reassessing higher-timeframe momentum.
✅ Preferred Scenario Gold holds above the broken descending trendline. Buyers defend the 4015–4045 support region. A breakout above 4040–4060 confirms bullish continuation. The next upside objective is the 4100 area. Failure to hold above the breakout structure would delay, but not immediately invalidate, the recovery outlook.
BTCUSD Rejection at Major Resistance? Short Setup Around 65000BTCUSD Analysis: Watching the 65,000–65,100 Resistance Zone
BTCUSD is approaching a key resistance area between 65,000 and 65,100, where sellers could step in and trigger a bearish rejection.
Trade Idea
Entry Zone: 65,000 – 65,100
Bias: Bearish
Stop Loss: 65,710
Target 1: 64,000
Target 2: Below 64,000 (depending on momentum)
Why this setup?
Price is testing a significant resistance zone.
A rejection here could attract fresh selling pressure.
Risk-to-reward becomes attractive if the resistance holds.
Trade Management
Wait for bearish confirmation (such as a rejection candle, bearish engulfing pattern, or lower-timeframe market structure break) before entering. If BTC closes decisively above 65,710, the bearish setup becomes invalid.
Disclaimer: This is a technical analysis idea based on price action and key resistance levels. Always manage your risk and wait for confirmation before entering any trade.
Do you expect BTC to reject this resistance or break through it? Share your view below.
📌 Disclaimer:
This analysis is for educational purposes only and is not financial advice. Always manage risk and follow your trading plan.
Your feedback drives our content and keeps everyone trading smarter. Let’s make those pips together! 🚀
Happy Trading,
– The InvestPro Team
ETHUSD: Bullish Breakout & Structural Retest FormationETHUSD: Bullish Breakout & Structural Retest Formation 🚀
Description:
Ethereum (ETHUSD) has demonstrated a significant bullish breakout on the 4h timeframe, successfully clearing the upper boundary of its prolonged consolidation range. This impulsive move signals a clear shift in market sentiment from indecision to institutional accumulation. Price is currently establishing a technical retest of the broken range resistance, which is now acting as a new dynamic floor. We are monitoring this zone for bullish structural confirmation, anticipating that buyers will look to defend this level to push toward the identified overhead liquidity objectives.
Key Structural Levels:
🔴 Major Support / Invalidation Zone: 1,760 – 1,790 (Invalidation if price re-enters the consolidation range)
📈 Current Reaction Level: 1,849
🔵 1st Bullish Objective: 1,937 (1ST RESISTANCE)
🔵 2nd Bullish Objective: 2,031 (2ND RESISTANCE)
Trading Perspective:
We are looking for bullish order flow resumption on lower timeframes within this retest zone. Traders should watch for a clean bounce off the trendline support to confirm the trend's continuation. A breakdown back into the consolidation range would force us to re-evaluate the bullish bias, as it would indicate a potential fake-out.
This analysis is based on technical structure and market behavior, not financial advice.
Tips Music LtdTips Music Ltd. | Weekly Chart Approaching a Major Breakout
Tips Music is trading just below a significant resistance zone around ₹732, a level that has capped price advances in recent months. The recent recovery indicates improving momentum, and a breakout could trigger the next leg of the long-term uptrend.
Technical Observations
Strong recovery from the ₹481 base.
Higher highs and higher lows indicate a bullish structure.
Price is consolidating just below key resistance.
Buying pressure continues to build.
A breakout above ₹732 could confirm continuation of the uptrend.
Key Levels
Current Price: ₹710
Breakout Level: ₹732
Immediate Support: ₹680–690
Major Support: ₹481
Long-Term Target Zone: ₹980+
Trading Plan
✔ Watch for a decisive weekly close above ₹732 with sustained momentum.
✔ Pullbacks toward ₹680–690 may offer improved risk-reward if the bullish structure remains intact.
✔ A failure to hold above the breakout level after confirmation may indicate a false breakout.
Disclaimer: This analysis is shared for educational purposes only and should not be considered investment advice. Always do your own research before investing.
READ THIS BEFORE YOU BUY OR SELL GOLD TODAY!> ⚠️ I believe 90% of Gold traders are about to make the same mistake today. The chart looks obvious, the trend looks clear, and that's exactly why I think the market is preparing a psychological trap. Before you buy or sell Gold, spend the next few minutes reading this analysis carefully. If my theory plays out, today's move won't just trap early sellers—it could completely confuse both buyers and sellers before the real trend resumes.
As per my Monday analysis, the exact plan of action we were expecting is what the market delivered. The structure I had drawn played out almost perfectly, and the upside movement I expected from the $3981 level happened as anticipated. I hope everyone had a great trading day yesterday.
Now let's talk about the plan for Tuesday. Make sure you read this psychological analysis carefully because it will not only help you understand what could happen next in Gold but also improve your overall market psychology and learning.
Gold has now formed a potential lower high around $4040. However, the most important question is whether this is a genuine lower high or simply another psychological trap. Let's break it down.
The bullish Monday that we expected played out mainly because of the 4H timeframe structure, which I discussed in my weekly analysis. Since 6th July, Gold has been following a very clean bearish market structure. If you look at the 4H chart, you can clearly see a sequence of lower highs and lower lows. So far, this structure remains completely intact. There has been no break of structure and no obvious bullish trap yet.
Because of this, most price action traders have naturally started selling after seeing the latest lower high. They are expecting the bearish trend to continue, which is a logical conclusion based on the current structure.
However, I believe the market will trap these sellers before continuing lower. Instead of dropping immediately, I think Gold will first create confusion among price action traders by giving the appearance of a bullish break of structure. This move would attract fresh buyers while forcing early sellers out of their positions. Once enough liquidity has been created, I expect Gold to resume its bearish trend with a sharp downside move.
So my plan is very simple. I want to see Monday's high get broken. I want the market to break above the most recent lower high within the bearish structure. That breakout would deliver the first shock to sellers while attracting aggressive buyers. After that, I expect some consolidation before a strong bearish decline, most likely during the later part of the US session or around the Asian session open tomorrow.
The overall trend is still bearish. There is absolutely no doubt about that. The only thing I am expecting before the next leg down is a psychological trap that forces confident sellers out of the market before the trend continues.
Now let's discuss my exact plan for Tuesday.
Monday's high was around $4040, and after today's Asian session opened, Gold faced resistance near $4036 before attempting a small pullback. In my opinion, this was simply the market's first attempt to invite more sellers during the Asian session. The structure still looks bearish, so many traders have already entered fresh sell positions with their stop losses placed above Monday's high.
Personally, I still expect one more upside move. I believe Gold could sweep Monday's high before reversing. After that sweep, I expect price to decline toward the $4014-$4017 zone. From there, I believe we could see strong buying interest throughout the day.
Why do I expect a sweep of Monday's high before the reversal?
Because the early sellers have already entered with stop losses above $4040. If Monday's high gets taken out, all of those stop losses will be triggered. Once they see the market reverse again, many of them will emotionally re-enter their sell positions, often with even larger position sizes to recover their previous losses. That creates even more liquidity for the market.
This is something we often see in Gold. After stop losses are hunted, traders jump back into the same direction, believing they are getting a better entry. Many even increase their risk, hoping to recover losses and catch a bigger move. But before their targets are reached, the market reverses again and traps them even more aggressively.
I believe something very similar could happen today.
If the market rejects Monday's high after sweeping it, price action traders will become even more confident in the bearish structure. They will see the rejection as confirmation and continue adding to their short positions. Most of them will likely target $4000 or even last week's low.
However, I don't think Tuesday will be a straightforward selling day. Instead, I believe the market will first create the psychological trap I explained above. Gold could spend most of the day moving higher, creating confusion for both buyers and sellers, before revealing its real bearish move once the majority of traders become trapped.
I hope you enjoyed today's psychological analysis and found the logic behind it useful. More importantly, I hope this analysis helped you understand how market psychology works behind price movement.
Trade wisely, manage your risk properly, and always prioritize good money management over chasing profits.
Good luck, everyone!
What's your view on Gold? Let me know in the comments.
BUY TODAY SELL TOMORROW for 5%DON’T HAVE TIME TO MANAGE YOUR TRADES?
- Take BTST trades at 3:25 pm every day
- Try to exit by taking 4-7% profit of each trade
- SL can also be maintained as closing below the low of the breakout candle
Now, why do I prefer BTST over swing trades? The primary reason is that I have observed that 90% of the stocks give most of the movement in just 1-2 days and the rest of the time they either consolidate or fall
Trendline breakout in KAPSTON
BUY TODAY SELL TOMORROW for 5%
Nifty Trade Hello everyone firstly how are you all? hope everything's all right & didn't posted as you all know SEBI rule, so here a small view and analysis for Monday on nifty as don't hurry for trade on 1st candle in nifty on Monday rather than wait a little, I would say 1hr till 10:15am as a "Gap down" opening is expected due to latest strikes & 24400 a strong resistance at top with high oi & The "4-Banking major(s)" result came out positive but still there's a chance of gap down opening & 24200-150 a support zone if breaks then a fall can be seen NSE:NIFTY
Better to wait a little then let index decide the move then trade as the 2 situation/scenario shared may/may not happen as this is my personal view and observation which includes various technical tools and news and other sources of data.
DISCLAIMER:- I am not a "SEBI" registered analyst and idea shared here is purely for educational purpose and doesn't intend that market will move as per the direction or path shared if it does then it will be coincidence, so before taking a trade please consult with your "FINANCIAL ADVISOR"
Note:- The observation includes various tools, news, reports and data & doesn't guarantee the exact move in index and i don't have any overnight/carry forward position in nifty & idea shared is to create a awareness and not panic amongst traders
"if like my idea please show your support and follow", Thank you..
Banknifty Intraday Analysis for 21st July 2026NSE:BANKNIFTY
Index is the range between 57300 - 58600 range and range bound moment is expected as long as the index will be in this range.
The upward moment may lead the Index to 58600 – 58700 resistance range in upward momentum and if the index crosses and sustains above this level then may reach near 59300 – 59400 range.
On the contrary, The downward moment may drag the Index to 57300 – 57200 support range in downward momentum and if this support is broken then the index may tank near the 56500 – 56400 range.
BUY TODAY SELL TOMORROW for 5%DON’T HAVE TIME TO MANAGE YOUR TRADES?
- Take BTST trades at 3:25 pm every day
- Try to exit by taking 4-7% profit of each trade
- SL can also be maintained as closing below the low of the breakout candle
Now, why do I prefer BTST over swing trades? The primary reason is that I have observed that 90% of the stocks give most of the movement in just 1-2 days and the rest of the time they either consolidate or fall
Trendline breakout in CYIENTDLM
BUY TODAY SELL TOMORROW for 5%
natural gas 273 274 order block lending supportas traded before i said there is a strong bullish order block near 273 274 till it is breached sell will not be activated
so buy with sl 272 for liqidity target at 289, the place with equal high
buy here or on dip with strict sl 272 if 272 breached than sell target will be 266 260 254
One Market, Infinite TrendsHave you ever noticed something strange while looking at charts? You open the 5-minute timeframe and see a strong uptrend. Then you switch to the 1-hour chart, and the market suddenly looks like it is moving sideways. Move to the daily timeframe, and now it looks like a downtrend. The obvious question is, **which one is correct?
The surprising answer is that they are all correct . The market does not have just one trend. It has many trends happening at the same time. Understanding this simple idea can completely change the way you read charts and explain why experienced traders rarely rely on only one timeframe.
Every Timeframe Tells a Different Story
Think of standing in front of a mountain. If you stand very close, you only see rocks, trees, and small details. As you move farther away, you begin to see the entire mountain. Neither view is wrong. You are simply looking at the same object from a different distance.
Charts work the same way. A lower timeframe shows every small battle between buyers and sellers. A higher timeframe hides that noise and reveals the bigger picture. The market has not changed. Only your perspective has.
The Market Is Fractal:
One of the most fascinating characteristics of financial markets is that they are fractal. This means similar patterns repeat themselves across different timeframes.
A breakout on the 5-minute chart may look almost identical to a breakout on the daily chart. Trends, pullbacks, consolidations, and reversals appear everywhere, whether you are looking at one minute or one month.
It is like zooming into the branches of a tree. Every branch looks similar to the whole tree. The pattern repeats itself at different sizes.
This is why traders can use many of the same price action concepts on almost any timeframe.
Why Trends Can Coexist?
Many beginners believe there can only be one trend at a time. In reality, several trends can exist together without contradicting each other.
Imagine climbing a staircase.
Each step moves upward.
At the same time, you may walk slightly left or right while climbing.
From close up, your movement looks different.
From a distance, everyone can clearly see you are moving upstairs.
The market behaves in a similar way.
The daily chart may be in a strong uptrend.
Inside that uptrend, the 1-hour chart may show a temporary pullback.
Within that pullback, the 5-minute chart may even have its own short-term uptrend.
Each timeframe is simply showing a smaller part of the bigger picture.
The Zoom Illusion
Imagine opening Google Maps.
At the highest zoom level, you can see your entire country.
Zoom in, and you only see your city.
Zoom in again, and you see individual streets.
Finally, you see a single building.
Nothing has changed except your level of zoom.
Charts work the same way.
Changing timeframes is simply changing your zoom level.
The market itself remains the same.
Which Timeframe Is the Best?
This is one of the most common questions traders ask.
The truth is that no timeframe is better than another.
A scalper may only care about the 1-minute chart.
A swing trader may focus on the 4-hour and daily charts.
A long-term investor may rarely look below the weekly timeframe.
The best timeframe is the one that matches your trading style.
Instead of searching for the "perfect" timeframe, successful traders learn how different timeframes work together.
The Bigger Picture Always Matters:
Imagine reading a single sentence from a book without knowing the rest of the story. It is easy to misunderstand its meaning.
The same happens in trading.
Looking at only one timeframe can hide important information. A perfect buy setup on the 15-minute chart might actually be trading directly into a strong resistance level visible on the daily chart.
This is why experienced traders often begin with higher timeframes to understand the overall market direction before moving to lower timeframes to fine-tune their entries.
My Thoughts:
The market does not change when you switch timeframes. Only your perspective changes. Every timeframe reveals a different layer of the same story. Lower timeframes show the details, higher timeframes reveal the bigger picture, and together they create a complete view of the market.
The next time you see two charts showing different trends, remember this simple idea.
The market is not contradicting itself. You are simply looking at the same story from different distances.
By @BrightRally_Research on @TradingView
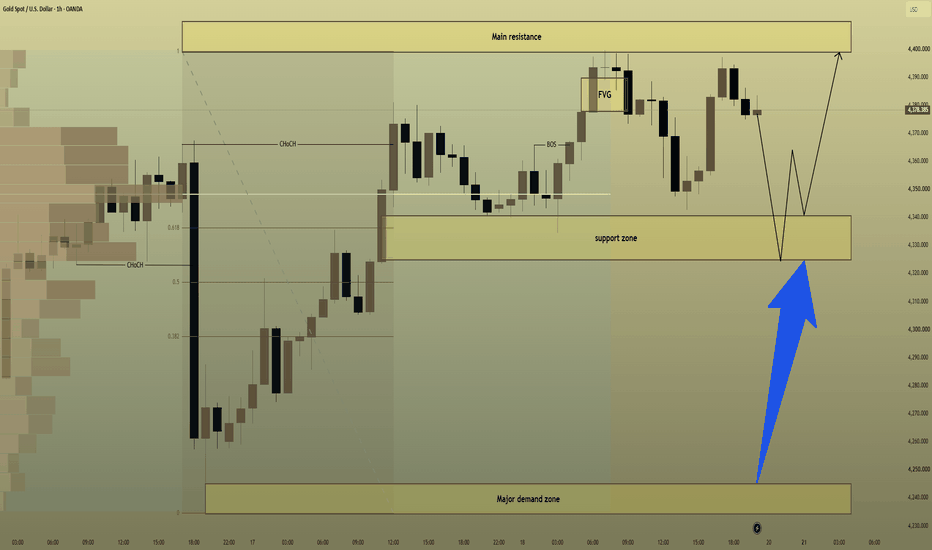
XAUUSD – Gold Is Trying To Hold 4,000, But Sellers Are Still XAUUSD – Gold Is Trying To Hold 4,000, But Sellers Are Still Watching
Gold is trying to stabilize after a heavy bearish week.
Price is currently trading around 4,012, holding close to the Buy Liquidity zone near 4,000. This area is very important because it sits near the lower part of the current structure and may decide whether gold can recover, or continue the broader bearish pressure.
The chart is showing a small recovery attempt, but the market is not fully bullish yet. Sellers are still active above, especially near the Fibonacci and resistance zones.
FUNDAMENTAL ANALYSIS
Gold is still facing downside risk as the U.S. dollar remains supported by safe-haven demand and inflation concerns.
Tensions between the U.S. and Iran continue to create market uncertainty. Higher oil prices can keep inflation pressure alive, which may support the idea that the Fed keeps interest rates higher for longer. This is usually a headwind for gold.
For now, gold has found a short-term floor, but the recovery still needs confirmation.
TECHNICAL ANALYSIS – SMC + FIBONACCI
From an SMC perspective, gold is reacting from the lower liquidity area after a strong decline. The Buy Liquidity zone around 4,000 is now the key support for buyers.
If price continues to hold above this zone, gold may attempt a recovery toward the first resistance around 4,028. Above that, the Sell Fibonacci zone around 4,048 becomes the next important test.
The stronger resistance sits around 4,069, where sellers may defend again. If price reaches this zone and rejects, the market may continue to respect the broader bearish structure.
However, if gold breaks below 4,000 with strong momentum, the recovery idea becomes weak. In that case, sellers may push price back toward the lower channel area.
KEY PRICE ZONES
Current price: 4,012
Buy Liquidity zone: 4,000
Short-term support: 4,000 – 4,012
Nearest resistance: 4,028
Sell Fibonacci zone: 4,048
Strong resistance: 4,069
Bearish pressure returns: Below 4,000
Invalidation for recovery view: Below 3,960
TRADING SCENARIOS
Buy Scenario – Short-Term Recovery
Buy Zone: 4,000 – 4,012
Entry: Bullish rejection, liquidity sweep, or lower-timeframe CHoCH
SL: Below 4,000
TP1: 4,028
TP2: 4,048
TP3: 4,069
Sell Scenario – Reaction From Resistance
Sell Zone: 4,048 – 4,069
Entry: Bearish rejection, failed breakout, or lower-timeframe bearish CHoCH
SL: Above 4,069
TP1: 4,028
TP2: 4,000
TP3: Lower channel area if momentum expands
Breakdown Sell
Condition: Clean break and hold below 4,000
Target: 3,960 and lower liquidity
MY VIEW
Gold is trying to hold the 4,000 area, but sellers have not disappeared.
The Buy Liquidity zone is the most important area right now. If buyers defend it, gold may recover toward 4,048 and 4,069. But if price fails to hold above 4,000, the bearish pressure can return quickly.
For me, this is not a place to chase. It is a place to wait for reaction.
Gold is standing between short-term recovery and another breakdown.
Do you think gold will defend 4,000 and recover, or will sellers break this level again?
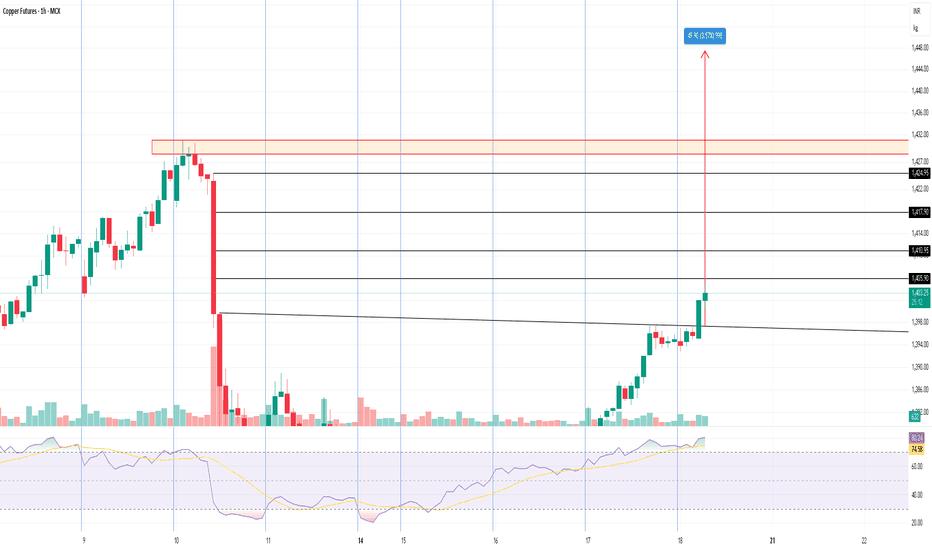
Crude Oil:Why the Same News Makes Some Stocks Rise and some FallOverview
Here's something a lot of new traders miss: when crude oil prices move, it doesn't affect the stock market equally. In fact, the exact same crude oil news can be great news for one stock and terrible news for another, on the very same day. Let's break down why, in simple terms. The chart above shows Crude Oil Futures (MCX) itself, for reference — the infographic explains how equity stocks react to moves like these.
Why Does Crude Oil Even Matter to Indian Stocks?
India imports most of its crude oil from other countries. That single fact is the reason crude oil prices ripple through so much of our market. When oil prices move, the cost of doing business changes for a huge number of companies — just not all in the same direction.
The Two Sides of Crude Oil
Think of Indian companies as falling into two teams whenever crude oil price moves:
Team 1: Companies That Suffer When Oil Goes Up
These are companies that use crude oil or its by-products as a raw material or major cost.
Paint companies (crude is a key ingredient in paint)
Airlines (jet fuel is their biggest cost)
Tyre companies (rubber processing uses crude derivatives)
Logistics and transport companies (fuel costs eat into margins)
For these companies, rising crude oil is bad news — their costs go up, and profits often come down.
Team 2: Companies That Benefit When Oil Goes Up
These are companies that produce oil and gas.
Oil exploration companies (they sell crude, so higher prices mean more revenue)
Government-owned oil exploration/production companies (same logic — they benefit when the crude they produce sells for more)
For these companies, rising crude oil is good news — they're selling the very thing that just became more valuable.
Here's the Interesting Twist
Now, notice something important: oil marketing companies (the government-owned ones that refine crude and sell petrol/diesel to us) are a special case. Even though they're technically "in the oil business," they don't always benefit when crude oil rises. Why? Because they can't always raise petrol/diesel prices at the pump fast enough to match their rising costs. So these companies can actually get squeezed on margins in the short term, even while pure oil producers are celebrating.
This is why it's not enough to just know "oil went up" — you need to know where a company sits in the whole chain: does it produce oil, refine it, or use it?
A Simple Way to Remember This
Ask yourself one question about any company: "Does rising crude oil raise this company's costs, or raise its revenue?"
Raises costs → likely to struggle when oil rises (Paint, Airlines, Tyres, Logistics)
Raises revenue → likely to benefit when oil rises (Oil exploration/production companies)
Somewhere in between → oil marketing/refining companies, where margins depend on how fast they can pass costs to customers
Why This Matters for Your Trading
The next time you see crude oil prices jump in the news, don't assume "the whole market will react the same way." Instead, ask which of your watchlist stocks belong to which team. This one habit can help you understand market reactions that might otherwise seem confusing or random.
Beginner's Lesson
Markets aren't one big machine that reacts the same way to every piece of news. Different companies have different relationships with the same raw material. Learning to spot these relationships — instead of assuming everything moves together — is one of the simplest ways to start thinking like an experienced trader.
Conclusion
Crude oil is a great example of how one single commodity can create very different stories across the stock market, all at once. Next time oil makes headlines, take a moment to think about who wins and who loses — it'll make market movements feel a lot less random.
The infographic and chart shown are for illustration and educational purposes only. This is not investment advice and not a recommendation to buy or sell any stock or commodity. Please do your own research or consult a financial advisor before making any investment decisions.
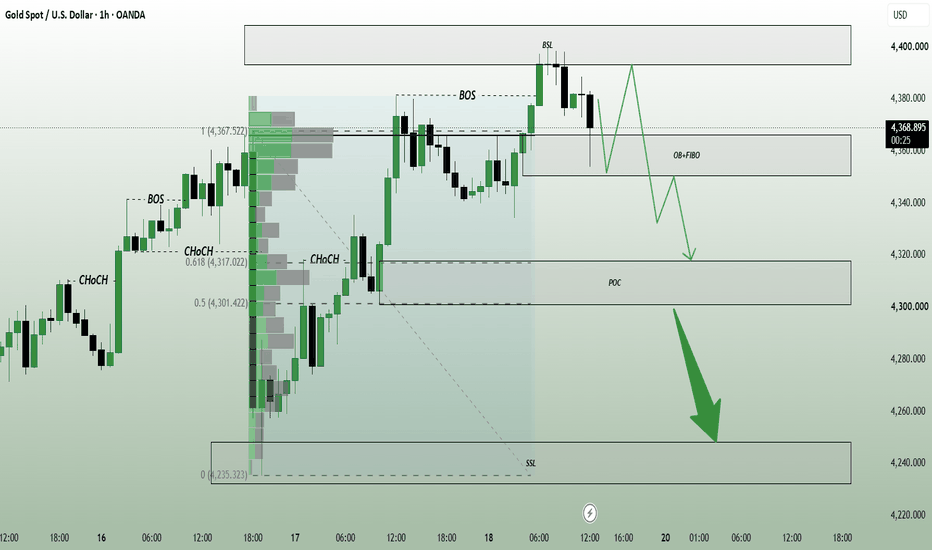
XAUUSD [1H]: Bearish Rejection at Supply Zone & Trendline ?🔍 Market Structure & Technical Breakdown
Overall Bias: Bearish. The asset experienced a clear Change of Character (CHOCH) at the top left, followed by a sustained Break of Structure (BOS) to the downside.
The Correction: Price temporarily rallied out of a Downward Channel via a Market Structure Shift (MSS), but failed to sustain higher prices, putting the broader bearish momentum back in control.
Confluence Zone: We are currently looking at a high-probability Short Setup forming around the $4,020 - $4,040 region. This setup is heavily reinforced by a strong confluence of factors:
Descending Trendline: Price is reacting directly underneath a well-respected, multi-touch bearish trendline.
Supply Zone: The blue horizontal box represents a key historical order block/supply zone where sellers have previously stepped in aggressively.
📉 Trading Setup (Short Opportunity)
Execution Area: Sell limit or price action rejection within the blue Supply Zone ($4,020 - $4,035), aligned with the descending trendline touch.
Invalidation/Stop Loss: A clean daily close or sustained hourly candle body closing above the trendline and supply zone (above $4,045).
Take Profit (Target): The recent local swing low liquidity pool at $3,965.
NIFTY: 24,200 Is the Battlefield. 24,250 Decides the Next Move.NIFTY: 24,200 Is the Battlefield. 24,250 Decides the Next Move.
I'm entering today's session with one level in mind—24,200.
On the daily chart, NIFTY is trading comfortably above the 20 SMA (24,106), 50 SMA (23,830) and 100 SMA (23,925), which keeps the broader trend constructive. However, the index is still below the 200 SMA (24,813), meaning the long-term trend has not turned bullish yet.
The daily pivot stands at 24,213.
- R1: 24,291
- R2: 24,344
- R3: 24,421
- S1: 24,161
- S2: 24,083
- S3: 24,031
Technically, the indicators are sending mixed signals:
- RSI (14): 55.58 – Positive but not overbought.
- MACD: -1.33 – Still bearish, showing momentum hasn't fully shifted.
- ADX: 10.19 – Weak trend, suggesting range-bound moves can continue until a breakout.
The option data also supports a balanced market. PCR for the current expiry is 1.38, indicating Put writers continue to dominate. However, a high PCR alone is not enough—it needs price confirmation.
On the 3-minute chart, buyers continue to defend higher lows, but the market is repeatedly stalling around 24,240–24,250. This makes 24,250 the immediate breakout level.
My trading plan is straightforward:
- Above 24,250: I expect momentum to improve, with room toward 24,291, 24,344, and potentially 24,421.
- Below 24,200: The intraday structure weakens. A sustained break below 24,200 could invite aggressive selling toward 24,160 and 24,080, where the next support zones lie.
📚 Trading Lesson
A market doesn't become bullish because indicators are green.
It becomes bullish when it starts holding above important price levels.
Today, 24,200 is support. 24,250 is confirmation. Until one of these levels decisively breaks, expect the market to respect this range more than predictions.
XRPUSD: Bearish Trendline Rejection & Structural PullbackXRPUSD: Bearish Trendline Rejection & Structural Pullback 📉
Description:
XRP (XRPUSD) is showing clear signs of a bearish rejection from a descending trendline on the 2-hour timeframe. After an attempt to break higher, the price failed to maintain momentum and is now showing weakness, indicating that the trendline continues to act as a significant dynamic barrier. We are monitoring the price as it reacts to this rejection, with eyes on potential moves toward the lower structural support levels.
Key Structural Levels:
🔴 Major Resistance / Invalidation Zone: 1.118 – 1.168
📉 Current Reaction Level: 1.082
🔵 1st Resistance Objective: 1.118
🔵 2nd Resistance Objective: 1.168
Trading Perspective:
We are looking for bearish order flow to continue following this trendline rejection. A failure to reclaim the trendline confirms the bearish bias. Traders should watch for a clean break below recent lows to confirm further downside momentum. Should the price reclaim these resistance levels, the bearish thesis would need to be re-evaluated.
This analysis is based on technical structure and market behavior, not financial advice.
And the volatility continues..As we can see NIFTY again opened weak and remained sideways throughout the day. We clearly analysed that until and unless NIFTY breaks and sustains either of the mentioned levels, it would likely remain volatile. So keep a close watch of these levels and plan your trades accordingly.
Finnifty Intraday Analysis for 21st July 2026NSE:CNXFINANCE
Index is near support of 26400 - 26300 zone and uptrend is expected as long as index is above this support zone.
The upward movement may lead the Index to 26850 - 26900 resistance range and if the index crosses and sustains above this level then may reach near 27150 - 27200 range.
On the contrary, The downward moment may drag the to 26400 – 26350 support range and if this support too is broken then index may tank near 26100 – 26050 range.