Parallel Channel
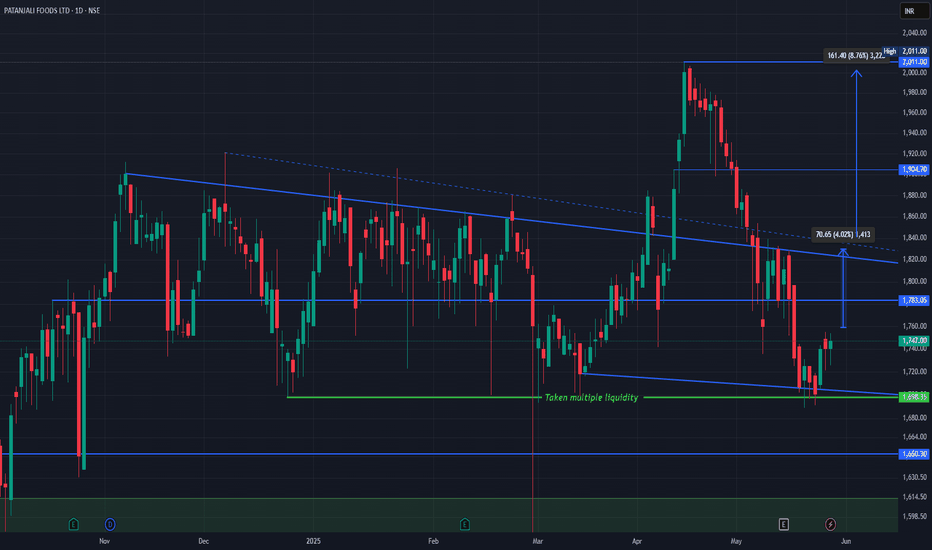
Patanjali Foods Ltd (NSE: PATANJALI) technical chart breakdown.Patanjali Chart Structure & Price Action
The stock has been trading within a descending channel, bounded by the blue trendlines.
It recently bounced from a major demand zone (~₹1,698) marked by the green support line that has absorbed liquidity multiple times ("Taken multiple liquidity").
Price is now slowly recovering from this base.
Current Scenario
CMP: ₹1,747
Immediate Resistance:
₹1,783 (horizontal level)
₹1,818–₹1,835 zone (upper boundary of the falling channel)
Break and sustain above ₹1,783–₹1,835 could trigger a trend reversal.
Upside Targets
Target 1: ₹1,830/Target 2: ₹1,904
Previous structural high Target 3: ₹2,011 Recent swing high Total upside from breakout: ~8.76%
Support Levels
₹1,698 – Critical demand zone (green)
₹1,650 – Next strong support
₹1,570 – Long-term support base (green zone)
Simple Explanation
Patanjali Foods rebounded from a high-liquidity support area and is now showing signs of bullish recovery. A breakout above ₹1,783 could take it back to the ₹1,900–₹2,000 range. Risk is well-defined below ₹1,698. Watch for volume and price action confirmation near the upper channel.
Like, comment your thoughts, and share this post
Explore more stock ideas on the right hand side your feedback means a lot to me!
Disclaimer: This post is for educational purposes only and should not be considered a buy/sell recommendation.
ICICI Bank Powers to Lifetime High Within a Strong Bullish ChannTopic Statement:
ICICI Bank is on a robust bull run, steadily advancing within a strong uptrending channel.
Key Points:
* The stock is moving upwards in a strong bullish uptrending channel, making channel-based trading highly effective
* It is currently trading at its lifetime high, reflecting continued strength and investor optimism
* The price has highly overextended above the 200-day EMA, indicating the stock is highly overbought and may be poised for a cooling-off phase
SURAJEST : Short Term Trade (1-3 Months)#SURAJEST #parallelchannelbreakout #breakoutstock #trendingStock #Momentumstock
SURAJEST : Short Term (1-3 Months)
>> Parallel Channel Breakout
>> Breakout Candidate
>> Trending Stock in Momentum
>> Good Strength in Stock
>> Recent Volume Buildup
>> Good Upside Potential
Swing Traders can lock profit at 10% and keep trailing
Disc : Stock charts shared are for Learning purpose and not a Trade recommendation.
Pls consult a SEBI Registered Advisor before taking position in it.
MANBA : Momentum stock (swing pick)#MANBA #breakoutstock #vcppattern #parallelchannelbreakout #momentumstock
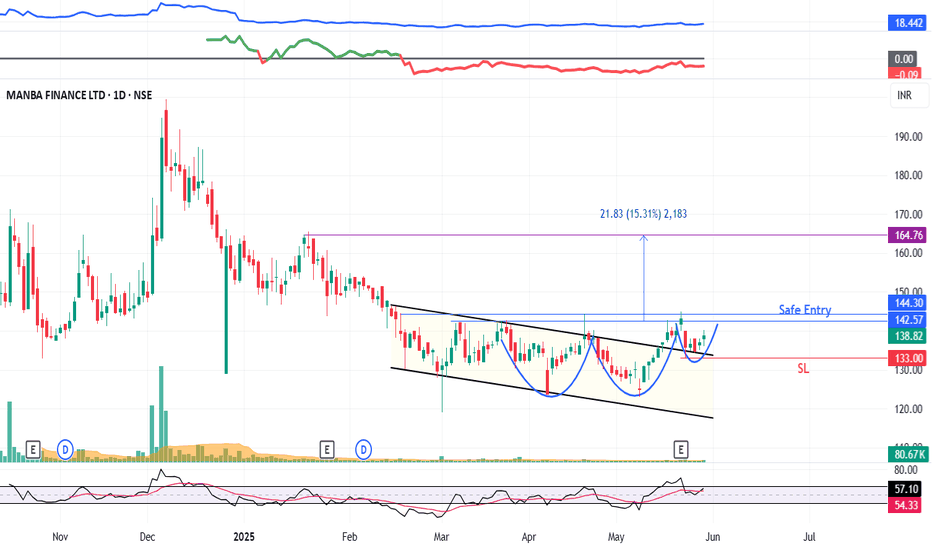
MANBA : Swing Trade
>> Parallel Channel Breakout
>> VCP pattern formation
>> Trending Stock
>> Breakout Candidate
>> Good Strength & Volumes Dried up
Swing Traders can lock profit at 10% & keep trailing.
Disclaimer : Stock Charts shared are for Learning Purpose and not a Trade recommendation. Consult a SEBI Registered Advisor before taking position in it.
Even Technical Analysis is not 100%, so I reserve the Right to be wrong.
: Plastiblends India Ltd (PLASTIBLEN)- Descending Channel Patter🚀 Breakout Watch: Plastiblends India Ltd (PLASTIBLEN)
📍 CMP: ₹211.75 📊 Volume: 80.3K 📅 29 May 2025
Plastiblends has just triggered one of the cleanest Descending Channel breakouts seen lately — and it comes with heavy volume, structure integrity, and visible accumulation signs. This is a high-quality price action setup worth tracking closely.
🔹 1. Pattern Structure – Descending Channel (9 Months)
Price has been trapped in a downward-sloping channel for nearly 9 months, respecting a consistent pattern of lower highs and lower lows.
But here’s the key: since early April, price has been forming higher lows, grinding toward the upper trendline resistance. Today, the stock closed above the channel, clearing the red resistance trendline decisively.
This marks the end of a long consolidation cycle and could be the beginning of a trend reversal breakout.
🔹 2. Volume Behavior – The Tell Before the Move
Volume has quietly been building over the past 3 weeks — signaling silent accumulation. Today's breakout came on 80.3K volume, significantly above the average of the past few months.
What makes this special is that volume surged before price, a classic sign of smart money entering before confirmation.
🔹 3. Breakout Candle – Strength & Intent
Today’s candle is powerful — wide-range, full-body, with minimal upper wick, closing +9.09% higher. This kind of momentum off a multi-month pattern rarely goes unnoticed. The breakout was clean, no wicky rejections, no fakeouts.
This isn’t just a breakout — this is a price declaration.
🔹 4. Trade Setup – Structure-Based Plan
📌 Entry: ₹210.5–₹214 (post breakout)
🛑 Stop-loss: ₹193 (below recent base)
🎯 Target Zone: ₹240 (swing), ₹265+ (measured move)
Measured move:
Channel height ≈ ₹265 – ₹170 = ₹95
Breakout from ₹210 + ₹95 = ₹305 (longer-term potential)
Risk:Reward → Risk = ₹17, Reward = ₹54+,
So you’re looking at an R:R of ~1:3+
ITC Approaches Key Support Within Mild UptrendTopic Statement:
ITC is trading in a range with a slight bullish tilt, presenting structured opportunities within a defined channel.
Key Points:
* The stock is moving within a slightly bullish up-trending channel, making it suitable for channel-based trading
* A head and shoulders candlestick pattern is emerging, which may signal potential short-term weakness
* The price is nearing the 180-day EMA, making levels near or below it attractive for long-term buying opportunities
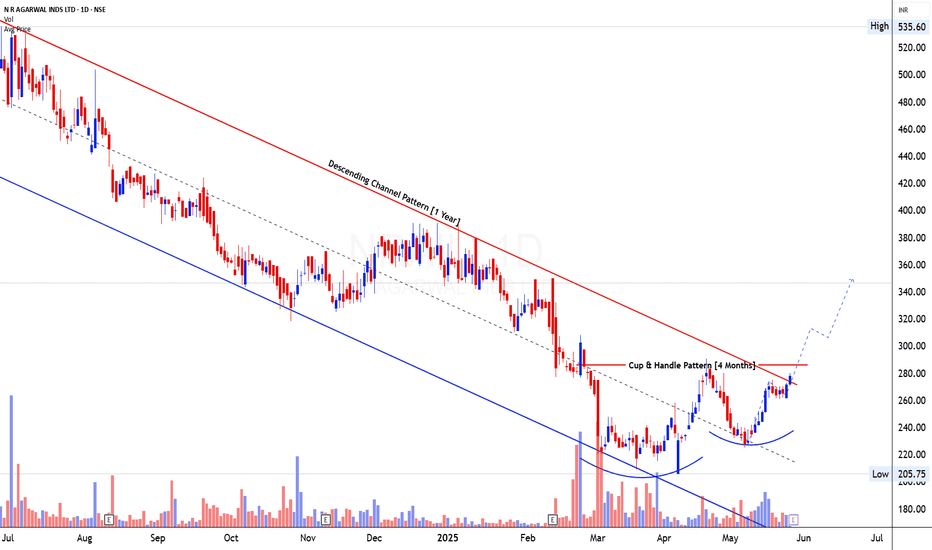
N R Agarwal Industries Ltd (NRAIL)- Cup and handle & Descending🚨 Breakout Watch: N R Agarwal Industries Ltd (NRAIL)
📍 CMP: ₹278.05
📊 Volume: 9.2K
📅 27 May 2025
NRAIL is at a critical technical juncture with two bullish patterns aligning at the same level — a textbook Cup & Handle breakout forming at the top of a 1-year Descending Channel. This is a rare dual-pattern setup, showing both reversal and trend transition.
🔹 1. Pattern Structure
Over the past 12 months, the stock trended inside a Descending Channel with clean respect to both trendlines — lower highs and lower lows played out until Feb 2025. Then came a shift…
From March onward, price started rounding off into a Cup base, forming a strong foundation around ₹210–₹220. In April-May, the price entered a healthy pullback, creating a Handle — with higher lows and tight ranges.
Now, the price is sitting right at the neckline of the Cup (~₹280), which is also the resistance of the descending channel. This is a high-probability breakout zone.
🔹 2. Volume Analysis
The volume behavior has been constructive. During the Cup base, volume stayed muted — a sign of seller exhaustion. During the Handle, we saw tight candles with low volume dips — typical of institutional absorption.
Now, volume is picking up. Today’s breakout candle printed 9.2K shares, which is higher than average for this stock and confirms interest building at resistance.
🔹 3. Breakout Candle & Price Behavior
The breakout candle today gained +2.44%. It's not a perfect marubozu, but it has a solid real body and closed strong near the highs. The last 5 sessions show clear momentum build-up — and no signs of a bull trap or false breakout yet. Structure is clean and controlled.
Watch for a strong close above ₹285–₹290 to confirm the breakout.
🔹 4. Trade Plan (Based on Structure)
Entry: ₹282–₹290 (Breakout confirmation zone)
Stop-loss: ₹258 (Just below the handle base)
Target 1: ₹340 (Cup height measured move)
Target 2: ₹360–₹390 (Channel breakout potential)
Measured move logic: Cup depth is ₹70 → ₹280 + ₹70 = ₹350
Descending Channel range is nearly ₹180 → Target opens up towards ₹460 long-term.
This gives a Risk:Reward of ~1:2.5 to 1:3+, which is very attractive.
🔹 5. Why This Matters
This is more than just a breakout. This is a full structure shift — going from a year-long downtrend to a potential new trend. When a Cup & Handle breakout aligns with a channel breakout, momentum can be explosive.
#Trading #Investing #Stocks #TechnicalAnalysis
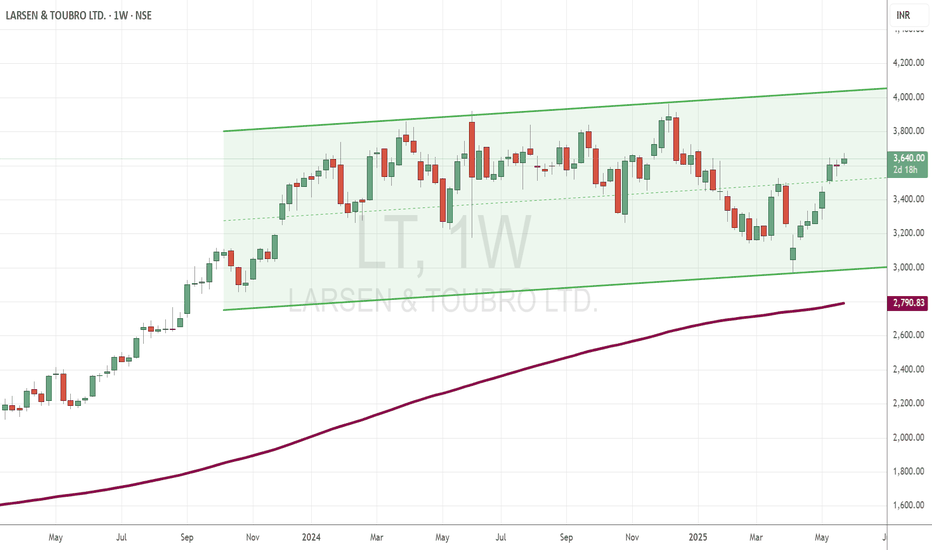
L&T Maintains Bullish Momentum Within a Rising ChannelTopic Statement:
L&T is in a strong bull run, consistently moving higher within a clear uptrending channel.
Key Points:
The stock is moving upwards in a bullish uptrending channel, making channel-based trading straightforward
It continues to gain momentum as it respects the channel boundaries
The price has overextended above the 200-day EMA, suggesting the stock is highly overbought and may face short-term resistance
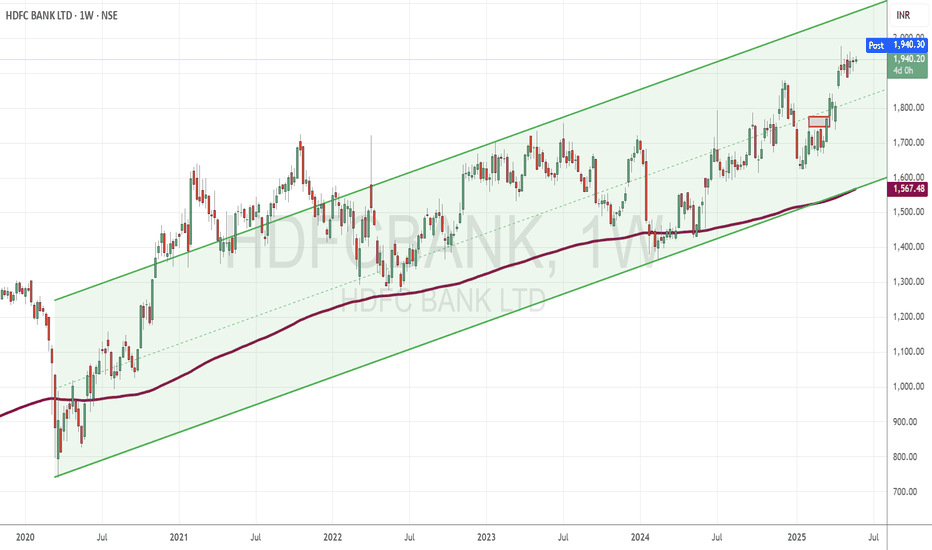
HDFC Bank Surges to Lifetime High Within a Defined Bullish ChannTopic Statement:
HDFC Bank is on a strong bull run, steadily climbing within a well-defined uptrending channel.
Key Points:
* The stock is trading within a bullish uptrending channel, offering clear opportunities for channel-based trading
* It is currently at its lifetime high, reflecting strong investor confidence and momentum
* The price has significantly overextended above the 200-day EMA, indicating the stock is highly overbought and may be due for consolidation or a pullback
HDFC LIFE: NOT A LONG, A FAKE BREAK OUT???1. NSE:HDFCLIFE broke the previous ATH at 780 and weekly candle closed above it
2. Retails are excited to look at this and might buy in bulk on Monday.
3. There is a perfectly fitting channel and the channel top near 810.
4. Wait for the price action near the channel.
5. Possibility of a fake break down from the channel top and a great opportunity to short if close below 770 after touching the channel top.
6.So, wait and watch and enjoy the show!!
RelianceDaily chart is showing price is at double bottom support. In lower time frame price is moving inside a descending channel.
Buy above 1411 with the stop loss of 1401 for the targets 1421, 1434, 1446 and 1458.
Sell below 1390 with the stop loss of 1401 for the targets 1380, 1366, 1354 and 1340.
Always do your own analysis before taking any trade.
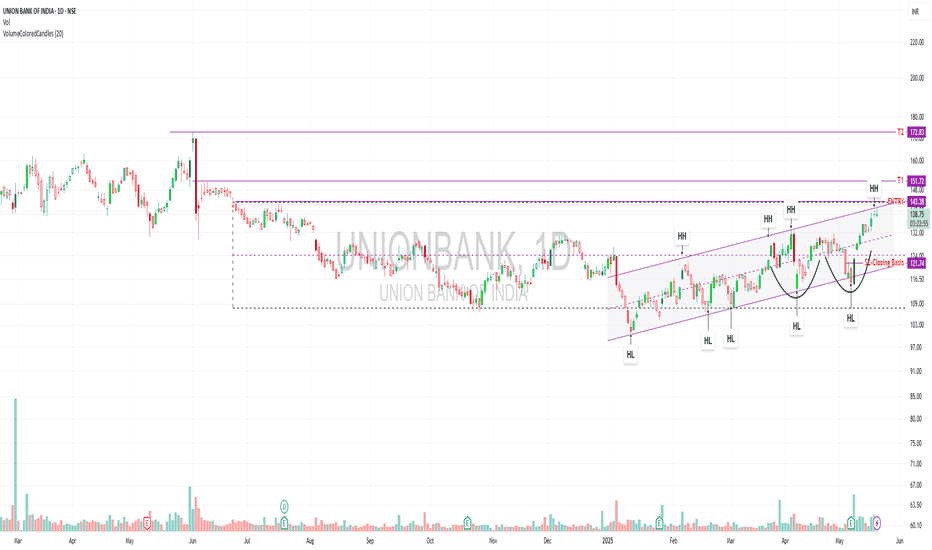
UNIONBANK – Positional Breakout SetupPattern: Double Bottom | W Pattern Inside Channel
Trend: HH-HL Structure | Trading Inside Ascending Channel
Volume: Noticeable Build-Up
DMAs: Trading Above Key DMAs
Stage: Aiming for Stage 2 Breakout
The stock is forming a double bottom (W pattern) inside a well-respected ascending channel, with a clean higher high–higher low structure and visible volume build-up. It's now trading above key DMAs, hinting at underlying strength. With price approaching a key breakout zone, it looks primed for a potential Stage 2 continuation.
🔔 Trade Plan
Entry: ₹143.38+ (on breakout and daily close above)
Stop Loss: ₹121.74 (closing basis )
Target 1: ₹151.72
Target 2: ₹172.83
Risk–Reward Insight 🎯
Risk from entry to SL is ₹21.64.
Reward to Target 1 is ₹8.34 (~1:0.38)
Reward to Target 2 is ₹29.45 (~1:1.36)
While T1 gives a conservative move, the bigger play lies in T2 — the upper edge of a 1-year trading range. This is where smart money tends to scale in.
💡You don’t have to go full throttle on day one.
✅ Consider buying a test quantity above ₹143.38 to assess breakout strength.
If the move confirms with strong follow-through and volume, you can look to add on dips or above T1 with a tighter trailing SL.
This approach helps you ride trends without overexposing yourself early. The key is to stay mechanical and let the setup prove itself.
⚠️ Risk Management is Non-Negotiable
Never ignore your stop loss.
Don't chase.
Stick to your plan and size positions according to your risk appetite.
This setup looks technically clean — but remember: even the best setups fail without confirmation. Let price and volume lead the way.
📌 Disclaimer:
This is not investment advice. I am not a SEBI-registered advisor. All content is for educational purposes only. Please do your own analysis and always trade responsibly.
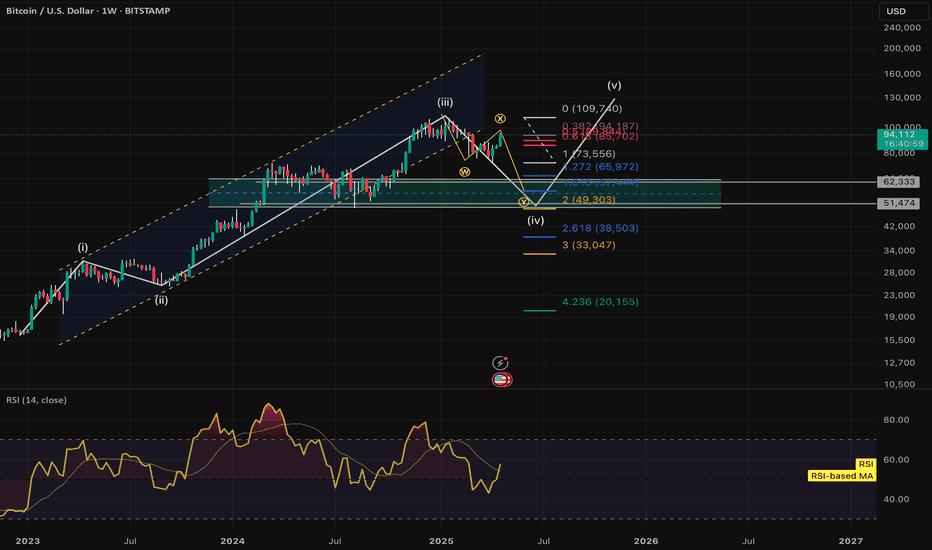
Is BTCUSD still in WXY correction phase ?BTCUSD continues to be correcting till 48K-62K band, this is weekly chart so it will take time.
Current up-move seems to be X wave as indicated.,
Why 51-62K is the band where correction will end ?
a. Technical divergence gets resolved here
b. 1.618 Fib relation of assumed corrective Wave-W falls in this band
Can the current rising segment impulsive ?
No because current rising segment is pretty corrective supporting high probability of next wave-Y
Will the correction stop at Wave-Y ?
May not be as one more leg up (Wave-X) and one more Leg down (Wave-Z) can be formed
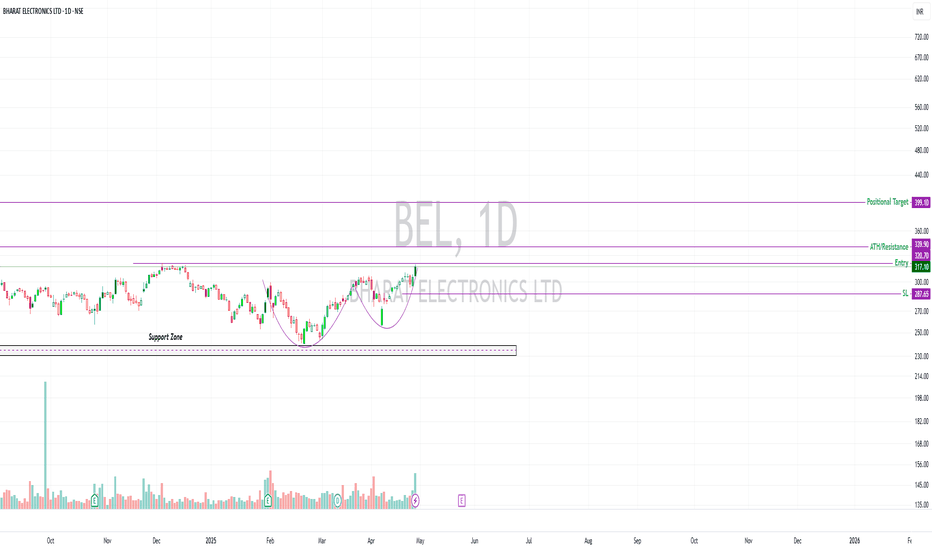
BEL – Sector Strength + Double Bottom + Volume Thrust 📈 BEL – Sector Strength + Double Bottom + Volume Thrust = A Setup Worth Tracking
The India Defence Index just broke into new all-time highs, possibly driven by rising geopolitical tensions — but beyond the headlines, the sector remains structurally strong.
BEL (Bharat Electronics Ltd) is showing powerful confluence:
A double bottom breakout
Sectoral support
Rising volumes
Key moving averages reclaimed
All of this sets up a technically sound positional opportunity.
🧠 Technical Highlights
✅ Stock trading above key DMAs
✅ Volume picking up — watch for 4x–5x surge to confirm strength
✅ ATH at ₹339.90 may act as resistance; clean breakout above it = add/fresh entry
✅ Defence sector index at ATH – macro tailwind active
🧮 Setup Overview
Entry Zone ₹32.7
Stop Loss (SL) ₹287.65
ATH Resistance ₹339.90
Target (Positional) ₹399.10
SL % -10.09%
Target % +24.72%
Risk : Reward 1 : 2.45
🧭 Suggested Strategy
🔄 Add 30–40% at breakout
🧘 Wait for pullback or retest to add more
🚫 Avoid chasing — shakeouts are very likely
🧠 Gradual accumulation + disciplined risk management > FOMO
📊 Volumes should confirm — clean candle with strong demand = green signal
⚠️ Final Note:
We are not entirely out of danger — markets can throw brutal pullbacks and false breakouts. Defensive positioning, proper sizing, and exit planning are essential.
📉 Disclaimer:
This is not a buy/sell recommendation. For educational purposes only. Do your own research and manage risk as per your trading style.
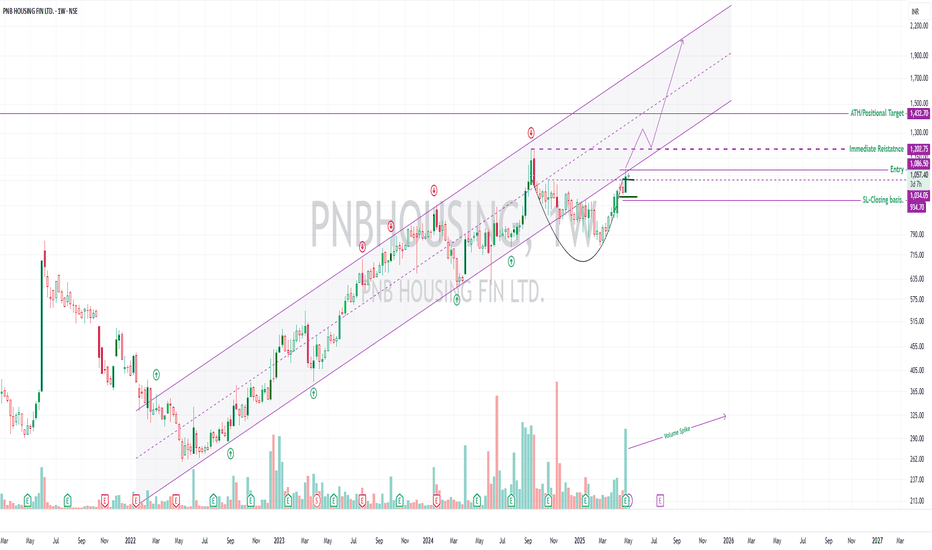
PNB Housing Finance – Weekly Positional Setup🏠 PNB Housing Finance – Weekly Positional Setup
🧭 Strategy: Cup & Handle breakout | 🏦 Sector: Housing Finance / NBFC
🔍 Setup Overview
The stock is trading above key DMAs, indicating strong trend alignment 🔼
Sector momentum is clearly picking up — Housing Finance & NBFCs showing traction 📈
After briefly breaking below its ascending channel, price is now attempting a re-entry — often a bullish sign of reclaiming strength 🔁
A Cup & Handle pattern is forming on the weekly chart — a classical continuation setup 🏺
The first breakout zone was ₹1034.05, which had decent Weekly volume — but caution due to weakness seen in Daily TF 📉
📊 Volume Insight (Why It Matters)
✅ Weekly TF shows volume spike during recent bullish move
⚠️ However, on the Daily TF, red candles had higher volume — suggesting distribution or supply at higher levels
⛔ Avoid low-volume breakouts — these tend to fail or trap early entries
🔑 Wait for a clean Weekly close above ₹1086.50 with volume support(Risk Takers can take the leap now)
🧩 Confluence Factors (Multiple Confirmations = Stronger Setup)
Pattern is forming inside a long-term ascending channel
Reclaiming the channel = bullish structural strength
Sector strength + stock above all key moving averages = powerful context
All this happening in a period where broader market (Nifty 500) is still below 200DMA, making relative strength stand out
⚠️ Macro & Technical Risks
Price could stall or reverse at the positional target near ₹1432.70 (ATH zone)
Geopolitical uncertainty and macroeconomic shifts (rate changes, FII flow) could derail the move
If volume does not accompany breakout, avoid or reduce position
🛡️ Risk Management & Strategy
Use ₹934.70 as SL, based on structure, strictly on closing basis
Total risk: 13.36%, potential reward: 31.85%, giving R:R = 1 : 2.36
Only enter after clear breakout confirmation with volume
This is a positional setup, not a short-term one.
Most important: Position sizing is critical — don’t overcommit on early setups
🎯 Educational Note
Cup & Handle setups are most powerful when supported by:
Multi-timeframe confirmation 📈
Sectoral strength 🏦
Channel/structural context 📐
Volume breakout 📊
Patience is your edge. Enter only when all the pieces align.
Disclaimer: This analysis is for educational and informational purposes only. It does not constitute investment advice or a recommendation to buy or sell any securities. Always conduct your own research and consult with a qualified financial advisor before making any trading decisions. Past performance is not indicative of future results. Trade responsibly.
Channel Pattern - NIFTYNIFTY
Nifty now trade channel pattern break and trade above .
Next nifty uptrent Target 28500 shortly.
Nifty 2021 oct to 2024 sep trading in channel pattern only. So Pattern support zone recently enter and recover. Pattern continue coming days also.
Next short term target 24500 if hold above 24500 Next target 28500.
BALKRISIND case study on a possible fake BO1. Balkrisna IND made a Breakout of a long run parallel channel of 9 months (starting from 23rd sep 24)
2. Good volume buildup but there is price rejection from the top.
3. A possible case of fake BO if close below key support and channel @2638.
4. Analysis invalidated if the price in day candle close above 2724.
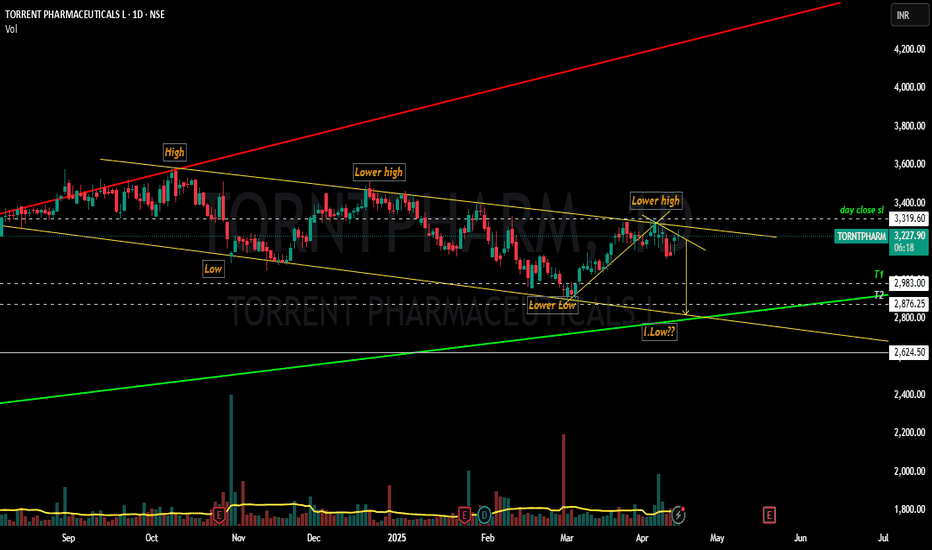
TORNTPHARM Final Bearish move before bulls entry????Yesssss!!!! Chart patterns suggest me the above titled opinion...
TORNTPHARM has been travelling in a Ascending Expanding channel pattern IN A BULLISH MODE MAKING SERIES OF HIGHER HIGHS AND HIGHER LOWS... (shown below)
Inside the bullish pattern , it is now currently in the downward phase that too inside rectangular descending channel pattern making a SERIES OF LOWER HIGHS AND LOWER LOWS....
It's moving like a written script till now....let's wait and watch whether the director(market) has any twist in the script or not!!!
This is just my opinion....not a tip nor advice!!!!
Thank you!!!!!!!
USD INRHello & welcome to this analysis
USDINR topped out on 10th Feb @ 88 to see a sharp reversal all the way till 4th April when it formed a bullish Harmonic Deep Crab pattern @ 85 that too lead to a more sharper bounce back till 9th April when it formed a bearish Harmonic Reciprocal ABCD pattern near the top end of the slanting channel.
From there we have witnessed yet another steep downward move which is currently resting at the lower end of the slanting channel. Failure to hold 84.45 - 84.35 could lead to a further downward move till 83.70 where it would attempt to form a bullish Harmonic ABCD pattern that could coincide with DXY bullish harmonic pattern near 95.
So if you have exposure to currency for any reasons whatsoever - overseas trips, college fees, business, commodities trading, etc - this might be of help to you.
Disclaimer - Not a trading advise, kindly do your study carefully before taking a decision