Ascending channel - 24700 or 23500 ?Hope you are all doing well.
Nifty has closed around 24,176 and is currently sitting right at the channel support area. As long as this zone holds, I am looking for a move along the upper side of the channel towards 24,485 and then 24,716.
On the downside, a clear break below the channel could extend the fall towards 23,840 and 23,569.
This view is shared purely for educational purposes only. Please consult your financial advisor before taking any trading decisions.
Parallel Channel
RBLBANK | Daily TF | Channel breakoutRBL Bank Limited
Sector: Bank | Timeframe: Daily | Bias: Bullish
Setup Type: Channel Breakout, C&H pattern
RBLBANK is showing a clean multi-month breakout setup after spending almost 200 days inside a broad consolidation range. The structure now looks technically strong with multiple bullish confirmations aligning together.
Price has successfully broken out of the falling channel and is currently retesting the breakout zone, which is often considered a healthy sign before continuation. Along with that, a Cup & Handle pattern is also visible on the daily timeframe adding more strength to the bullish structure.
The most important factor here is the steady volume buildup near breakout levels, suggesting accumulation activity. If buyers continue to defend the breakout zone, the stock can head toward the 370 area, which aligns with the measured move target of the range breakout.
Key highlights:
200-day consolidation breakout
Falling channel breakout & retest
Cup & Handle formation visible
Strong volume expansion near resistance
Momentum shifting in favor of bulls
As long as the stock sustains above the breakout zone, probability favors further upside continuation. A decisive move above recent highs can trigger fresh momentum.
⚠️ This is a technical analysis idea for educational purposes only, not financial advice. Please do your own research before making any trading decision.
JYOTISTRUC - Multi Timeframe Demand Zone Reversal SetupNSE:JYOTISTRUC
Jyoti Structures Ltd is showing a strong structural recovery from a long-term Monthly Demand Area with visible accumulation across higher timeframes.
Key Observations:
Weekly chart shows a clean breakout from a falling channel structure.
Price respected the Monthly Demand Area and formed higher lows after prolonged decline.
Daily timeframe confirms momentum continuation with strong bullish candles and rising volume participation.
Price is now trading above short-term EMAs , while attempting to reclaim higher moving averages.
RSI strength on both Weekly and Daily charts indicates improving bullish momentum without extreme overheating yet.
Immediate resistance zone is near previous supply around 15–16 levels.
Sustaining above breakout zone may open further trend continuation possibilities.
Trade Structure:
Bias remains bullish above the breakout support zone.
Volume expansion and EMA alignment will be important for continuation confirmation.
Failure to hold breakout structure may lead to retest of demand zone before next directional move.
Educational View:
This chart is shared purely for educational and learning purposes to demonstrate:
Multi-timeframe analysis
Demand zone reaction
Channel breakout structure
EMA trend transition
Volume and momentum confirmation
=================================================================================
Disclaimer:
I am not a SEBI-registered Research Analyst or Investment Adviser. This publication is only for educational purposes and should not be considered financial, investment, or trading advice. Please do your own research and consult your financial adviser before making any investment decision. Trading and investing in securities involve market risks.
Sensex - Expiry day analysis May 7The price is at an important level, which will decide the trend direction. The confluence of channel and support/resistance zone is also at 78000.
Buy above 77920 with the stop loss of 77740 for the targets 78040, 78200, 78400, 78540, 78740 and 78900.
Sell below 77500 with the stop loss of 77680 for the targets 77380, 77200, 77040, 76880, 76720 and 76560.
Always do your analysis before taking any trade.
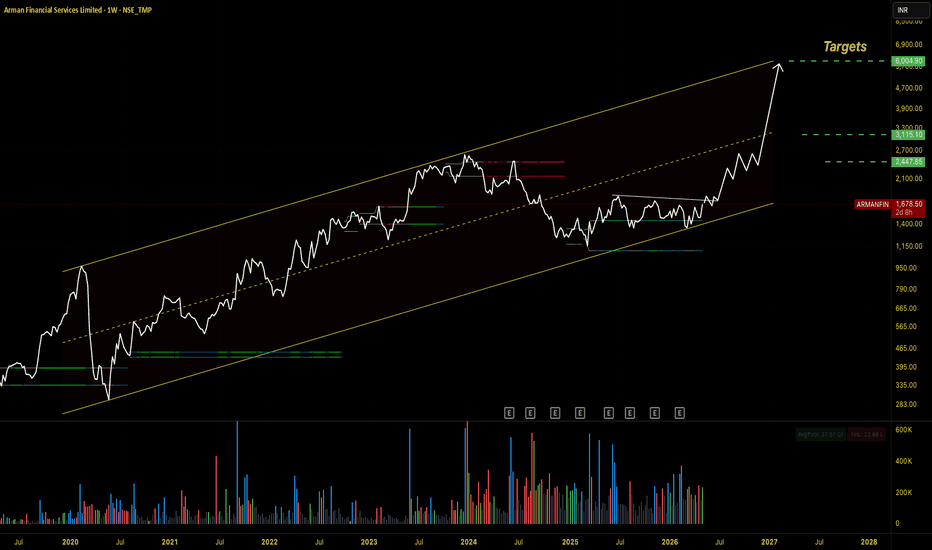
ARMANFIN - Respecting the 7-Year Ascending Channel | WeeklyArman Financial has been trading inside a clean, ascending parallel channel since 2019, now 7 years old and counting. This isn't a drawn channel hunting for a fit. The price has tested the lower boundary three times in seven years and bounced all three times:
→ COVID low (2020)
→ Post-peak correction (2022)
→ MFI sector blowup (2024–25) - the deepest, most brutal test
Each test was accompanied by a different set of macro or sector fears. The structure didn't flinch.
The stock peaked near ₹2,500 in mid-2024 and corrected 57% to the lower band (~₹1,100) over 12 months. The chart is saying the cycle is turning. The technicals are the leading indicator here. When price structure + fundamental cycle inflect at the same point, that is the setup. Notice the compression near lower band for ~6 months before yesterday's breakout candle
Three targets derived purely from channel structure:
T1 : ₹2,447 | Channel midline (first mean-reversion target)
T2 : ₹3,115 | Upper half of channel, channel mid-to-upper zone. Requires sector re-rating + earnings recovery. Not a stretch if MFI cycle turns.
T3 : ₹6,000 | Upper channel boundary (2027–28 projection)
This is what the channel structure implies if the business compounds and the structure holds. Ambitious, but the math of a 7-year channel justifies it.
Invalidation: Weekly close below ₹1,350
If price re-enters below the lower band on a closing basis, the thesis is off.
This is a technical setup note. Not investment advice. Do your own due diligence.
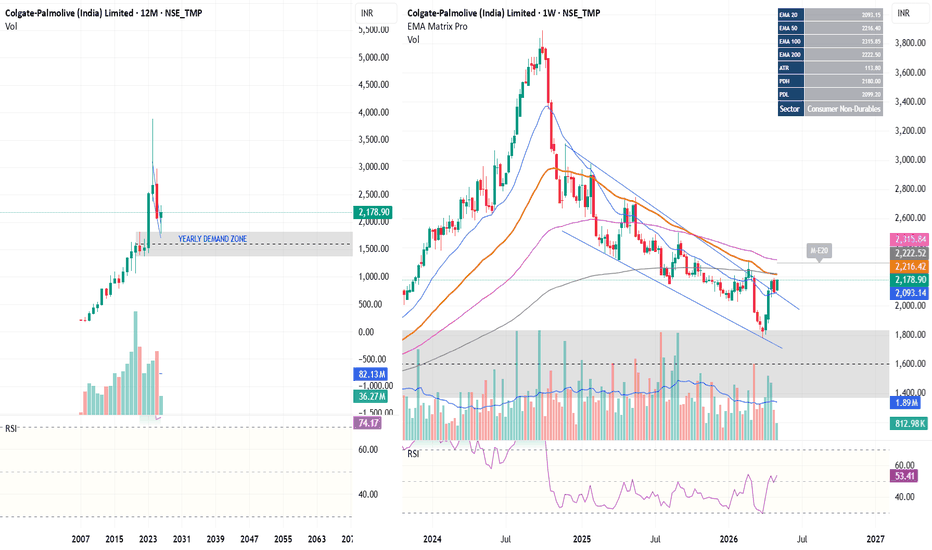
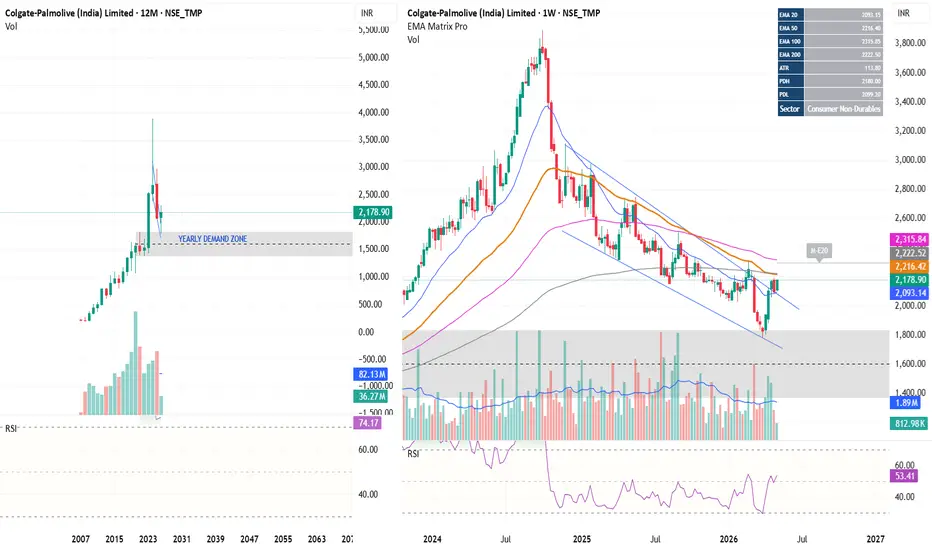
COLPAL - Broken out Down ChannelNSE:COLPAL
Price was falling down in a channel until reach to Yearly Demand Area. As it reacted from Yearly demand zone, price catch a strength which help to closed out of falling channel. On weekly EMA/s still showing hurdles but Daily chart more clear as price hold at last EMA Resistance.
Price was sustained outside the channel, showing signs of further up move.
If it stand out of channel, yes, it could be a good investment idea.
=================================================================================
⚠️ DISCLAIMER :
I am NOT a SEBI-registered investment advisor . This is a personal technical observation for educational purposes only. It is NOT a recommendation to buy, sell, or hold any security. Trading involves substantial risk of loss. Consult a SEBI-registered advisor before making investment decisions.
NOT A RECOMMENDATION: This post is strictly for educational purposes to demonstrate price action principles and observation skills. I am NOT a SEBI-registered Investment Advisor or Research Analyst. Many time I was proven failed in past.
NO CALL TO ACTION: Do not treat this as a "Buy," "Sell," or "Hold" instruction. No specific price targets or stop-loss levels are being provided.
MARKET RISK: Equity investments are subject to market risks. Past performance and chart patterns do not guarantee future results.
PERSONAL DISCLOSURE: I may have a personal interest or position in this stock. My views are personal and should not be used as a basis for financial decisions.
ADVICE: Always consult a qualified and SEBI-registered financial professional before investing your capital.
Nifty - Expiry day analysis May 5Today, the price sustained above 24000, and now it is testing the next crucial zone 24150 which will decide the trend direction.
Buy above 24160 with the stop loss of 24100 for the targets 24200, 24260, 24320, 24360 and 24420.
Sell below 23980 with the stop loss of 24040 for the targets 23940, 23880, 23820, 23780 and 23720.
As per the daily chart, the price is still bearish.
The expected expiry day range is 23800 to 24300.
Always do your analysis before taking any trade.
Nifty - Weekly Review May 4 to May 8Friday's close was nearly the same as last week's close, which makes 24000 as a strong trend direction deciding zone. The price can move up if there is strong bullish strength at 24000.
Buy above 24040 with the stop loss of 23980 for the targets 24080, 24140, 24200, 24280, 24340, 24420 and 24500.
Sell below 23880 with the stop loss of 23940 for the targets 23840, 23780, 23720, 23660, 23600, 23520, 23480, 23400 and 23360.
One thing is different from last week. A descending channel pattern is seen on the lower time frame. Opening with strong bearish strength can change the price bearish. Wait, watch and trade.
Always do your analysis before taking any trade.
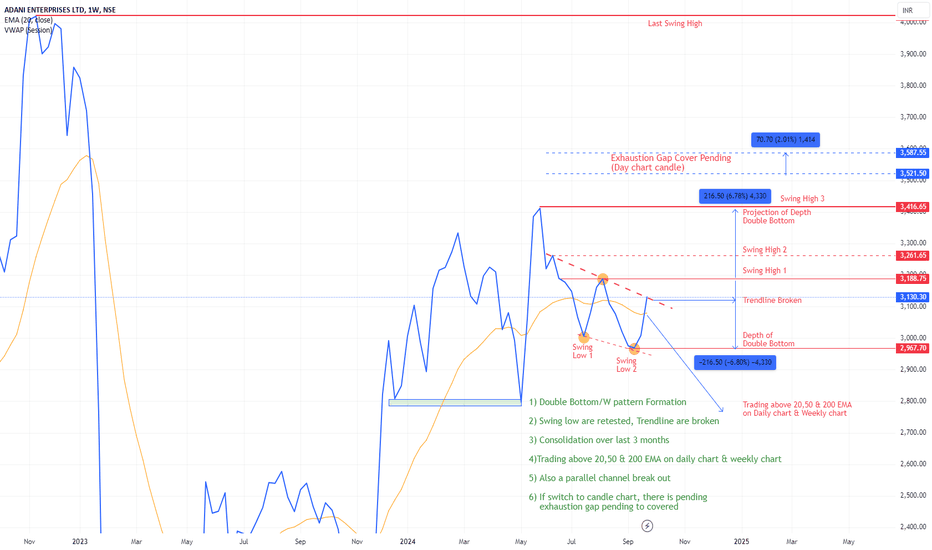
Adani Enterprises Swing Idea (Long)Adani has been accumulating for last 3 months expect it to move the advancing stage in upcoming weeks due to following reasons:
1) Double Bottom/W pattern Formation
2) Swing low are retested, Trendline are broken
3) Consolidation over last 3 months
4)Trading above 20,50 & 200 EMA on daily chart & weekly chart
5) Also a parallel channel break out
6) If switch to candle chart, there is pending exhaustion gap pending to
covered.
(Note: I am neither responsible for anyone's profit or loss nor I'm a sebi registered RA, this only for educational purpose. Please do your own due diligence before taking any trades.)
Ascending Channel in Focus | 23800 Support – 24600 ResistanceHi Everyone,
Hope all are doing well.
As a continuation of my previous analysis linked below,
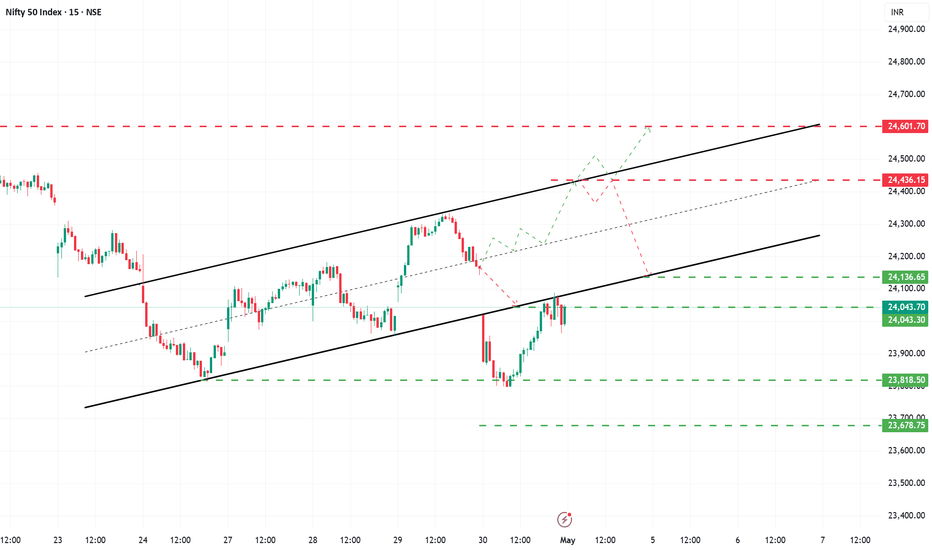
The market witnessed a sharp correction and dropped to 23,800, where it found strong support. From this level, price rebounded and closed near 23,997, indicating buying interest at lower levels.
On the 15‑minute chart, an ascending channel structure is still in play. If the price manages to close above 24,100 on a 15‑minute candle, it may signal renewed bullish momentum. In that scenario, the market can move toward 24,436, which coincides with the upper boundary of the channel. A sustained breakout above this level could open the doors for a further upside toward 24,600.
On the downside, if the market fails to hold above nearby levels, a retest of the 23,800 support zone is possible. This level remains crucial, as a strong hold could again attract buyers, while a breakdown may weaken the structure.
Key Levels to Watch:
Support: 23,800
Resistance: 24,100 → 24,436 → 24,600
Please note this is for purely educational purposes only. Take advice from your financial advisor before taking any trades.
Big day on May 4th ? 24600 or 23800 ?Hi everyone,
Hope you’re all doing well.
The market has been gradually recovering and showing positive signs, although unexpected events are causing short‑term pullbacks.
On the 15‑minute timeframe, I can see an ascending channel formation. The channel currently has two support levels and two resistance levels, and today’s close is around 24,163, which is near the middle of the channel.
Based on this pattern, the market has the potential to move up by around 260 points, targeting 24,436. If bullish momentum continues, a further move toward 24,601 is possible. I am expecting this move to play out around May 4, when the 5‑state election results are scheduled to be announced.
On the downside, the next support within the channel is at 24,043. If the pattern breaks and a retest occurs, prices could fall further toward 23,818, which matches the size of the pattern.
Support Zones:
24,043
23,818
Resistance Zones:
24,436
24,601
Please note this is for purely for educational purposes only. Take advice of your financial advisor before taking any trades.
Sensex - Expiry day analysis April 30The price is moving in an ascending channel. If there is a small gap down opening near the lower trend line of the channel and if the price shows bullish strength, buy above 77240 with the stop loss of 77080 for the targets 77360, 77480, 77640, 77800, 77960, 78120 and 78280.
Sell below 76900 with the stop loss of 77080 for the targets 76760, 76600, 76440, 76280 and 76120.
If the price opens flat, buy above 77600 with the stop loss of 77440 for the targets 77740, 77800, 77960, 78120, 78280 and 78460.
Always do your own analysis before taking any trade.
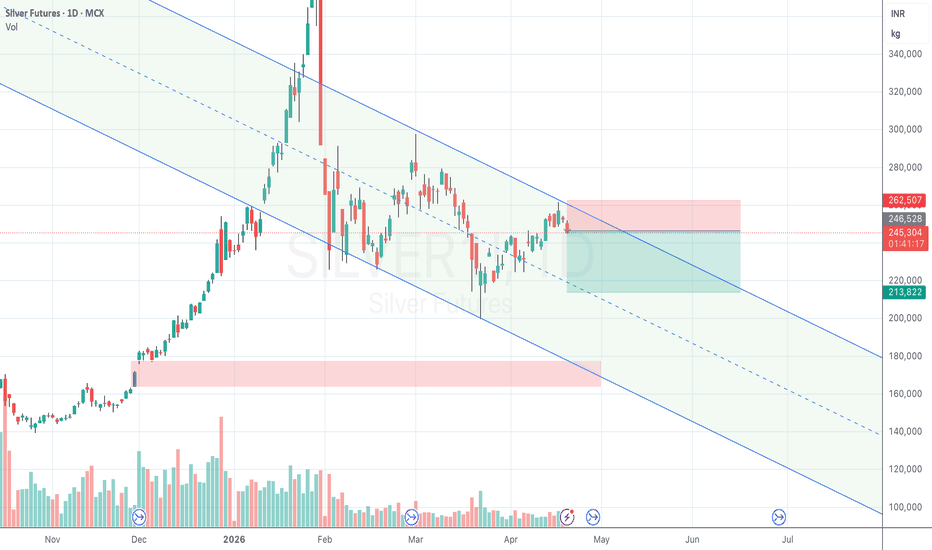
Silver – Sell-on-Rise View Inside Descending ChannelSilver is trading inside a clear descending channel on the daily chart. The current bounce is approaching an important resistance / supply zone, where price may face rejection again. As long as price stays below this resistance and within the channel structure, the bias remains bearish. Lower High is printed, if bearish trend continues, we will see lower low, completing the ABC correction wave.
Invalidation:
A strong breakout and sustained close above 262,600.
Potential downside target:
Target 1 - Around 213,800, channel mid point.
Disclaimer:
This idea is shared strictly for educational purposes only. It is not financial or trading advice and not a recommendation to buy or sell any instrument. Markets involve high risk. Please do your own analysis and risk management before taking any trade.
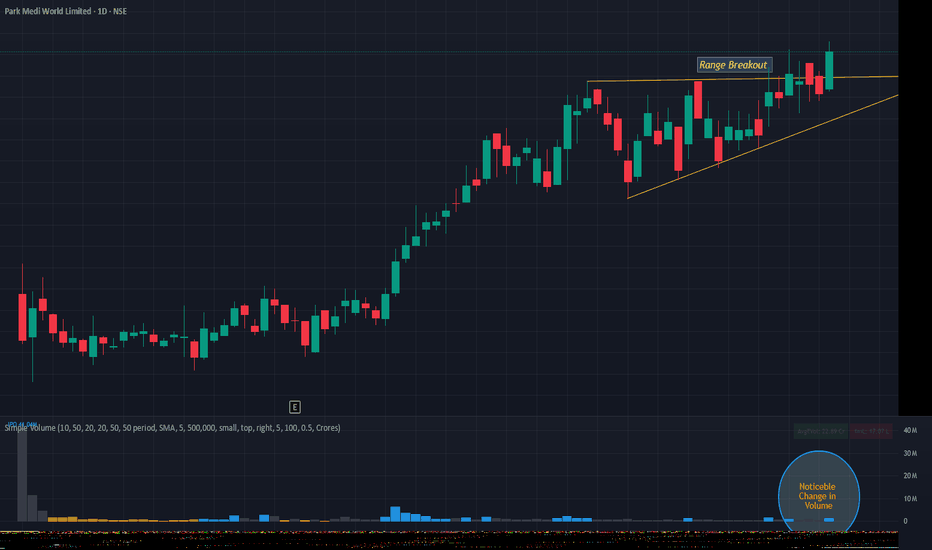
PARKHOPSPARKHOPS giving range breakout. Continuous consolidation at all time high was a v strong sign. Even in falling market as well it was standing taller. Made a higher low and couldn't close even continuos 3 days that is also add-on. So now as long as it is closing above 200 then there is high probability that it may trade higher n higher in coming days and has potential to go above 250 levels. Keep in yr watchlist
PFC Ltd: Accumulation Building Below Supply – Breakout Ahead?After the sharp fall from 580 , the price appears to have completed a W-X-Y corrective structure near 329.90 . Since then, the stock is gradually moving higher within a descending channel .
A few early positive signs are visible:
RSI has reclaimed the 50 level and is holding above it, indicating improving momentum.
Volume shows quiet accumulation , suggesting gradual buying interest.
Price is approaching an important supply zone near 440 .
Trading Approach
Aggressive entry can be considered on a breakout of the descending channel .
Safer entry would be a break and close above the supply zone .
Invalidation: A sustained move below 381.50 may weaken this bullish view.
If the breakout sustains, the stock could gradually move towards higher resistance levels and possibly retest the 580 region .
Disclaimer: This analysis is for educational purposes only and does not constitute investment advice. Please do your own research (DYOR) before making any trading decisions.
BTC: A MULTICHANNEL TECHNICAL SHORT OPPORTUNITY FOR 15000 POINTSBTC: Multi-Channel Short Setup (High Probability)
• BTC is trading within a dual channel structure
– HTF: Downtrend channel (since Oct ATH)
– LTF: Counter-trend upward channel (since Feb low)
• Key Confluence Zone: 73k–74k
– Channel 1 high + Channel 2 midpoint
– Fake breakout observed → strong rejection
• Current View
– Price back below resistance → weakness confirmed
– Channel 2 support tested multiple times → fragile
• Trade Plan
– Entry: Breakdown + retest of Channel 1 high
– SL: 74k (structure invalidation)
• Targets
– T1: Channel 2 low
– T2: Intermediate demand zone
– T3: Channel 1 low (~56k)
• Note
– Expect multi-leg move, not a straight fall
– Watch for acceptance below support for confirmation
________________________________________
Educational purpose only. Not financial advice.
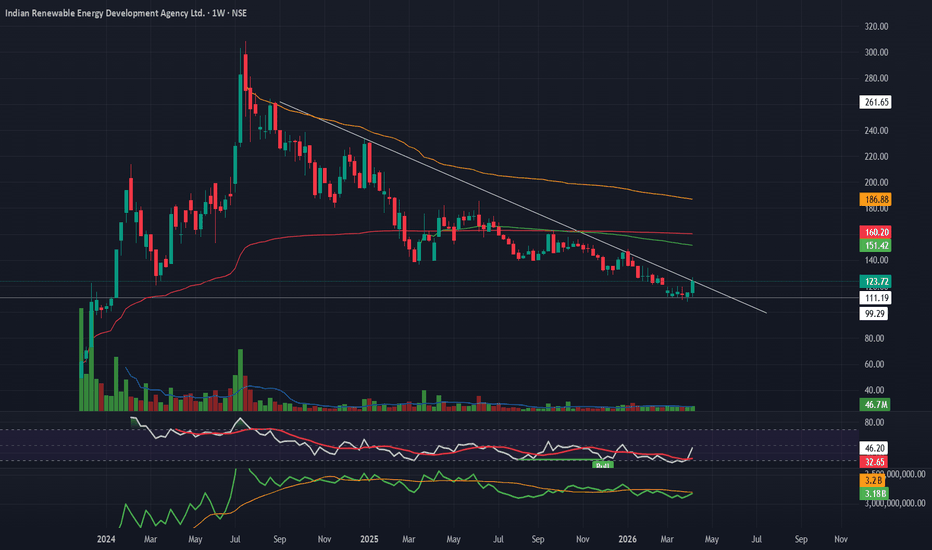
IREDA – Descending Triangle Breakout | Early Reversal SetupIREDA has broken out of a descending triangle, signaling a potential shift from downtrend to early accumulation phase.
RSI is reversing from oversold levels, while OBV has crossed above its SMA — confirming buying interest.
AVWAP confluence (ATH, prior swing, listing zone) adds strength to the current structure.
🔹 Entry: 126–130
🔹 Stoploss: 112
🔹 Targets: 145 → 160
👉 Counter-trend, but strong risk-reward.
👉 Sustaining above AVWAP cluster will be key for trend transition.
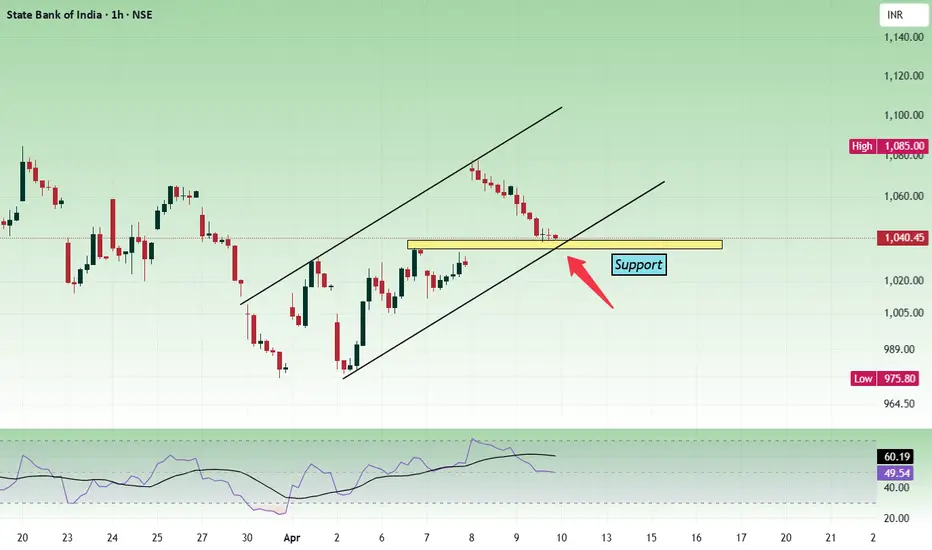
Sbin The price opened with a gap up, unable to sustain and fall down towards the support zone 1030 - 1040. How the price reacts at this level will decide the trend direction. We can see the confluence of channel and support at the 1035 zone.
The daily chart shows the price is near the trend line support.
Buy above 1040 with the stop loss of 1032 for the targets 1048, 1060, 1072 and 1084.
Sell below 1026 with the stop loss of 1032 for the targets 1018, 1010, 1002, 994 and 988.
Always do your analysis before taking any trade.
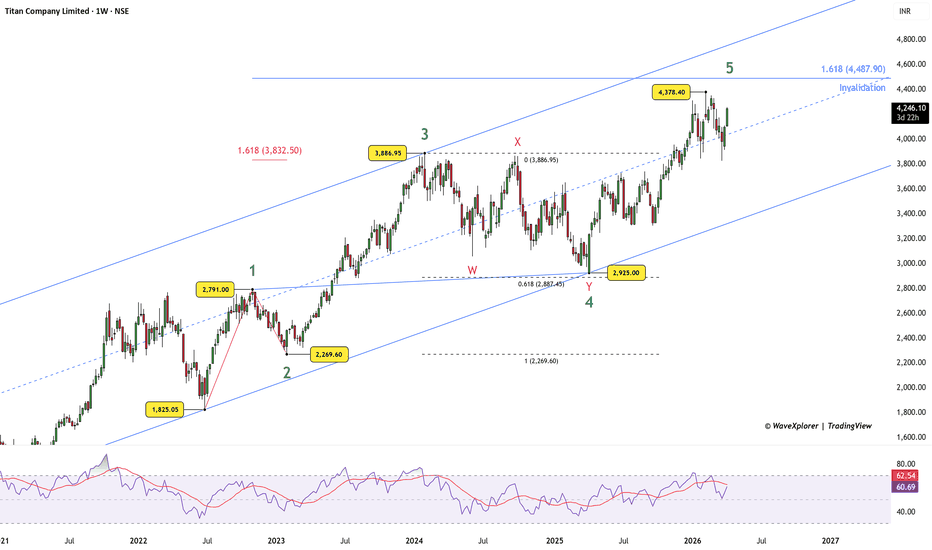
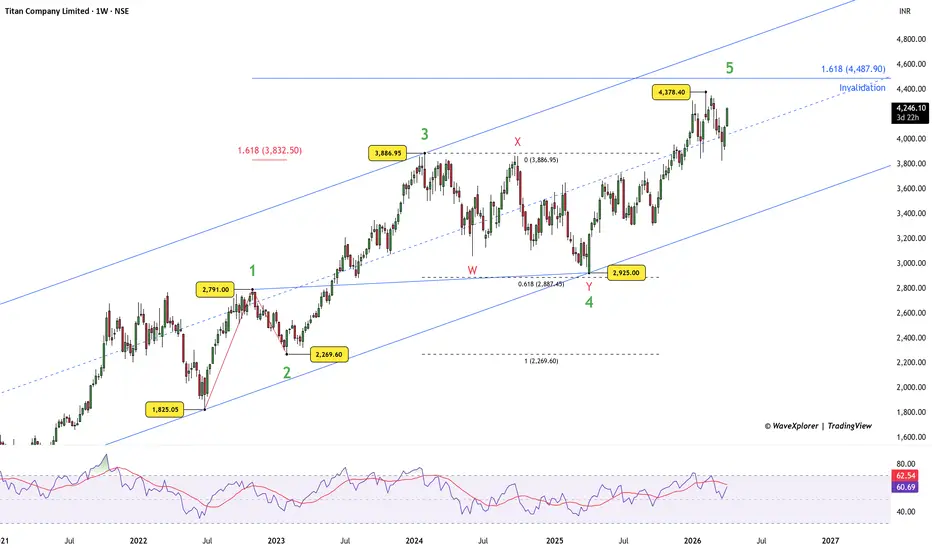
Titan(Weekly) – Wave 5 in Final Stage at All-Time HighsTimeframe: Weekly
Current Price: ₹4,246
Elliott Wave Analysis
From the major low of ₹1,825.05, Titan has completed a clear 5-wave impulsive rally:
Wave 1 : ₹2,791
Wave 2 : ₹2,269.60 (sharp retracement)
Wave 3 : ₹3,886.95 (exact 1.618 extension of Wave 1)
Wave 4 : ₹2,925 (WXY double zigzag)
Wave 5 : currently in progress
Key Levels
Recent high: ₹4,378.40 (possible Wave 5 top)
Wave 5 target (1.618 extension of Wave 1 measured from Wave 4): ₹4,487.90
Bearish invalidation: ₹4,487.90 (clear break & close above)
Momentum Confirmation
RSI has curved upward and is attempting to cross above its 14-period MA — can be the sign of exhaustion in the final wave.
Trade Setup
Bias: Bearish
Strategy: Look for short entries near ₹4,378–4,400 zone
Target 1: ₹3,886 (Wave 3 high / previous resistance)
Target 2: ₹2,925 (Wave 4 low)
Stop Loss: ₹4,488 (above 1.618 extension)
Risk-Reward: Excellent (1:4+ on full move)
Let’s see if Wave 5 prints its final spike or has already topped at 4,378.40.
Disclaimer: Please DYOR. Not a buy/sell recommendation. Educational purpose only.
Nifty - Expiry day analysis April 7Today, the price was unable to sustain 22800 in the opening and fall down, took support from 22600, and now it is nearing the important psychological zone 23000. Sustaining above this is important for the bulls.
Buy above 23040 with the stop loss of 22980 for the targets 23100, 23160, 23240, 23300 and 23340.
Sell below 22880 with the stop loss of 22940 for the targets 22820, 22780, 22720, 22660, 22600 and 22520.
Expected expiry day range is 22400 to 23400.
Always do your analysis before taking any trade.
4.700 — Will sellers hold the line or get wiped out?Asian session: Gold reacted sharply to Trump’s statement on Iran (Hormuz) → sell-off right after market open.
Strong rhetoric, but no concrete action yet → market now shifts into consolidation, no clear direction.
👉 US session tonight: PMI release → potential volatility
👉 Next Asian session (tomorrow): deadline related to US–Iran → high-impact move expected
🎯 Key levels:
Resistance: 4.700, 4.736, 4.799, 4.900 – 5.000
Support: 4.580, 4.555, 4.530, 4.480, 4.420
🧠 Insight:
H4 structure remains bullish (not broken),
but lower timeframe (H1) shows choppy consolidation.
👉 Primary plan: range trading between 4.580 – 4.700
⚔️ Scenarios:
Hold above 4.580 → bounce back to 4.680 – 4.700
Rejection at 4.700 → potential move back down
Break & hold above 4.700 → continuation to 4.736 → 4.800+
Break below 4.580 → downside to 4.555 → 4.530 → 4.480
💰 Setups:
Buy 4.555 | SL 20 | TP 1:2 – 1:5
Sell 4.700 | SL 20 | TP 1:2 – 1:5
Deep buy 4.475 – 4.480 | SL 20 | TP 1:1 – 1:3
⚠️ Risk note:
Higher timeframe (H4) still bullish, but intraday is uncertain & news-driven.
👉 Stay cautious, wait for confirmation — avoid early entries
👉 Do you think 4.700 will hold the sellers or get broken?
👉 If this helps, drop a like 🚀 and share your view!