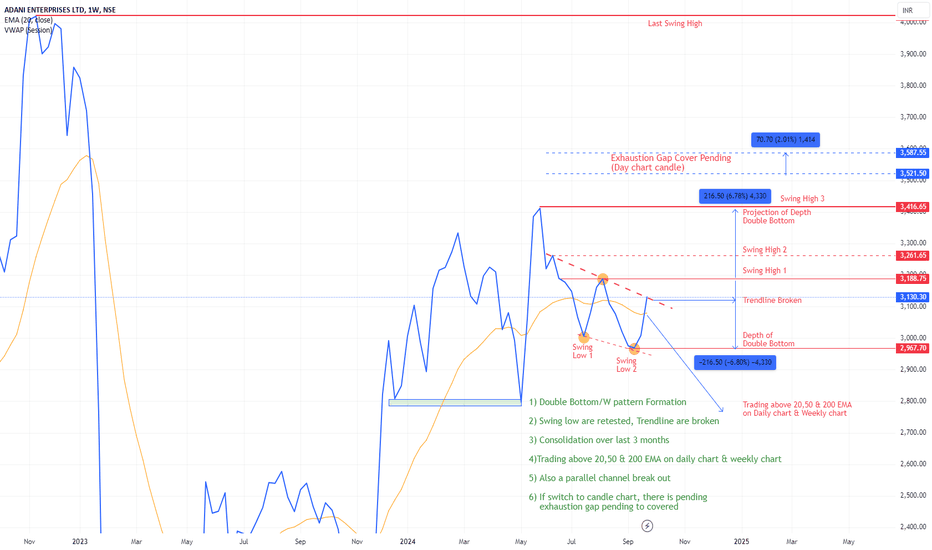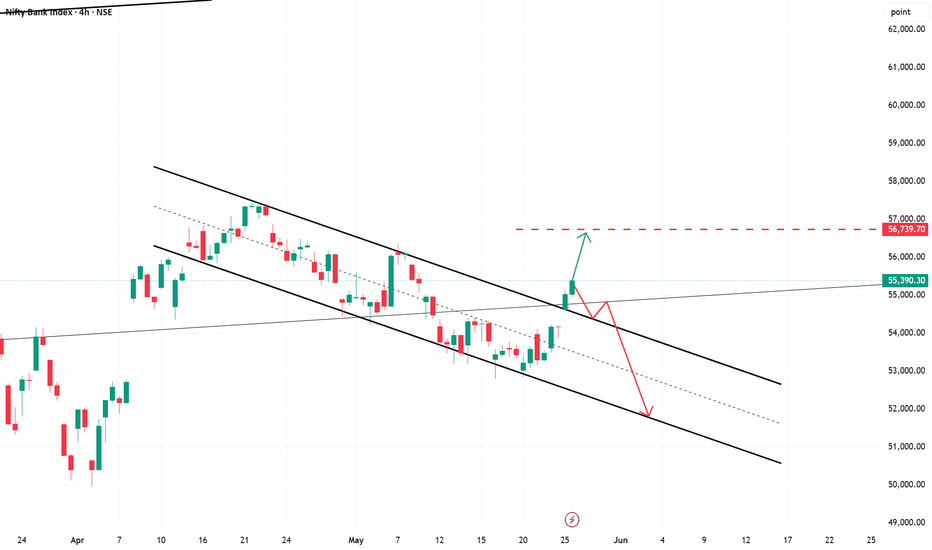
NIFTY Weekly UpdateNifty closed 1.28% lower during the last week, amid unsettling geopolitical tensions. During the week, the market recovered over two sessions, driven by hopes of a U.S.โIran deโescalation plan, but as Iran later dismissed the U.S. proposal as โoneโsided and unfair,โ markets corrected on Friday.
Nifty has been forming lower highs and lower lows on the chart, which is a bearish pattern. Hence, for the coming week, I expect Nifty to trade in a channel pattern with a downward bias. The previous lowerโlow zone of 22,470โ22,500 will be an important level for the market. If it breaches this zone, 21,800 might act as a support level. On the upside, 23,900 will act as the first resistance level, and 24,400 beyond that.
Parallel Channel
NIFTY50 weak โ sell on rise intact #NIFTY50 weak โ sell on rise intact ๐
โMarkets Sank 2% after a recent bounce got rejected from down Channel line โ confirming sellers are still in full control
๐Bounce was weak โ no follow-through buying = distribution, not reversal
๐PCR โ 0.89 falling
โก๏ธINDIAVIX โ 26.8 (High volatility )
๐DJI โ Closed -1.7% Breaking swing low
๐Nifty Support Levels
22800 โ Immediate support
22630 - DZ
22470 โ Swing low support
22260 โ Unfilled gap
๐Nifty Resistance Levels
23190 โ Gap resistance
23370 โ Channel resistance
23830 โ Supply zone + 20 EMA (Day TF)
โก๏ธVIEW :-
Bias remains strongly bearish โ trend continuation expected
โข Rejection from resistance confirms sell on rise intact
โข Breakdown below 22800 โ downside expected 22470 โ 22260
โข Any pullback towards 23190โ23350 zone =
๐ High probability shorting zone
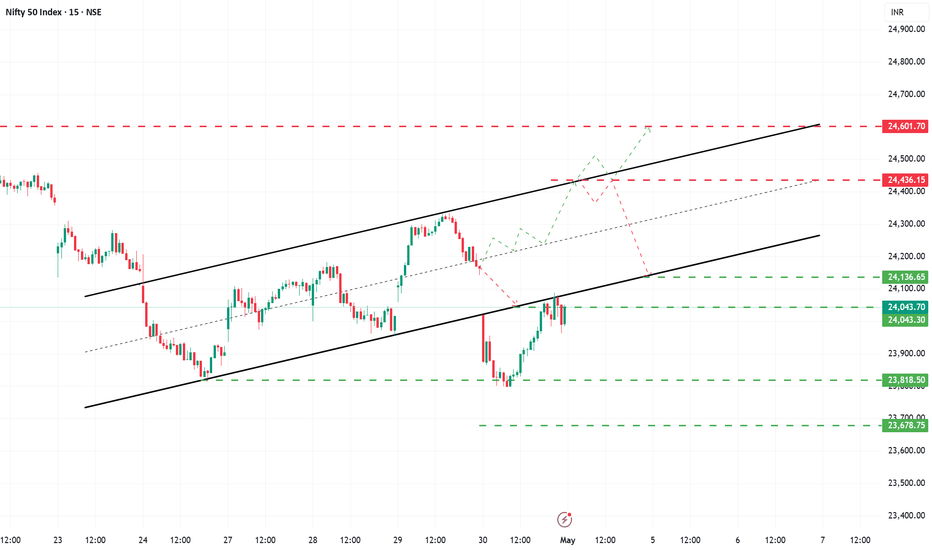
Axis bankI have found interesting chart patterns in different timeframes. Ascending channel in the lower timeframe(15 minutes) and descending channel in the daily time frame. In the daily chart, the price has closed above the upper trend line and in the 15-minute chart, the price is at the lower trend line support of the channel.
The 1220 zone is crucial in deciding the trend direction.
Buy above 1224 with the stop loss of 1212 for the targets 1232, 1246, 1258 and 1274.
Sell below 1196 with the stop loss of 1208 for the targets 1188, 1178, 1166 and 1152.
Always do your analysis before taking any trade.
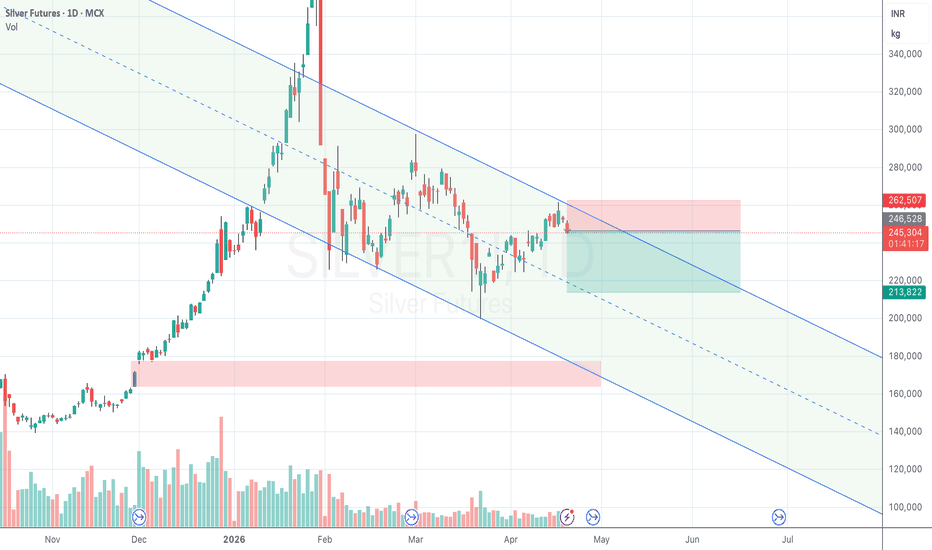
Silver for A-B-C corrective structureAfter a strong impulsive upmove, Silver appears to have entered a corrective phase.
On the daily chart, price seems to be forming an A-B-C corrective structure within a rising channel.
What the chart suggests:
The sharp fall from the top marks the beginning of the correction.
Price then formed a recovery leg toward (B), but it failed to sustain higher.
The current move looks like the (C) leg, where price is drifting back toward the lower channel support and the highlighted demand zone.
Key observation:
As long as price remains weak below the recent swing resistance, this correction may continue toward the lower support region.
The marked red zone becomes important, as it could act as a reaction area if sellers remain in control.
A strong reversal from support may indicate that the correction is complete, while a breakdown could open room for further weakness.
Purely for education and chart study. Not a buy/sell call.
Sensex - Weekly analysis March 23 to March 27The price has closed below the important level of 74800. Sustaining above 74800 and breaking 75k with bullish strength can make the price move towards the 76400 zone. The main trend is bearish.
Buy above 74860 with the stop loss of 74700 for the targets 74980, 75120, 75340, 75600, 75820, 75960, 76120, 76300 and 76540.
Sell below 74500 with the stop loss of 74660 for the targets 74360, 74200, 74020, 73860, 73700, 73520, 73300, 73060, 72900 and 72760.
At present, the price is testing the confluence of the trendline and support/resistance zone. Check how it behaves before taking any trade as it can become a flip zone.
Always do your analysis before taking any trade.
NZDCHF Analysis on (19 MAR 2026)#NZDCHF UPDATEDE
Current price - 0.46200
If price stay above 0.45800 then next target 0.46700,0.47200 and below that 0.45100
Plan1;If price break 0.46100-0.46200 area,and stay above 0.46200 we will placed buy order in NZDCHF with target of 0.46700,0.47200 & stop loss should be placed at 0.45800
CAMS Weekly: Is Wave Y Ending Near Key Support?Structure Overview
From the lows of 402 , CAMS has formed a clear 5-wave impulsive rally till 1073.50 .
The strongest momentum expansion came near 982 , where RSI entered overbought zone โ this is being considered as Wave 3 .
Price was respecting a broader upward trending channel (blue channel) during this entire advance.
After topping at 1073.50 , the stock corrected sharply in an (a)(b)(c) pattern till 606.20 .
The rise from 606.20 to 875 was overlapping and lacked impulsive strength. Hence, that move is considered as a Wave X connector , and not a fresh impulse.
Currently, price is falling again inside a downward sloping channel โ possibly unfolding as Wave Y , with the final c leg likely in progress.
Key Support Cluster
The zone between 541 โ 606 becomes very important due to multiple confluences:
Previous demand area
Lower boundary of larger rising channel
0.618 Fibonacci extension of Wave W from Wave X โ 586
This creates a strong support cluster region.
RSI Observation
RSI on the weekly timeframe is below the 50 midline and sloping downward, indicating weak momentum.
There is no bullish divergence yet .
A bullish divergence forming inside the 541โ606 zone would significantly improve reversal probability.
Invalidation Level
402 is the major invalidation level.
A break below 402 would invalidate the current higher degree impulsive structure from the lows.
Trading Approach โ What To Watch Near 541โ606
The 541โ606 zone is a reaction area .
When price reaches this support cluster, watch for:
Strong bullish reversal candle on weekly (Hammer / Engulfing)
RSI bullish divergence
Completion signs of 5 waves in the final (c) leg
Break above the falling channel
If price breaks this zone with strong momentum and no divergence, the correction may extend further.
Disclaimer: This analysis is for educational purposes only and does not constitute investment advice. Please do your own research (DYOR) before making any trading decisions.
XAUUSD Reaction From Support Zone Possible Bullish Move Toward RXAUUSD Reaction From Support Zone | Possible Bullish Move Toward Resistance
Gold (XAUUSD) on the 45-minute timeframe is currently approaching a strong support zone around 5000 โ 5020. This area has previously acted as an important demand level where buyers stepped into the market. ๐โก๏ธ๐
After a clear bearish move from the resistance zone near 5220, the price is now testing this support again. When price reaches strong support levels, we often see a potential reaction or temporary reversal because buyers may start entering the market at these discounted prices.
At the moment, the market structure shows that price is slowing down near the support area, which could lead to a short-term bullish retracement if buyers gain momentum. However, confirmation such as bullish candles or rejection wicks would make the setup stronger.
๐ Possible Trade Plan:
Entry Zone: 5000 โ 5020 (Support Area)
Target 1: 5120 (Previous resistance / intraday level)
Target 2: 5200 (Major resistance zone)
Stop Loss: Below the support zone
If the support holds, price may move back toward the 5120 level, which is acting as the first resistance target. A strong breakout above that level could push the market toward the 5200 resistance area.
On the other hand, if the price breaks below the support zone, it could signal further bearish continuation. Thatโs why proper risk management and confirmation are very important before entering any trade.
This setup is based purely on support & resistance and price action analysis.
โ ๏ธ Disclaimer: This is only market analysis, not financial advice. Always manage your risk and trade responsibly.
Bearish Channel ContinuationOverview
The chart shows a transition from a consolidation range into a bearish trend after a key support breakdown. Once the support level failed, price shifted into a descending channel structure, indicating sustained selling pressure.
โธปโธปโธปโธปโธปโธปโธปโธปโธปโธปโธป
Concept
Support and resistance zones often define market equilibrium. When price consolidates within a range and eventually breaks below support, it signals weakness in market structure and the beginning of a potential downtrend.
โธปโธปโธปโธปโธปโธปโธปโธปโธปโธปโธป
Chart Explanation
1. Range Formation โ Price initially moves sideways between resistance and support, forming a consolidation zone.
2. Resistance Zone โ The upper boundary acts as a supply area where selling pressure prevents further upward movement.
3. Support Breakdown โ Price breaks below the support level, confirming a shift in market sentiment.
4. Bearish Channel Formation โ After the breakdown, price forms a descending channel with lower highs and lower lows.
5. Continuation Structure โ The channel reflects controlled pullbacks and continued bearish momentum.
โธปโธปโธปโธปโธปโธปโธปโธปโธปโธปโธป
Observation
The previous support zone may now act as resistance, while the descending channel structure continues to guide price lower.
โธปโธปโธปโธปโธปโธปโธปโธปโธปโธปโธป
Summary
The breakdown of the consolidation range triggered a bearish trend. As long as price remains within the descending channel, downside continuation remains the dominant structure
โธปโธปโธปโธปโธปโธปโธปโธปโธปโธปโธป
Disclaimer
๐ For educational purposes only.
๐
Not SEBI registered.
โ Not a buy/sell recommendation.
๐ง Purely a learning resource.
๐ Not Financial Advice.
NIFTY (W): Bearish trendNIFTY trading in an ascending parallel channel & the breakdown from the 2021 ascending parallel channel is a significant structural shift, confirming bearish control.
Critical indicators: the negative crossover (NCO) in s hort-term EMAs, combined with falling RSI and MACD , validates this downward momentum.
Fundamental catalyst: current geopolitical tensions and crude oil spikes are heavily accelerating this technical breakdown.
Key levels:
> Immediate Support: Last week's close at 23,151 is the battleground. If bulls defend this, a relief rally could occur.
> Major Floor: If 23,151 decisively breaks, the lower boundary of the sideways trend at 21,777 becomes the next magnetic target.
This is a high-risk zone. Watch closely if 23,151 holds on a daily closing basis before anticipating a bounce.
Bearish Descending Channel๐งญ Overview
The chart highlights a clear bearish Descending channel defined by a consistent sequence of Lower Highs (LH) and Lower Lows (LL). This pattern reflects sustained selling pressure and confirms that sellers remain in control of the broader trend.
โธปโธปโธปโธปโธปโธปโธปโธปโธปโธปโธป
๐Concept
โข Each rally forms a Lower High (LH) โ When price moves up, it fails to break the previous high. This shows buyers are weak and unable to regain control.
โข Each decline forms a Lower Low (LL) โ When price drops, it breaks below the previous low. This shows sellers are strong and pushing the market lower.
โข Repeated LHโLL structure โ When this pattern continues, it confirms a clear downtrend with sustained bearish momentum rather than just a short-term correction.
โธปโธปโธปโธปโธปโธปโธปโธปโธปโธปโธป
๐ Chart Explanation
1๏ธโฃ The market initially forms a strong high, followed by a sharp rejection.
2๏ธโฃ Price attempts to recover but creates a Lower High, showing weakening buying pressure.
3๏ธโฃ Sellers regain control and push price to a new Lower Low.
4๏ธโฃ This cycle repeats โ LH followed by LL โ confirming a downtrend .
5๏ธโฃ As long as price continues forming Lower Highs and Lower Lows, bearish continuation remains the dominant bias.
โธปโธปโธปโธปโธปโธปโธปโธปโธปโธปโธป
๐ Observation
โข Repeated failure to break previous highs indicates distribution.
โข Momentum favors sellers while structure remains intact.
โข Any upside movement appears corrective unless structure shifts.
โธปโธปโธปโธปโธปโธปโธปโธปโธปโธปโธป
๐ Summary
The consistent formation of Lower Highs and Lower Lows confirms a strong bearish Descending channel . Until price breaks the LH sequence and forms a Higher High, the prevailing trend remains downward.
โธปโธปโธปโธปโธปโธปโธปโธปโธปโธปโธป
โ ๏ธ Disclaimer
๐ For educational purposes only.
๐
Not SEBI registered.
โ Not a buy/sell recommendation.
๐ง Purely a learning resource.
๐ Not Financial Advice.
Max Fin Serv (W): Strong Bullish (Decadal Breakout & Re-test)(Timeframe: Weekly | Scale: Logarithmic)
The stock has confirmed a historic breakout from a 10-year Ascending Parallel Channel (active since 2015). The current week's red candle is not a reversal, but a textbook "Throwback / Re-test" of the newly broken resistance line to confirm it as new support.
๐ 1. The Fundamental Catalysts (The "Why")
The technical jailbreak is heavily backed by structural corporate changes and blowout earnings:
> The Merger Catalyst: The board approved the strategic merger of Axis Max Life into MFSL. This structural simplification is a massive value-unlocking event that the market is aggressively pricing in.
> Earnings Blowout: In Q3 FY26, Value of New Business (VNB) surged 30% YoY , and overall revenue grew by 18% . The New Business Margin (NBM) expanded to an impressive 24.1%.
> Sector Tailwinds: Regulatory reforms aiming to increase the FDI limit in insurance to 100% are bringing aggressive institutional buying into top-tier private insurers.
๐ 2. The Chart Structure (The 10-Year Channel)
> The Breakout: The stock broke out of the angular resistance three weeks ago.
- The Re-test (This Week): The stock hit โน1,892.50 and then saw natural profit-booking, closing at โน1,813.40.
- Significance: Breakouts from decadal patterns almost always feature a re-test. The fact that the volume dried up during this week's red candle (2.97M) compared to the breakout weeks shows a lack of selling pressure. It is simply a "cooling off" phase.
๐ 3. Volume & Indicators
> EMAs: The Positive Crossover (PCO) across all timeframes confirms absolute trend harmony. The stock is in a confirmed "Markup Phase."
> RSI: RSI dipped from the overbought zone. This is actually incredibly healthy. A slight dip in RSI relieves the "overheated" momentum, giving the stock the energy to launch its next leg up toward โน2,000 without crashing under its own weight.
๐ฏ 4. Future Scenarios & Key Levels
The stock is in "Price Discovery" mode, validating Fibonacci-based extensions.
๐ Bullish Targets (The Extension):
- Target 1: โน1,960.
- Target 2: โน2,085.
๐ก๏ธ Support (The "Must Hold"):
- Immediate Support: โน1,785 โ โน1,790.
- Structural Support / Stop Loss: โน1,655. If the stock falls back below this, the decadal breakout is invalidated (a massive "Bull Trap"), and it returns to the old channel.
Sensex - Expiry day analysis Feb 26Price has formed a range between 83k and 82k. In the lower time frame, we can see the price is at the channel support. Sustaining above the current level can make the price to move towards the channel resistance at the 83200 zone.
Buy above 82200 with the stop loss of 82040 for the targets 82340, 82500, 82680, 82800 and 82960.
Sell below 81900 with the stop loss of 82060 for the targets 81760, 81600, 81460, 81320 and 81200.
The expected expiry day range is 81700 to 82500.
Always do your analysis before taking any trade.
GBP/USD (1H) Technical AnalysisGBP/USD (1H) Technical Analysis
Smart Money Concepts (SMC) Structure-Based Outlook
1. Market Context
On the 1-hour timeframe, GBP/USD is trading within a broader short-term recovery phase after a prior impulsive bearish leg. Price is currently positioned mid-range between a well-defined support zone (demand) and a higher resistance zone (supply).
The chart reflects Smart Money Concepts (SMC) elements including:
CHoCH (Change of Character)
Break of Structure (BOS)
FVG (Fair Value Gap)
POI (Point of Interest)
Clearly defined Support and Resistance zones
2. Structure Analysis
๐น Early Bearish Phase
A CHoCH signaled the shift from bullish to bearish structure.
This was followed by a strong impulsive sell-off creating a new lower low.
The downside move established a clear bearish order flow.
๐น Accumulation & Demand Reaction
Price reached a strong support zone (~1.3440โ1.3460).
Multiple rejections suggest institutional demand.
This area acts as a higher-timeframe liquidity pool.
๐น Bullish Break of Structure (BOS)
A subsequent BOS confirmed short-term bullish order flow.
The bullish leg left behind a visible FVG, indicating imbalance.
The POI aligns with discount pricing inside the range.
3. Current Price Position
Price is now:
Retracing from a recent local high (~1.3580 area).
Moving back toward the support zone marked as โENTRYโ.
Potentially completing a corrective pullback before continuation.
This creates a classic pullback-to-demand continuation setup.
4. Trade Scenario Outlook
๐ข Bullish Scenario (Higher Probability Based on Structure)
Pullback into the support/demand zone.
Confirmation via:
Bullish rejection candles
Lower timeframe BOS
Liquidity sweep below support
Target:
Upper resistance zone (~1.3640โ1.3660)
Risk-to-reward appears favorable if entry occurs deep in demand.
๐ด Bearish Invalidation
A clean break and sustained close below the support zone.
That would reintroduce bearish continuation toward lower liquidity.
5. Liquidity & Institutional Perspective
Equal highs near resistance suggest buy-side liquidity resting above.
The projected move likely aims to sweep that liquidity.
Market structure currently favors accumulation over distribution.
6. Professional Summary
The 1H structure shows:
Transition from bearish to bullish order flow.
Valid BOS confirming short-term upside bias.
Pullback into demand offering potential continuation entry.
Clear liquidity target at resistance.
Bias: Short-term bullish toward 1.3640โ1.3660, provided support holds.
US Dollar Index (DXY) โ 2H ChartUS Dollar Index (DXY) โ 2H Chart
Distribution at Major Resistance with Pullback Toward Main Support
Executive Summary
The US Dollar Index (DXY) on the 2-hour timeframe is trading into a clearly defined strong resistance zone (~97.55โ97.65) after a sustained bullish recovery from the main support area (~96.20โ96.40). Price is compressing beneath resistance, showing signs of potential distribution. The structure suggests elevated probability of a corrective move toward lower liquidity, with 96.40 as the primary downside objective.
Market Structure Analysis
1. Higher-Timeframe Context (2H Structure)
Price rebounded sharply from the main support (96.20โ96.40).
A Break of Structure (BOS) confirmed bullish intent mid-range.
Subsequent impulsive move created Fair Value Gaps (FVGs), indicating strong institutional participation.
Current price is testing prior supply where multiple rejections previously occurred.
2. Resistance Zone (97.55โ97.65)
Clearly defined supply area with prior swing highs.
Multiple recent rejections signal absorption and possible exhaustion.
Liquidity likely rests above recent equal highs โ potential for a short-term liquidity sweep before reversal.
3. Support & Downside Targets
Initial pullback level: 97.00 (minor intraday structure)
Intermediate target: 96.70โ96.80 (inefficiency fill zone)
Primary target: 96.35โ96.40 (Main Support / Point of Interest)
The projected move suggests a rotation back into prior demand, potentially completing a range cycle.
Order Flow & Liquidity Perspective
Market has transitioned from accumulation at lows โ markup phase โ current distribution near highs.
Compression under resistance often precedes expansion.
Risk-reward favors downside positioning near resistance versus chasing late bullish continuation.
Bias & Scenarios
Primary Bias: Short-term Bearish Rejection
Entry interest near 97.55โ97.65
Invalidation: Sustained 2H close above 97.70
Target zone: 96.40
Alternative Scenario (Bullish Continuation)
Clean breakout and hold above 97.70
Would likely trigger stops and fuel expansion toward 98.00+
Requires strong momentum confirmation
Professional Assessment
The structure reflects a classic range-to-range rotation setup:
Buy low (main support)
Sell high (strong resistance)
Unless buyers decisively break and hold above resistance, probabilities currently favor a corrective move lower to rebalance inefficiencies and test demand.
Disclaimer
This analysis is provided for educational purposes only and does not constitute financial, investment, or trading advice. Financial markets involve substantial risk, and past price behavior does not guarantee future results. Always conduct your own research and consult with a licensed financial professional before making trading or investment decisions.
Jio Financial Near Support ZoneNSE:JIOFIN
jio financial near to the ga [ support and support also taken today but not sustainable.
let see what next happen already price near to the ipo price. gap support, channel trendline support. candle pattern support. this all are positive points.
Negative point
break the all support ๐
please do your own research i am not financial advisor
HAL: A DOWNWARD CHANNEL POSSIBLE BREAKDOWN WITH 1:4 RR?โข HAL is on downtrend for the last 9 months with lower low formation
โข It is trending inside the downward trending channel since may 2025
โข Stock recently tested the 4000 physiological level and made a bounce back
โข However, could not sustain the higher level and rejected from the middle of the channel
โข It is again retesting the 4000 level which is now weak support due to multiple tests.
โข Fundamental bad news with entry of private player in defense sector. Multiple Tejas fighter jet crash.
โข PE ratio is at 33x
โข Wait for a Breakdown of swing low near 3950 and go short.
โข A possible downfall to 3000-3100 zone.
โข A potential of 1:4 RR.
โข A F&O stock hence could make aggressive put spread or bear put spread with high RR.
โข Wait an watch till the swing low 3950 breaks.
โข An educational purpose study. Not a recommendation.
โข Happy charting ๐
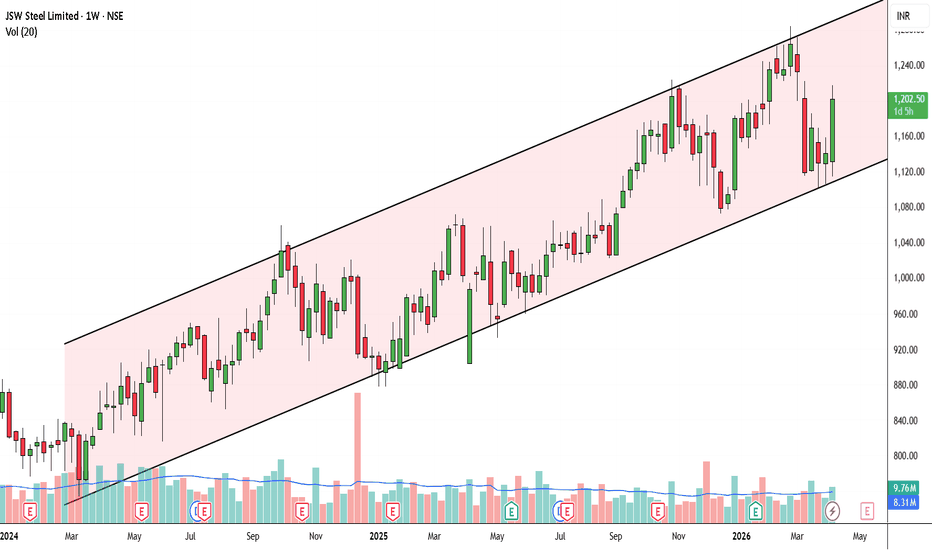
JSW STEEL-Likely Triple Bottom and Channel breakoutJSW STEEL
Trading at 1256 and above all its critical moving averages even in weekly chart
Consolidated within the channel and formed triple bottom and its neckline resistance between 1250-1300,trading above 1250 and giving a breakout above 1300 likely to test 1400-1500 band.(For educational purpose only)
HAL Compressing in Channel โ Bounce Setup Taking ShapeHAL has corrected from 5674.75 to 3046.05 forming Wave W.
The rally to 5165 unfolded in three waves, and price has now declined in an abc structure to 3952 inside a descending channel.
This zone aligns with the 0.5โ0.618 Fibonacci retracement of the 3046 to 5165 move.
Structure suggests a possible short-term bounce toward prior high near 5165.
Trade Plan
Buy Area: 3855 โ 4100
Target: 5165
Invalidation / SL: Weekly close below 3855
If price sustains above 5165, structure turns stronger.
If 3855 breaks, probability shifts toward deeper downside.
Defined risk. Defined target. Let see how the strcuture plays out.
Disclaimer: This analysis is for educational purposes only and does not constitute investment advice. Please do your own research (DYOR) before making any trading decisions.
BTC Reversal or still bearish (13/02/2026).BTC is trading in a parallel channel.
Major Trend :- Bearish
Minor Trend :- Range Bound.
A bearish scalp trade can be taken upto the support levels of the channel. With a SL being a candle closing above the channel.
If there are halt candle near the resistance levels and a BO occurs, a 1000 points trade in BTC can be taken and trailed upto the upper levels if the trend line resistance is also breached.
Actually, there are good targets on the upper side with good RR.
Bullish Plan
Entry :- Close above 67600
SL :- 66800
Target :- 68350, 71460.
R:R = 1:1 and 1:4.5 (considering Target 2).
As per the plan, BTC will give a double BO i.e. 20 EMA (4H) and Resistance Zone.
Wait for the price action. BTC is in a sideway to volatile zone.
Enter with a proper SL and trail target on the upper side.
On the Bearish side, there is limited targets or a scalp trade.
Happy Trading.
KSOLVES | Long-term Investment IdeaStock Name: KSOLVES
๐ Breakout Context: Channel and resistance breakout confirmed with strong volume today, adding conviction.
TRADE PLAN
๐ฐ Buy near CMP: 304
๐ฏ Target: 495 (+62.8%)
๐ Stop Loss: 255 (-16.1%)
โ๏ธ Risk/Reward Ratio: ~1 : 3.9
๐ Key Notes
๐ Strong volume breakout suggests genuine momentum; monitor for retests.
๐ Healthy retest zone: 285โ304 (as long as price holds above stop loss).
๐ Trail stop loss upward as price advances to secure gains.
TRACXN | Channel & Trendline Broken Today with Huge VolumeStock Name: TRACXN
๐ Breakout Context: Channel and trendline breakout confirmed with strong volume today, adding conviction.
TRADE PLAN
๐ฐ Buy near CMP: 38
๐ฏ Target: 73 (+92.1%)
๐ Stop Loss: 31 (-18.4%)
โ๏ธ Risk/Reward Ratio: ~1 : 5.0
๐ Key Notes
๐ Strong volume breakout suggests genuine momentum; monitor for retests.
๐ Healthy retest zone: 36โ38 (as long as price holds above stop loss).
๐ Trail stop loss upward as price advances to secure gains.
Inox Wind: Decision Zone at 200-WMA โ Bounce or Breakdown?Inox Wind is currently trading at an important technical zone, sitting near the 200-week moving average . This area often acts as long-term support, but it is not a guarantee of a reversal .
From a structural perspective, the broader move looks corrective , unfolding as a (W)-(X)-(Y) pattern . The decline from wave (b) appears to be forming an (a)(b)(c) correction , moving inside a descending channel , which keeps the broader trend under pressure for now.
The 100% Fibonacci extension of wave (a) from (b) comes around 96.66 , while the 100โ104 zone acts as a major support pivot. This zone becomes crucial going forward.
Bullish scenario:
If price holds above the 100โ104 zone , breaks the descending channel, and is supported by a clear volume expansion , it could signal that the corretion is nearing completion and a trend reversal attempt is underway.
Bearish scenario:
A weekly close below ~100 , especially without any volume support, keeps the corrective structure active and opens the door for a deeper move toward the 40โ60 support zone , where the next meaningful demand area exists.
At this stage, volume remains the key missing confirmation . Without a volume breakout, any bounce should be treated as corrective , not impulsive.
Overall, Inox Wind is at a decision point , where the next few weeks of price action and volume behavior will likely define the next major trend.
Disclaimer:
This analysis is for educational purposes only and does not constitute investment advice. Please do your own research (DYOR) before making any trading decisions.