Websol Energy System Ltd – Bullish Pennant/Flag Breakout WatchNSE:WEBELSOLAR | Chart: Daily | CMP: ₹104.29
Setup:
WEBSOL had a strong impulsive rally from the ~₹50 zone in March 2026 to ~₹130 in April — a sharp "flagpole" move on rising volume. Since then, the stock has been consolidating in a tightening descending/symmetrical wedge pattern for nearly 3 months, with lower highs and a flattening base near ₹95–100.
This structure resembles a classic bullish flag/pennant continuation pattern.
Key levels:
Flagpole base: ₹50
Flagpole high: ₹130
Consolidation support: ₹95–100
Trendline resistance (upper boundary of flag): ~₹110–115
Breakout trigger: Close above ~₹110 with volume expansion
Projected targets (if breakout confirms):
Using the measured-move method (flagpole height added from breakout point):
Target 1: ₹150–160
Target 2: ₹185–200
Invalidation:
A daily close below ₹95 would invalidate the bullish structure and suggest continuation of the range/consolidation rather than a breakout.
Volume note:
Volume has been relatively muted during the consolidation phase (typical for flags), but a genuine breakout should ideally come with a noticeable volume spike above the recent average — without that, treat any upside move with caution as it could be a false breakout.
Disclaimer:
This is purely a technical pattern observation for educational purposes, not investment advice. Flags/pennants don't always resolve in the expected direction — always confirm with volume, price action, and your own risk management before acting.
Pennant
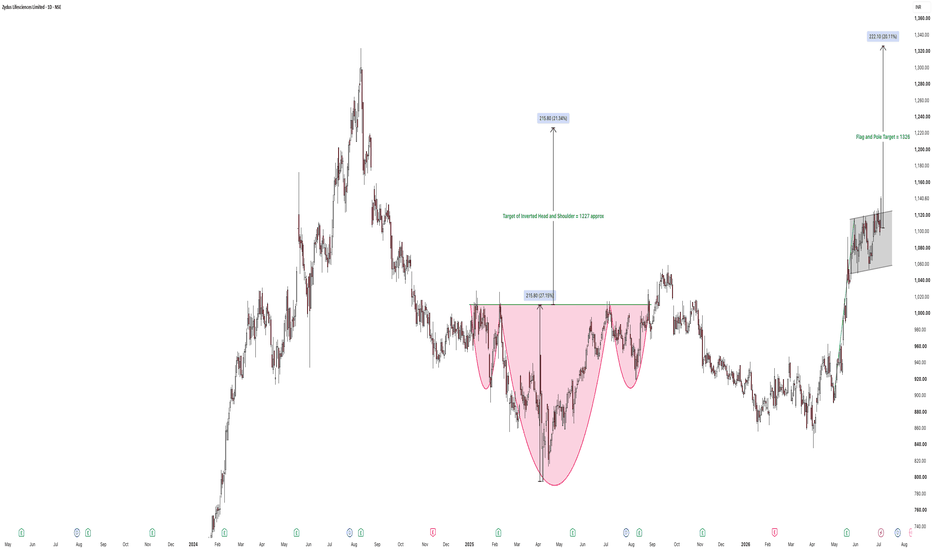
Zydus Lifesciences: Bullish Pennant After Strong RallyZydus Lifesciences: Bullish Pennant After Strong Rally | Continuation Setup 📈
Zydus Lifesciences is showing a strong bullish continuation structure after a sharp impulsive move.
Previously, the stock delivered a clean Inverse Head & Shoulders breakout, however the target didnt hit at the right time and the breakout could not sustain. Now, price appears to be forming another bullish continuation setup.
Key Observations:
• Strong breakout rally forming the flagpole
• Tight consolidation near highs
• Higher lows indicating sustained buying pressure
The current structure resembles a bullish pennant / tight flag, which often acts as a continuation pattern in strong uptrends.
Breakout Zone
A decisive breakout above 1125–1145 can confirm the next leg higher.
Targets
🎯 Target 1: 1225
🎯 Target 2: 1326
🎯 Extended Target: 1400+
Risk Management
Key support lies near 1045–1080.
A breakdown below this zone weakens the bullish setup.
My view:
Bulls remain in control as long as price holds the consolidation range. A clean breakout may trigger fresh momentum.
Not financial advice. Manage risk properly.
#Zydus #PharmaStocks #TechnicalAnalysis #SwingTrading #ChartAnalysis #NSE
If you like to see more posts, please do show appreciation by liking this post and following me on:
in.tradingview.com/u/lovishkhanduja/
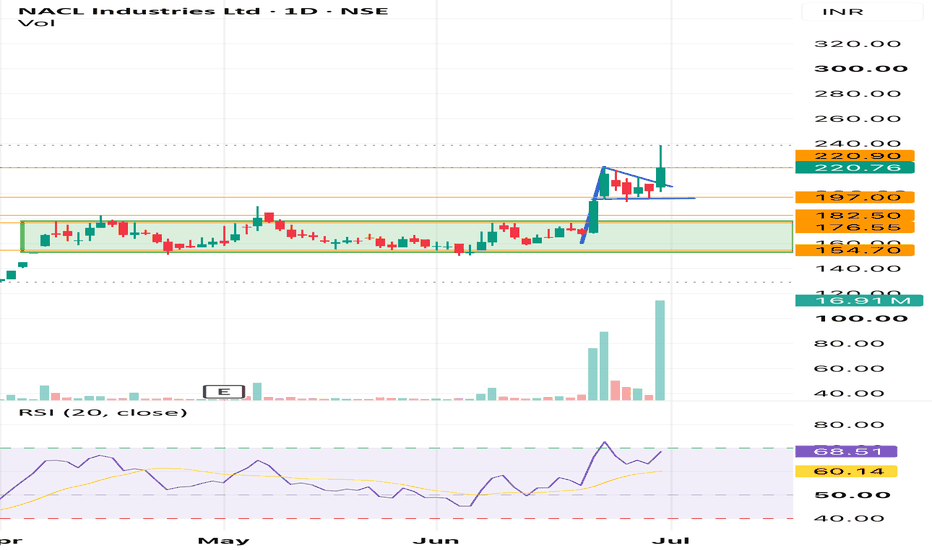
NACL Industries Ltd. – Bull Flag Breakout Attempt | High Volume NACL Industries Ltd. – Bull Flag Breakout Attempt | High Volume Confirmation
After a prolonged consolidation between ₹155–₹177, the stock has finally delivered a strong range breakout with exceptional volume, indicating aggressive institutional participation.
The recent rally from the breakout zone paused near ₹210, where price formed a bull flag / pennant. Today’s candle has closed above the flag resistance with another surge in volume, suggesting the continuation of the uptrend.
Technical Observations
* ✅ Multi-week consolidation breakout already confirmed.
* ✅ Bull Flag breakout after a sharp impulsive move.
* ✅ Fresh volume expansion supports the breakout.
* ✅ RSI around 68—strong momentum without entering extreme overbought territory.
* ✅ Price is making higher highs and higher lows, maintaining bullish market structure.
Key Levels
* Immediate Resistance: ₹220–223 (today’s closing zone)
* Next Targets: ₹240 → ₹255 → ₹270
* Major Support: ₹197 (flag breakout level)
* Strong Demand Zone: ₹182.5–177
* Invalidation: Sustained close below ₹197 may result in a retest of the ₹182–177 zone.
Trading Plan
* Aggressive traders may consider entries on sustained trade above ₹221–223 with strong volume.
* Conservative traders can wait for a pullback and successful retest of ₹197–205 before initiating fresh positions.
* Trail stop-loss below each higher low instead of booking profits too early if momentum continues.
Risk Factors
The stock has rallied sharply in a short period. A brief consolidation or pullback would be healthy and should not be viewed as bearish as long as ₹197 remains intact.
⸻
Disclaimer: This analysis is purely for educational purposes and reflects my personal interpretation of the chart. Please do your own research and use proper risk management before taking any trading decision.
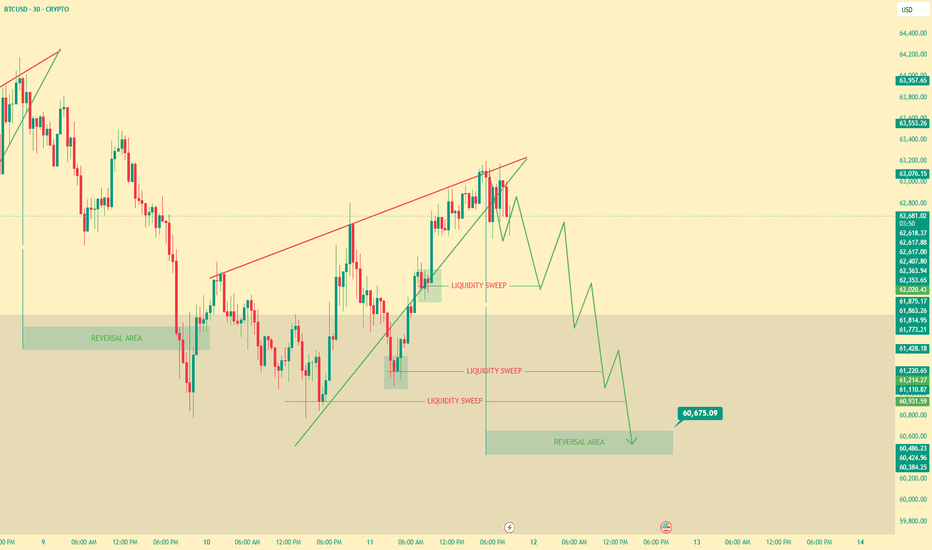
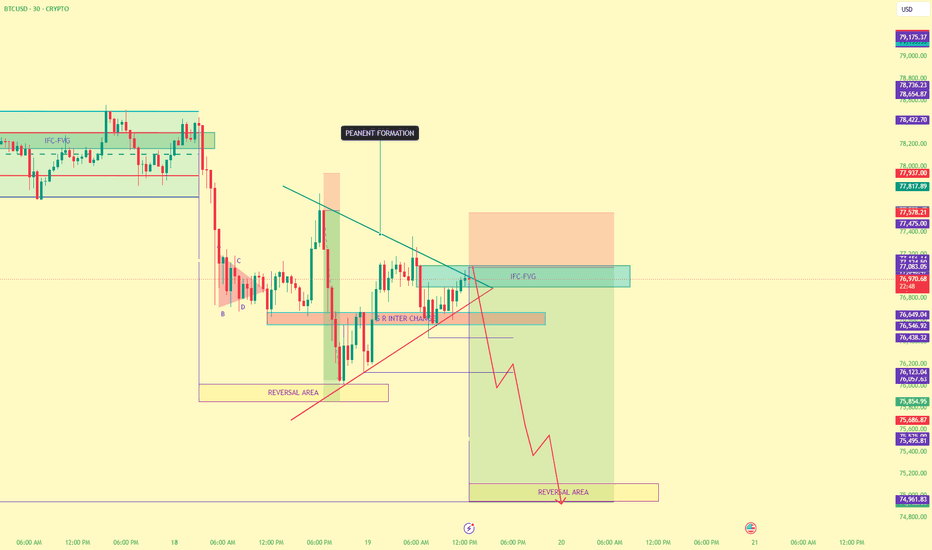
PREDICTION ON BTCUSD 30 MIN TFCRYPTO:BTCUSD HAS FORMED A PEANENT WHICH IS BEARISH CHART PATTERN
FORM HERE WE CAN SEE A FALL TILL 60,675.
The reason for a bearish prediction is the liquidity remaining at the major and minor change change of character of the pennant.
CRYPTO:BTCUSD 30MIN TF BIAS = BEARISH
PREDICTION ON BTCUSD 30 MIN TFCRYPTO:BTCUSD showing a strong bearish continuation setup combined with a developing bearish pennant structure, which further strengthens the probability of downside delivery. The overall market behavior suggests that the current consolidation is not genuine bullish accumulation, but rather a pause before another impulsive bearish move.
The market has already completed several important phases:
- Buy-side liquidity inducement
- Rejection from premium reversal areas
- Market structure shift toward bearish delivery
- Internal liquidity sweeps
- Creation of inefficiencies below current price
The pennant visible near the current price action reflects:
- Weak bullish recovery
- Decreasing momentum during retracement
- Compression of liquidity
- Seller absorption inside consolidation
As long as these liquidity pools remain untapped, downside pressure remains dominant.
Until price invalidates the pennant with strong bullish acceptance above the reversal zone, the probability remains tilted toward:
Pennant breakdown → bearish displacement → sell-side liquidity sweep → move into the lower reversal area.
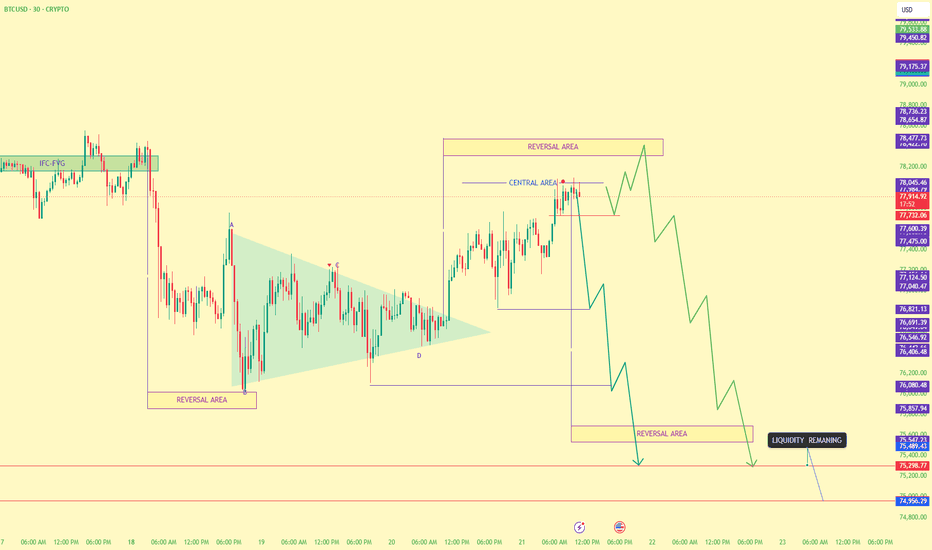
PREDICTION BTCUSD 30 MIN TFCRYPTO:BTCUSD is showing the formation of a bearish pennant, which is generally considered a continuation pattern favoring downside momentum. After the breakout, the market appears to be giving a fake upside move to trap buyers before the actual bearish move begins.
The price is trading inside the central area of the reversal zone, creating two possible scenarios.
1. The First possibility is that since price is already inside the central reversal region, the market may reject directly from current levels and begin the downside move without another major push upward.
2. The Second possibility is that BTCUSD pushes higher into the marked reversal area to complete the liquidity grab and trap late buyers before initiating a strong bearish decline.
Liquidity is still resting below the current market structure, which increases the probability of a sharp bearish expansion toward the lower reversal area.
As long as the pennant structure remains valid, The overall expectation remains bearish with downside liquidity acting as the primary target.
PREDICTION ON BTCUSD 30 MIN TFCRYPTO:BTCUSD chart is showing signs of a potential bearish continuation setup, mainly due to the formation of a pennant pattern after a strong impulsive downside move. A pennant generally represents a temporary consolidation before the market continues in the direction of the previous trend — in this case, bearish momentum.
One of the most important aspects visible on this chart is the presence of resting liquidity below the current price.
If the pennant breaks downward:
- BTC could initiate a fast impulsive move lower.
- The projected path suggests price may sweep the liquidity resting below intermediate
- The market could then continue falling toward the marked reversal area, where stronger
buying interest may finally appear.
- Bearish trigger zone: Breakdown below the pennant support and internal structure.
- Liquidity targets: The lows beneath the current consolidation.
- Major reversal area: Around the highlighted bottom demand zone near the lower boundary of the chart.
Overall structure currently favors the bears. The pennant formation, combined with downside liquidity attraction and rejection from the IFC-FVG area, suggests that BTCUSD may be preparing for another significant leg down. Until buyers reclaim higher structure levels convincingly, the probability of a liquidity sweep toward the reversal area remains elevated.
BTCUSDT:Testing Key Downward Trendline at Critical Reversal ZoneIf the 2H trendline breaks, then the market direction goes upside.
Bitcoin is trading inside a key reversal zone after a prolonged corrective phase, currently testing a major descending trendline for a potential bullish breakout.
Market Structure: Bearish market structure on the 2H chart characterized by a sequence of lower highs and lower lows.
Trendline Resistance: Price action is tightly hugging a well-defined descending trendline, compressing just under the diagonal resistance.
Support & Demand: The asset has entered a crucial "Reversal Area" / demand zone between $75,650 and $76,250, showing initial signs of price absorption.
Supply References: A clear historical "Supply 2x" zone remains unmitigated above, acting as a secondary magnet if structural shifts occur.
Trading Scenarios
Bullish Trigger: A clean 2H candle close above the descending trendline confirms a market structure shift to the upside.
Bearish Continuation: Failure to break the trendline may lead to a deeper liquidity sweep below the current reversal area.
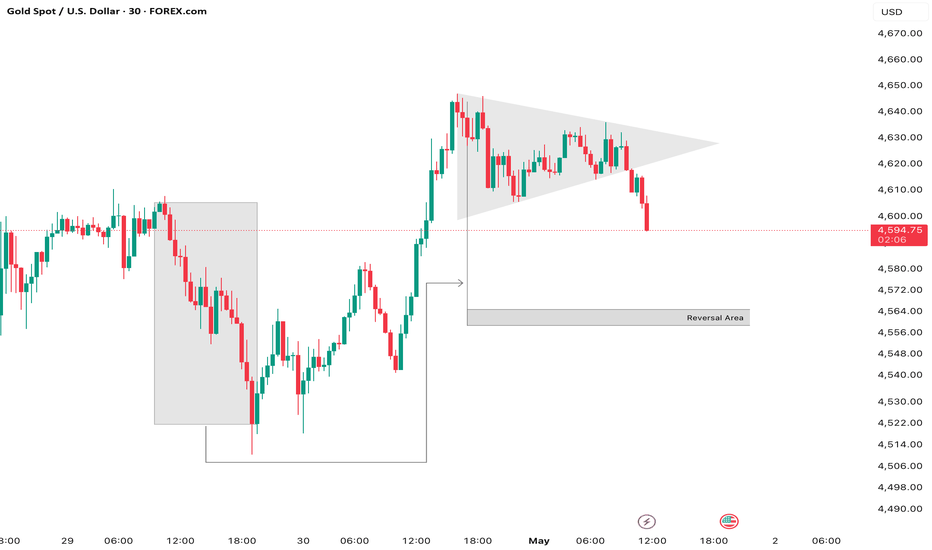
Gold Spot / U.S. Dollar (XAU/USD) shows a Bearish Pennant pattenReversal Area: The highlighted gray box around 4,561 – 4,582 is a critical support zone. If this zone fails to hold on a daily close, it may open the path for a deeper move toward 4,500 – 4,515. 30-minute timeframe, with price currently testing a "Reversal Area" near 4,560.
Bearish Price has been making a series of lower highs and lower lows after failing to sustain above the 4,646 resistance.
Pennant Pattern: The gray shaded converging trendlines represent a bearish pennant—a continuation pattern indicating that after a sharp drop (the "pole"), sellers are consolidating before potentially pushing price lower.
Flag Pole and Pennant - Bullish ContinuationOverview
This chart shows a classic Bullish Pennant pattern forming after a strong impulsive upward move.
• The sharp vertical rise represents the Flag Pole, showing strong buying momentum.
• After this move, price enters a small triangular consolidation, forming the Pennant.
• This consolidation reflects a temporary pause where the market absorbs the previous rally.
⸻⸻⸻⸻⸻⸻⸻⸻⸻⸻
📊 Chart Highlights
• Strong bullish flag pole before consolidation.
• Pennant structure showing tightening price range.
• Price consolidation near the upper zone of the move.
• Breakout zone marked above pennant resistance.
• Pattern supports continuation of the prior uptrend.
⸻⸻⸻⸻⸻⸻⸻⸻⸻⸻
📉 Key Price Action
• The flag pole confirms strong bullish momentum.
• The pennant indicates short-term consolidation after the sharp rise.
• Price is compressing within converging trendlines.
• A breakout above the pennant may confirm bullish continuation.
• Sustained movement above the breakout zone can open the path for further upside.
⸻⸻⸻⸻⸻⸻⸻⸻⸻⸻
📌 Summary
This setup reflects bullish continuation behavior, where a strong rally is followed by consolidation before the next potential move higher. A clean breakout above the pennant would strengthen the bullish case.
⸻⸻⸻⸻⸻⸻⸻⸻⸻⸻
⚠️ Disclaimer
📘 For educational purposes only.
🙅 Not SEBI registered.
❌ Not a buy/sell recommendation.
🧠 Purely a learning resource.
📊 Not Financial Advice
⸻⸻⸻⸻⸻⸻⸻⸻⸻⸻
CDSL Healthy and also wealthy swing tradeNSE:CDSL
CDSL chart have two pattern.
1. Most common and effective W pattern
2. pennant pattern
possibilities of trade.
Bull Scenario
1. W pattern forming and breakout.
2. pennant breakout.
Bear Scenario
1. Pennant breakdown.
Special Bull Scenario 😅 (People who have always in profit)
1. Pennant breakdown then after take support and break lifetime high
(Extreme bull scenario 😅)
Why this is healthy and wealthy?
Because this is stock have a strong trend stock and also have strong fundamental. so, if third possibility happen then also this stock again can be bounce back and ultimately break his current lifetime high.
why this logic i use, this has also reason
Because of this is a depository service and India have still not have 40 percentage of demat account of total population.
I am not financial advisor.
So, risk is yours 😅
do your own research before taking any decision
Please feel free to ask any questions
it's free 🙂
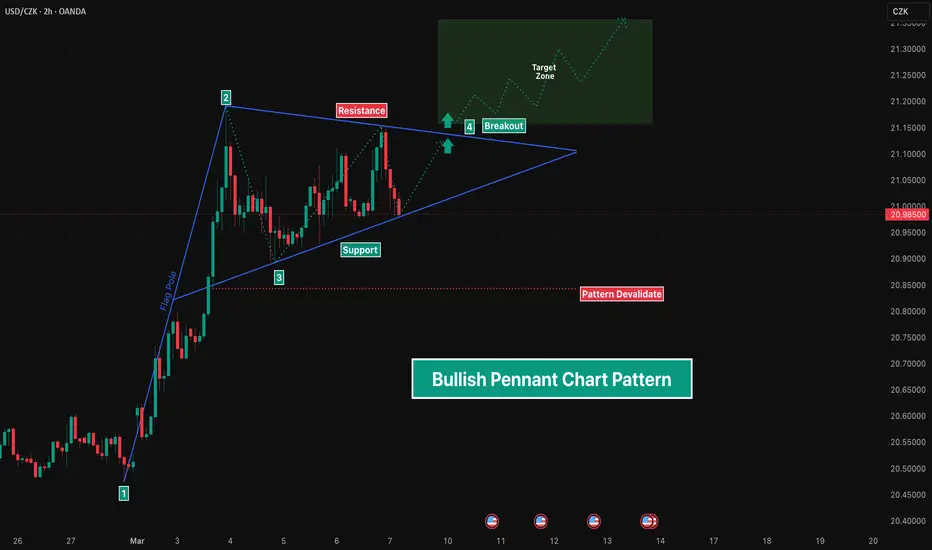
Bullish Pennant Chart PatternOverview
A Bullish Pennant is a continuation pattern that forms after a strong upward price movement. It represents a brief consolidation phase where the market pauses before potentially continuing in the direction of the prevailing trend.
The pattern consists of a sharp impulsive rally known as the flagpole, followed by a small symmetrical triangle consolidation called the pennant. When price breaks above the upper boundary of the pennant, it often signals continuation of the uptrend.
⸻⸻⸻⸻⸻⸻⸻⸻⸻⸻⸻
Key Features
• Strong Impulse Move (Flagpole)
A rapid upward price movement creates strong bullish momentum.
• Triangle Consolidation (Pennant)
Price consolidates inside converging trendlines, forming a tight structure.
• Volume Contraction
Trading activity often decreases during consolidation.
• Breakout Confirmation
A breakout above the upper trendline indicates continuation of bullish momentum.
• Measured Move Target
The projected target is often estimated using the height of the flagpole.
⸻⸻⸻⸻⸻⸻⸻⸻⸻⸻⸻⸻
Chart Explanation
1️⃣ Flagpole Formation
Price makes a strong impulsive rally, creating the initial upward momentum.
2️⃣ Resistance Reaction
After the rally, price begins consolidating as buyers temporarily pause and profit-taking appears.
3️⃣ Support Formation
Higher lows develop within the structure, showing buyers are still defending price.
4️⃣ Pennant Structure
Price compresses between descending resistance and rising support, forming the pennant.
5️⃣ Breakout Scenario
A breakout above the upper trendline may trigger continuation toward the projected target zone.
⸻⸻⸻⸻⸻⸻⸻⸻⸻⸻⸻⸻
Observation
• Strong bullish momentum preceded the consolidation.
• Price is compressing within a tightening triangle structure.
• Breakout direction will determine the next phase of the trend.
⸻⸻⸻⸻⸻⸻⸻⸻⸻⸻⸻⸻
Summary
The Bullish Pennant represents a temporary pause within a strong uptrend. If price breaks above the pennant resistance, it may signal continuation of the existing bullish momentum toward higher levels.
⸻⸻⸻⸻⸻⸻⸻⸻⸻⸻⸻⸻
Conclusion
📘 For educational purposes only.
🙅 Not SEBI registered.
❌ Not a buy/sell recommendation.
🧠 Purely a learning resource.
📊 Not Financial Advice.
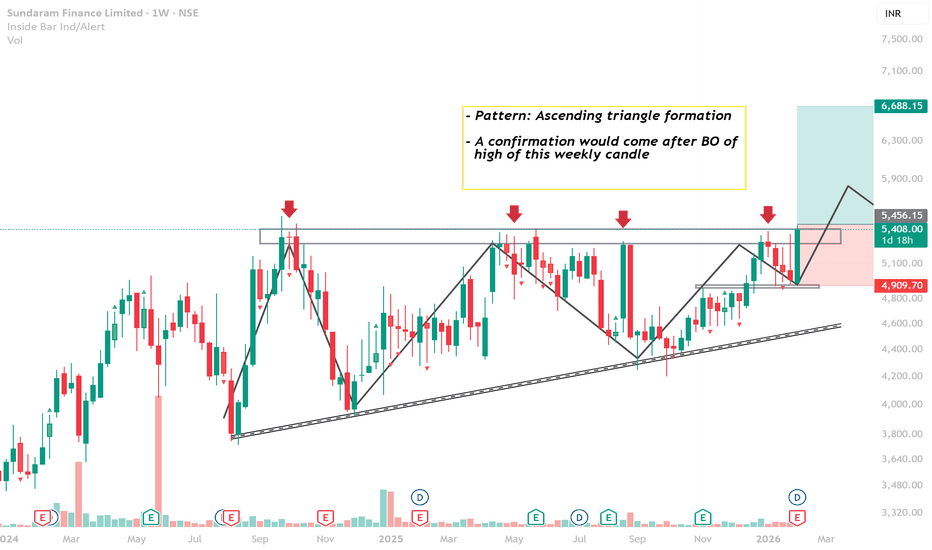
Ascending triangle formation in sundaram financeA sign of good consolidation and a possible breakout in sundaram finance technical chart.
A clear breakout confirmation would only after the high of the weekly candle is crossed.
This can be a good investment opportunity based on technical pattern.
DISC: Please invest based on your financial advisor advice only. This is not a buy or sell recommendation.
BCG imaginary analysis NSE:BCG
BCG imaginary analysis 😅
bcg currently shows little bit positive sign (i say little bit).
chart explainer it self.
weekly basis price VCP pattern started form and also similar to head and shoulders pattern but this is started form but not formed this is a big difference that's why i say this is imaginary analysis 😅
this stock have also some fundamental issue so check before than take any action.
please do your own research before taking any trade.
i am not financial advisor
risk is real stay practical
please feel free to ask any questions
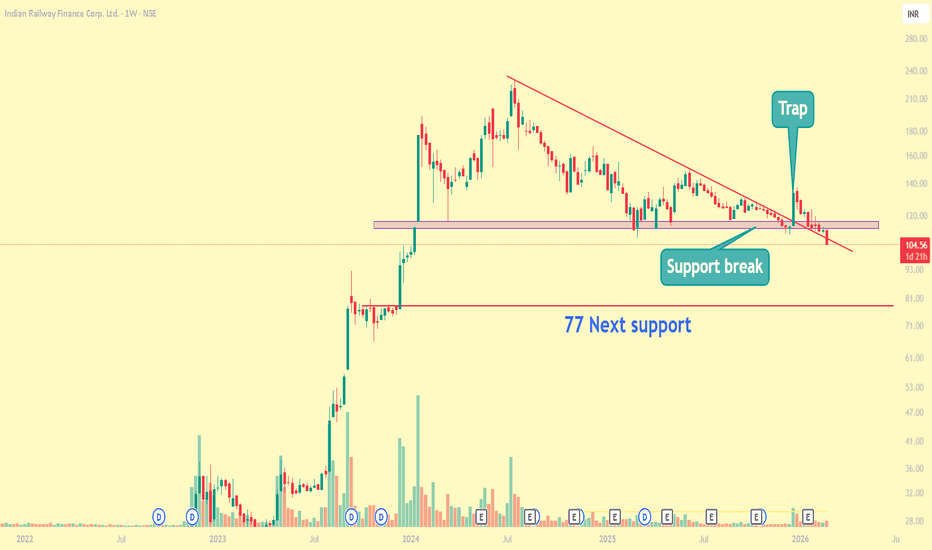
IRFC Hope is overNSE:IRFC
Many people wait for follow through buying but today support break with gap down.
one trendline breakout trap already happened.
now next support is 77.
Bull scenario
Again trap happen to support breakdown. (price go upside from tomorrow)
I know many people stuck at high price.
here is two options
1. wait and buy more at reversal (this option more painful when reversal not happen at first support at 77)
2. exit and find another opportunity
Please do your own research before talking any trade.
I am not financial advisor.
Please comment your doubts and questions.
It's free 🙂
Hindustan Copper Ltd. (HINDCOPPER) Price Analysis **Date:*#### **Current Price and Intraday Movement**
- **Latest Price:** ₹237.98 (+5.09% / +₹11.52)
- **Day’s Range:** ₹225.50 – ₹240.10
- **Open:** ₹227.60
- **Previous Close:** ₹226.46
- **Volume:** 1.63 crore shares (well above average daily volume of 55.89 lakh)
#### **Technical Overview**
- **52-Week Range:** ₹183.82 – ₹381.90
- **50-Day Average:** ₹216.99
- **200-Day Average:** ₹260.58
- **Market Cap:** ₹23,013 crore
- **P/E Ratio:** 57.48
- **EPS:** ₹4.14
#### **Recent Performance and Trends**
- **Short-Term Trend:** The stock surged over 5% today, outperforming its sector and showing strong buying interest .
- **Volume Spike:** Today’s volume is nearly triple the average, indicating heightened trader participation .
- **Technical Position:** The stock is trading above its 50-day moving average but remains below the 200-day average, suggesting a recovery from recent lows but still under medium-term resistance .
- **Support/Resistance:** Immediate resistance is near ₹240–₹249 (upper circuit), with support at ₹225 and ₹216 (50-DMA) .
#### **Fundamental Snapshot**
- **Valuation:** High P/E ratio (57.48) signals expensive valuation relative to earnings .
- **Profitability:** EPS at ₹4.14; profit margins have been under pressure.
- **Industry Position:** Hindustan Copper is India’s primary copper producer, with exposure to global copper price trends and domestic infrastructure demand.
#### **Outlook**
- **Short-Term:** Strong momentum and volume could drive further upside if it breaks above ₹240, but overbought conditions may trigger profit booking near resistance.
- **Medium-Term:** Needs to sustain above the 200-DMA (~₹260) for a confirmed trend reversal.
- **Risks:** High valuation and recent volatility; global commodity price swings can impact earnings.
---
**Summary:**
Hindustan Copper is showing robust short-term momentum with strong volume and price gains, but faces resistance near ₹240–₹249. The stock remains fundamentally expensive, and investors should watch for sustained moves above the 200-DMA for a longer-term bullish signal .
Chambal Fertilizers: Exhibits Short-Term WeaknessChambal Fertilizers has recently displayed signs of short-term weakness on its daily chart. The price action indicates a struggle to maintain a position above the 200-day EMA, a widely recognized long-term trend indicator. Despite multiple attempts to close above this crucial level, the stock has been unable to sustain any significant upward momentum, suggesting a prevailing bearish sentiment among market participants.
From a momentum perspective, both the RSI and MACD indicators are currently positioned in what is typically considered the oversold territory. This could imply that the stock has experienced a period of significant selling pressure.
Should the current trend persist, the stock may potentially retest the ₹485 level, which could act as a significant support zone. Conversely, a potential shift in market dynamics could occur if the stock manages to close and sustain above its 200-day EMA for a minimum of two consecutive trading sessions. In such a scenario, traders might consider a revised risk management strategy, with potential stop-loss levels in the range of ₹569 to ₹573 , based on recent price action and potential resistance.
Disclaimer: The information provided in this stock analysis is for informational and educational purposes only and should not be construed as financial advice. Always seek the advice of a qualified financial advisor or conduct your own thorough research before making any investment decisions.
GOLD – 4H | Falling Wedge Structure Near BreakoutGold has been compressing inside a converging falling wedge , a pattern that typically signals waning bearish pressure and an upcoming bullish break. The structure has been developing for several weeks, with each swing clearly showing a loss of momentum from sellers and a stronger defense from buyers at progressively higher lows.
The wedge is now approaching its apex, and price is pressing against the upper boundary. While this setup carries a bullish tilt, confirmation is still critical before acting.
Why this structure matters
This is a Converging Falling Wedge (Bullish) pattern, defined by:
Sellers losing momentum on each downswing
Buyers defending higher lows , tightening the structure
Compression building toward the apex , creating stored energy
Breakouts typically hitting the upper rail first
Confirmation occurring only on a close above the last swing high
In this case, the last swing high sits at 125,521 , aligning perfectly with the wedge’s upper rail.
Only a sustained 4H close above 125,521 would confirm that the market has absorbed overhead supply and is ready to transition into a higher timeframe move.
RSI Check
RSI is trending higher but hasn’t yet signaled full breakout momentum. A push above the 60–65 zone would strengthen the bullish case and support continuation after the breakout.
Trade Plan
Trigger :
Entry only on a sustained 4H close above 125,521 .
This keeps you aligned with pattern confirmation and avoids premature entries inside compression.
Upside path:
A breakout could initially retest the wedge boundary before starting the projected upward leg toward higher resistance zones.
Summary
Gold is displaying a well-defined falling wedge with clear signs of seller exhaustion and buyer strength. The structure leans bullish, but the move needs to be validated through a confirmed break above 125,521 . Until then, the wedge remains a compression zone — not a breakout.
Disclaimer: This analysis is for educational purposes only and does not constitute investment advice. Please do your own research (DYOR) before making any trading decisions.