Ethereum Long Term Analysis!Ethereum Long Term Analysis!
Ethereum Monthly Analysis!
Bearish Pennant PAttern formation in Ethereum on Monthy Timeframe!
If price breaks and closes below trendline support we can see further downmove in Ethereum
Ethereum is forming Bearish Pennant pattern. We can see a sharp downmove in Ethereum from 1 dec 2021 after that price is moving in that way like it is forming a Triangle. So the pattern is established. Many of us won't believe for a Ethereum to move this much downward upto 456
Pennant
breakout done and also retest done Grasim industries has good bulish flag pattern breakout. Above 2226-2245 closing can give good upside in the future. and also retest done very good move chance to breakout all indicator is show strenth but one thing market is life time high no one perdict how much point going up but one thing note always when market is fully high and you are swing trader so quatity always limmited thxx
Full time Trader
Money_chart_pro
blil after dividend ex date sept 20 best to takeblil after ex date of sept 20 will fall 40-80 rupees price may come to 370-400 that is best to accumulate if you want dividend can take or just exit now and take later at lower price
you can consider bpcl also along with blil as a pair swap , if you take bpcl dividend will be 58 rupees and bpcl might fall to 400 also then we can swap to blil resulting in higher dividend ,so after taking dividend rest can be shown as loss which can be also used for book adjustments
disclaimer- this is not any in
Triangle in Power Grid corporation.Many times it is not easy to spot the pattern in candle stick. So comes handy to view charts in line format.
Also to have a satellite it is better to also keep track of monthly chart.
We can see there is clear triangle breakout in this line chart.
One can even consider it as a Pennant at this scale.
Gold awaiting NFP for DirectionsAs Mentioned in the comments section of the last post.
2055 has been capitalised by Bears.
So it is still Too Early to Write off the Bears.
Even FOMC, like most of the times has failed to give directions.
NFP could finally provide clearer Directions hopefully.
Until then, Expecting a Rangebound Movement Between
2053 zone & 2021 zone.
consolidation breakout trading opportunity in CHENNPETROCHENNPETRO consolidating after a big rally, and the stock is in a strong up trend ( stage 2) now the range of the price ( narrow range candles) is tight and volume dried, and today price range expands with increased volume. follow-through range expansion happens it will be a potential short-term swing trading opportunity.
DISCLAIMER: All ideas, opinions, and/or forecasts, expressed or implied herein, are for informational purposes only and should not be considered as a recommendation to invest,
Gold at crucial zone, Awaiting Core Inflation DataGold happens to Remain in Up Trend, however the Exhaustion is becoming apparent.
Mark the Trend Line.
Trending move on either side break and sustain is possible.
Either of the Supply/Demand Zones could be tested.
Looking at the weakness
2000 1980 are possible zones that could be tested in coming sessions.
However, Keep watch on the trendline break.
And take trades only if this Idea resonates with yours.
Cheers!
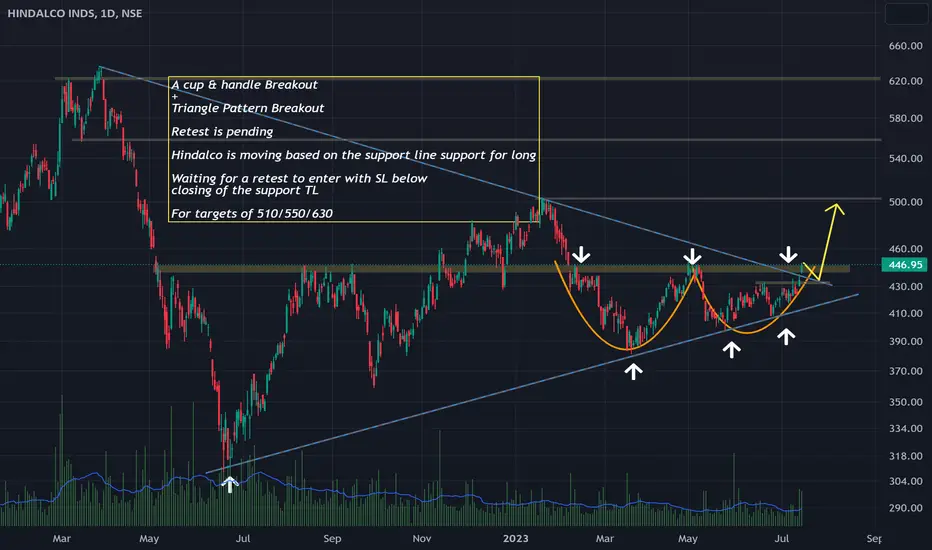
HINDALCO : Cup and Handle BreakoutA cup & handle Breakout in conjunction with Triangle Pattern Breakout
Retest is pending for the triangle pattern breakout.
Hindalco is moving based on the support line support for long.
Waiting for a retest to enter with SL below
closing of the support TL
One can enter now as well with 50 % qty just not to miss the trend for targets of 510/550/630.
DISC: Only for educational purposes. please consult your financial advisor before entering.
GUJARAT NARMADA VALLEY ..GNFCa decent rise in volumes near a breakout arena
If we look at the last few months, the fertilizer companies have done well.
chambal fert, facts, etc are just to name a few
a rounding bottom does generally well with a medium-term perspective
expect the stock to do well as long as its above 700 mark
flag pattern breakout trading opportunity considered this analysis is my journal, not buy sell recommendation
Tata Power formed a flag pattern in daily time and weekly frame
highly bullish pattern, stock in a strong up trend after a short pause again it is breaking out
entry above the flag upper line
stop below the flag lower line