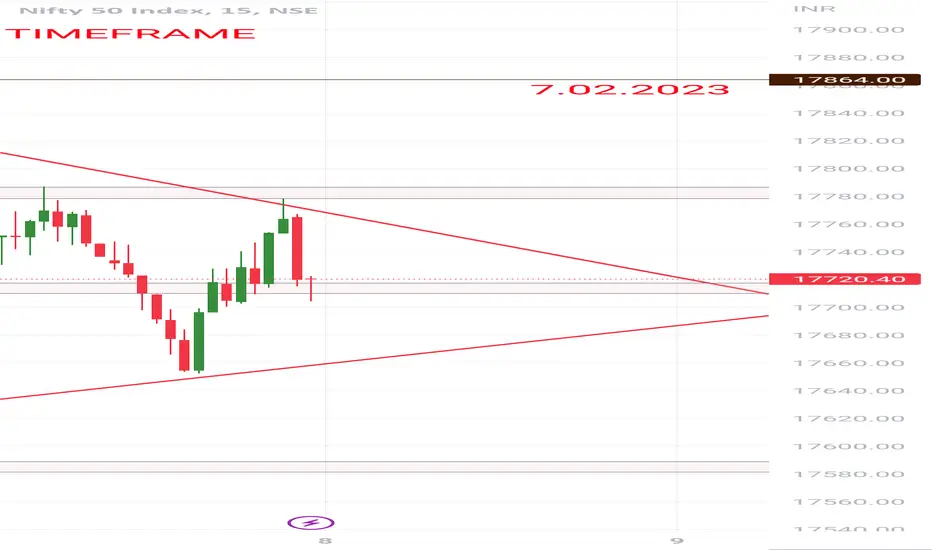
Pennant
BHARTIARTL UNDER BEARS SPECTRUM !!!!Chart Patterns insist me the above titled opinion
REASONS
1. BhartiArtl has been trading inside a Ascending channel pattern(bright red & green trendlines )and right now down swing move is under process(in the form of descending channel)
2. In the weekly time frame , it looks alike a Bearish pennant formation and given breakdown out of consolidation(shown below)
3. In the daily timeframe , Head & Shoulders pattern too visible (shown below)
4. There is Consolidation zone(in fo
Pennant Pattern In technical analysis, a pennant is a type of continuation pattern formed when there is a large movement in a security, known as the flagpole, followed by a consolidation period with converging trend lines—the pennant—followed by a breakout movement in the same direction as the initial large movement, which represents the second half of the flagpole.
Script = Auropharma
Time Frame = 1 Day
Zentec LTH Bullish BreakoutWeekend Pick 3: Zentec
Only for Risky Bulls!
Fundamentals : Decent, Consistent on Sales, Profits, EPS, Healthy Reserves Vs Low Debt, Into Defence Technology and edge into Drone Manufacturing.
Technicals : Very Bullish, ATH, Triangle pattern breakout with huge Volume, well placed above EMAs.
R1: 300
R2: 330
R3: 360
SL: 220
SYNGENE: Ready to Enter the trenchNSE:SYNGENE is showing an interesting pattern.
Not an intraday counter. The interesting point is: it has a channel. The price falls below the channel. But now entering the channel with momentum itching towards 50 (RSI) and volume just picked up the 20 VWMA.
Keep it in WL. The potential price-action path is also shown in purple arrows.
Pennant PatternIn technical analysis, a pennant is a type of continuation pattern formed when there is a large movement in a security, known as the flagpole, followed by a consolidation period with converging trend lines—the pennant—followed by a breakout movement in the same direction as the initial large movement, which represents the second half of the flagpole.
Script = Reliance
Time Frame = 15 min
intradayboth side potential but I am interested in long side
avoid first 15min breakout
wait for 15 min candle closing
targets are marked
if the breakout comes after 10:00 am then the probability of winning will be more.
follow risk management
do your own analysis
do workout
do meditation
start reading books