Pin Bar
An 3W swing trade scenario w/ FibonacciHi traders. I'm bringing in this weekly chart a simple draw of a smart money strategy based on the price action with Fibonacci Retracement 14.6% key level as a worth and effective take profit. I'm using a Ehler's smoothed stochastic to show a logical possible reversal wave to come in the 3W term.
AAPL - Will support @ 128 hold?AAPL had been the most resilient among the FAANG stocks despite being in a volatile and toppish pattern for months. However it started to break below major neckline support @ 134 on 19th Dec and then an attempt to break the horizontal support @ 128.
It managed to close the month with a weekly bullish pin bar above 128 and a potential bullish divergance is also forming between price and RSI on the weekly chart. Hence a near term bounce could happen but any bounce right now is best viewed with a
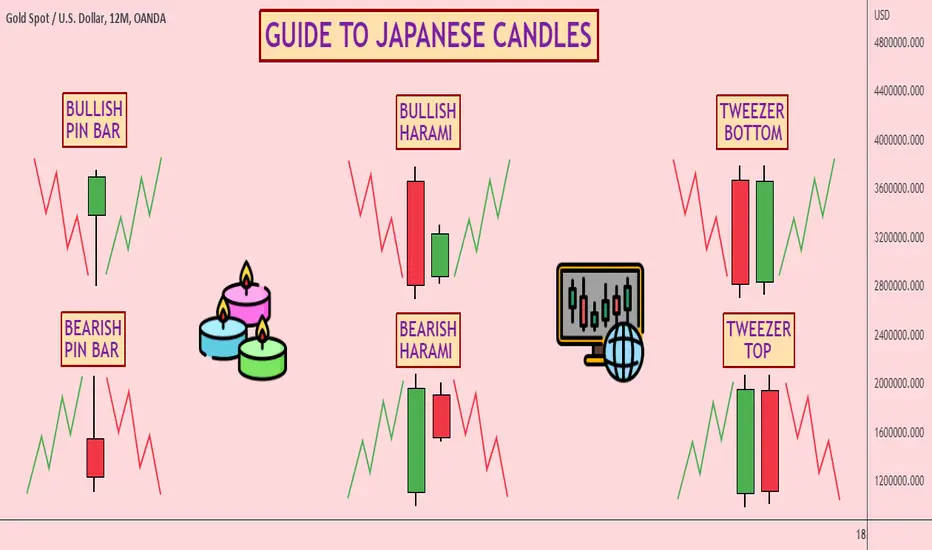
GUIDE TO JAPANESE CANDLESHello everyone!
Today we will discuss JAPANESE CANDLES!
Let's try to understand what they mean and how to use this information in your trading.
LET'S GO!
Bullish and Bearish PIN BAR
A bullish pin bar is a candle with a long shadow, the body of which is located at the top of the candle.
Such a candle was formed under the pressure of sellers who were able to push the price down, after which buyers turned on, who pushed the price above the opening and were able to gain a foothold there.
Trade Ascending Parallel Channel With 3 Points + Pivot PointTrade Ascending Parallel Channel With 3 Points + Pivot Point Indicator
Connect your three points using the parallel channel. First, connect two points which are your higher lows. Next, connect the third point which is the swing high. The swing high is the higher high.
In this example, a pin bar formed at the higher low. Pin Bar wick touches pivot point level and channel support level. Volume Indicator is "green" and pin bar is "white." Conditions are great to enter the market at pin bar
The Best Pull Backs To Trade (Part One)Price pulled back to pivot point level 0.67. Price retraced 50%. Pin Bar candlestick formed at 50% retracement. Open Price and Close Price is "near" 50% retracement level as well at the pivot point level. Candlestick wick protrudes through the pivot point level and retracement level.
This is an ideal condition to enter a trade position using pivot point indicator, fibonacci retracement tool, and pin bar candlestick.
GOOG - Tide could be turningGOOG's monthly chart formed a bullish divergence and closed with a bullish "pin bar" in November. We are likely to see more upside momentum for this month, although it could pause and consolidate when it hits the near term horizontal resistence around 104-105, then may (or may not) dip back towards 93 (recently pivot low), before eventually breaking higher.
Immediately support is currently at 93. Turn cautious if it dips below here.
Disclaimer: Just my 2 cents and not a trade advice. Kindly d
A reversal on the cards for the NZDUSD?Overnight, the NZDUSD continued with the uptrend to climb steadily toward the key resistance level of 0.5950.
With no major news events today, look for the development of price action at this resistance level to signal the next directional bias. A brief reversal back down toward the 0.5850 price level could be required before further upside.
Alternatively, look for the NZDUSD to break above 0.5960 to signal a continuation of the uptrend, with the next key resistance level at 0.6080.
TCS BULLISH Pinbar at breakoutTCS very bullish at CMP 3217, SL 3160, Targets- 3400, 3500, 3700
TCS just broke out of a year long downtrend, and with less than a 3% risk, one can aim for amazing returns.
This idea is based on the pinbar on the last trading day and for a better trade, advisable condition would be a breakout above 3275 with an SL of previous swing.
MSFT- found intermediate supportMSFT gapped down into intermediate support @ 220 today (after another round of "bad" CPI report that spooked the markets) but immediately reversed to form a bullish engulfing candle on the daily chart (and a potential pin bar on weekly chart).
Bullish divergence can be seen on both the weekly and daily charts which gave more conviction to this current support @ 220 (medium term resistence turned support)
Granted that a bounce from an bullish divergence can be just a short term counter trend (i
Topglove. JP Morgan’s TP May “failed” this time. 1/Oct/22Topglove. JP Morgan’s Projection of RM0.45 probably “failed” this time. As other 3 major player already posing a bullish reversal setup based on Elliott wave and cycle. Just waiting for “confirmation” signal. Topglove price has just broken RM0.605 a “confirmation signal “ +++ Price of weekly Topglove, kossan and monthly Harta has formed a hammer candle/ pin bar bullish pattern possible market “price in” A.S.P ( Average Selling Price) increment lead by Topglove as “catalyst” of the beginning of l
SPY - Short term bullish - Quick TradeHello Friends,
AMEX:SPY has shed a lot of value in a week but there seems to be some good news if you're looking for a very short term bullish trade. We will have to understand supply/demand levels on multiple time frames.
In a daily TF, Price opened gap down, approached a daily/weekly demand zone and closed within top 33.3% of a candle range(Bullish Pin bar candlestick). Bullish pin bar with a good volume suggests the presence of demand. There's a gap to be filled. So our first target is a
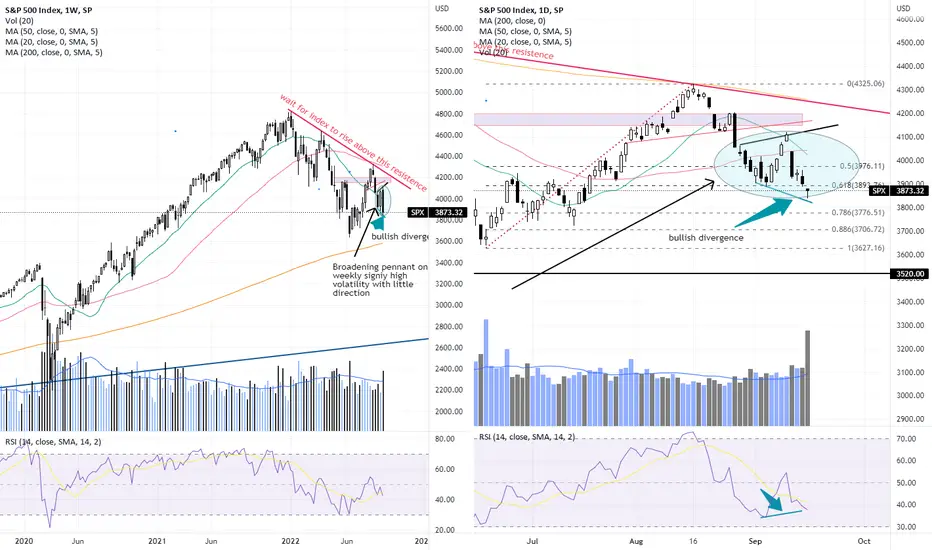
SPX - bullish divergence (short term bounce next? )SPX closed with a small pin bar on huge volume last Friday, coupled with a potential bullish divergence between price and RSI (daily chart), it Looks like we can expect yet another bounce soon. However, divergence usually result in a short term reversal (lasting 2 or several candles) and may not translate into a longer term trend reversal.
The last 3 weekly candles of SPX has formed a broadening "pennant", a pattern that signify a market that has been highly volatile with little to show in dire
SPX and NQ - short term bounce comingAfter retracing 61.8% of the recent AB up swing (that lasted 2 months from 17 June to 16 Aug), the market finally seem to be finding support yesterday, forming a bullish pin bar and a potential bullish divergence between price and stochastics.
However note that a bullish divergence usually signify a SHORT TERM trend reversal (lasting only several candles) and may not translate into a longer term trend reversal.
There is a chance we could be in a whipsaw market for a while more. Need to be nimb