Pivot Points
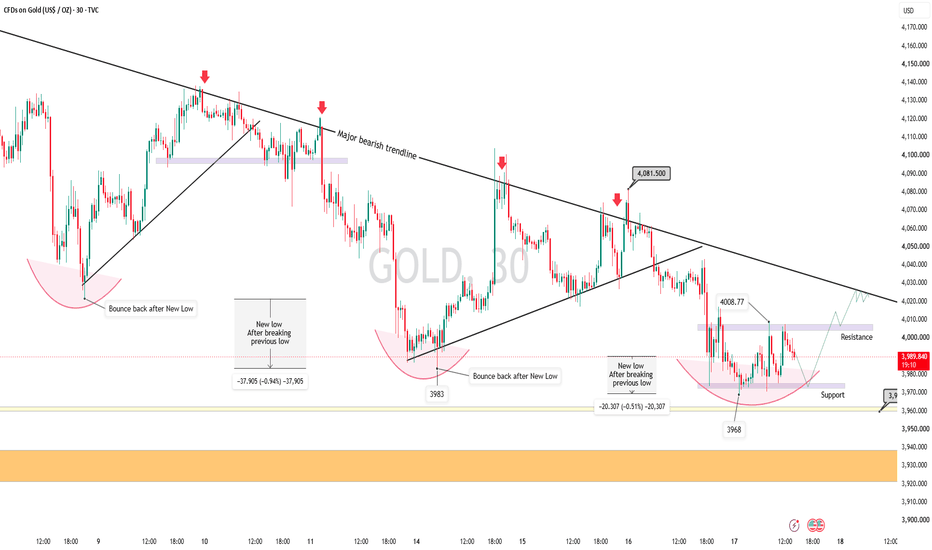
Gold(XAUUSD) outlook and trade setup for the day.Yesterday we saw a decline of around 2%, following to which price broke below important support of 3983, now its consolidating in a sideways range of 4008 - 3968.
structurally its evident that after making fresh low price has shown its tendency to revert back to it's major bearish trendline, hence an up-move could be expected for the retest of major bearish trendline, only if price breaks the level of 4008.77.
The downtrend seems to be exhausting as each time it breaches below previous swings lows, its showing comparatively smaller moves. May be the breakout of the trend is near.
For Educational Purposes only, Not an Investment Advice, Always use strict Risk management measures.
Regards CrazyTrades247.
XAUUSD — FVG Filled, Retest Next?Gold has made a strong recovery from the lower liquidity area.
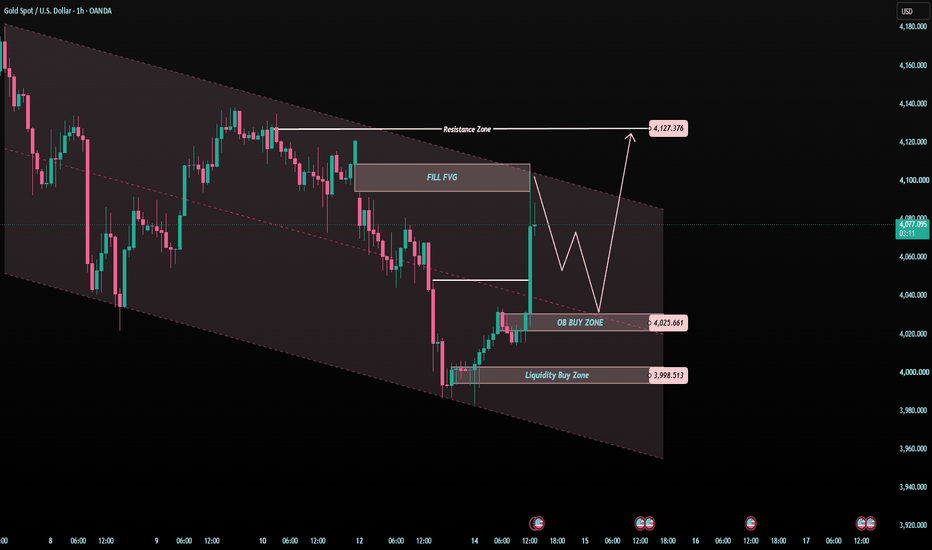
After reacting from the 3,998 zone, price pushed higher and is now trading around 4,080 - 4,085.
But this is where traders need to slow down.
Because gold has already filled part of the FVG area.
And the market is still moving inside a larger descending channel.
So the question is not:
“Should I buy after the pump?”
The better question is:
“Will gold hold the retest, or reject from this FVG?”
The simple read
Gold is recovering, but the bigger structure is not fully bullish yet.
Price is now testing the FVG / reaction area above 4,080.
The next resistance is 4,127.
If gold breaks and holds above the FVG area, buyers may try to push price toward 4,127.
But if gold rejects from this area, a pullback toward 4,025 may appear first.
That 4,025 zone is important because it is the OB buy zone on the chart.
Below that, 3,998 remains the liquidity buy zone.
Key price zones
Current price area: 4,080 - 4,085
FVG reaction area: 4,095 - 4,110
Main resistance: 4,127
OB buy zone: 4,025
Liquidity buy zone: 3,998
Bullish recovery improves above: 4,127
Trading plan
📈 Bullish continuation scenario
If gold holds above the FVG area and keeps strength:
Buyers may try to continue toward 4,127.
A clean upside view becomes stronger only if price breaks and holds above 4,127.
Without confirmation, I do not want to chase the current candle.
📉 Retest scenario
If gold rejects from 4,095 - 4,110:
Price may pull back toward 4,025.
This would not automatically destroy the recovery.
It may simply be the market retesting the OB buy zone before the next decision.
A clear reaction from 4,025 could support another recovery attempt.
📉 Deeper support scenario
If 4,025 fails clearly:
Gold may revisit the 3,998 liquidity buy zone.
If buyers defend 3,998, the market can still create a reaction.
If 3,998 breaks, the descending channel remains in control and the chart needs more time.
Tiara’s View
A strong candle can look exciting.
But the clean trade is usually not after the move.
It is at the retest.
For today, I am watching two things:
Can gold hold the FVG and continue toward 4,127?
Or will price pull back first into 4,025?
Main view:
Gold is recovering, but still inside the descending channel.
4,127 is the resistance target.
4,025 is the key retest zone.
3,998 is the deeper liquidity support.
Reaction first.
Confirmation second.
Trade last.
No confirmation = no trade.
Do you think gold will continue toward 4,127, or retest 4,025 first?
XAUUSD — Recovery First, Bearish Rejection Later
Fundamental Analysis
Gold remains sensitive to USD momentum, Treasury yields, and upcoming U.S. macro data. For next week, price may create a technical recovery first, but the larger structure still shows bearish pressure while gold stays below the main descending trendline.
Technical Analysis
On the 12H chart, XAUUSD is trading around 4,120 after holding above short-term support. The first upside area to watch is 4,204, which acts as strong resistance. If price continues higher, the major sell zone is around 4,300 - 4,310, where Fibonacci resistance, previous structure, and the descending trendline align. A rejection from this area could send gold back toward 3,942, then the deeper Fibonacci target near 3,754.
Important Key Levels
Current price: 4,120
Short-term resistance: 4,204
Main sell zone: 4,300 - 4,310
Strong support: 3,942
Main Fibonacci target: 3,754 - 3,751
Invalidation: above 4,310
Trading Scenario
Main Sell Setup
Entry: 4,300 - 4,310
Stop Loss: 4,360
Take Profit 1: 4,204
Take Profit 2: 3,942
Take Profit 3: 3,754 - 3,751
Sell Condition
Wait for gold to recover toward the 4,300 - 4,310 Fibonacci sell zone. A valid sell setup needs bearish rejection from this area, such as a long upper wick, failed breakout, or bearish candle close below the zone. If price rejects and breaks back below 4,204, the bearish continuation view becomes stronger. If price breaks and holds above 4,310, the sell setup is invalid.
Overall View
The main plan for next week is not to sell too early at the current price. Gold may rise first toward 4,204 or even 4,300 - 4,310 before sellers return. As long as price stays below the descending trendline and rejects the Fibonacci sell zone, the larger downside target remains 3,942 and 3,754.
Do you share the same view that gold may recover first before the next bearish move?
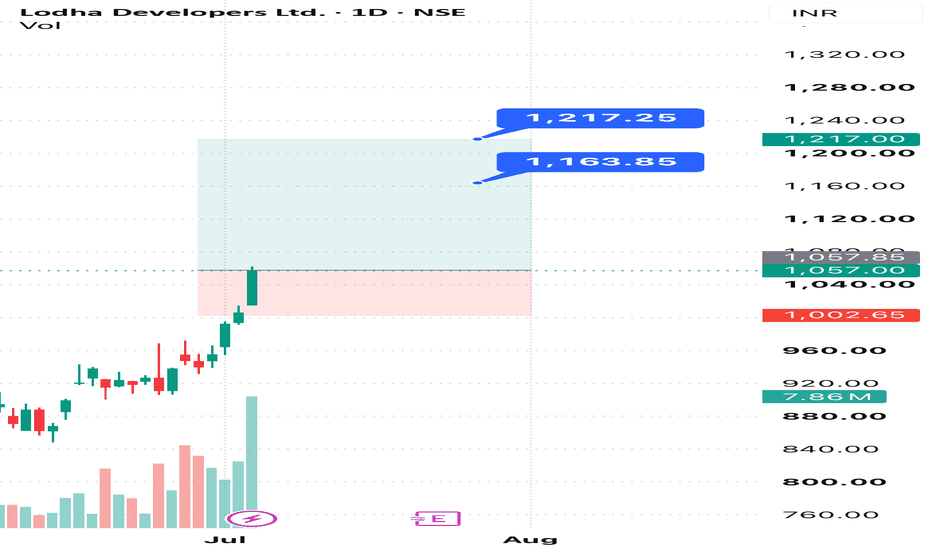
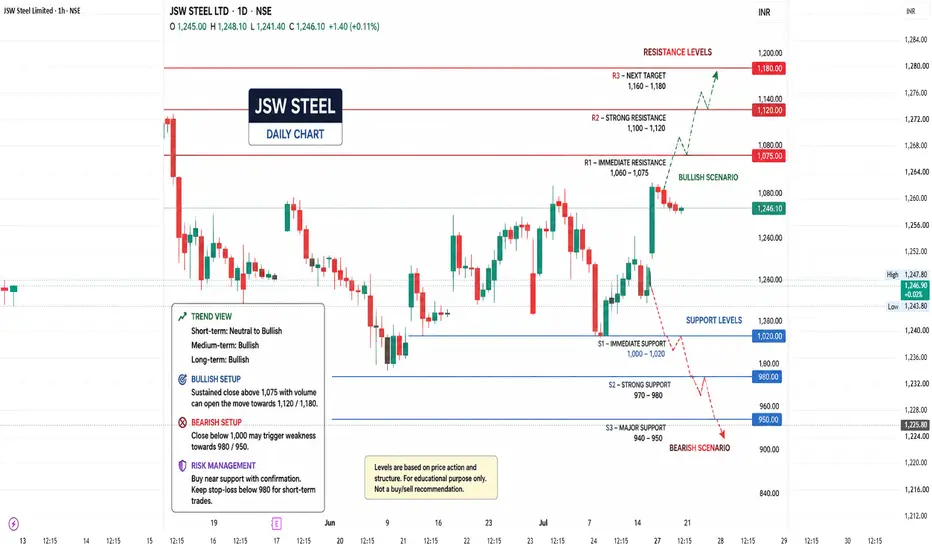
JSW SteelKey Support Levels
₹1,000–1,020 – Immediate support
₹970–980 – Strong demand zone
₹940–950 – Major positional support
Key Resistance Levels
₹1,060–1,075 – Immediate resistance
₹1,100–1,120 – Strong breakout zone
₹1,160–1,180 – Next positional target if momentum continues
Bullish Scenario
Sustained trading above ₹1,075 with strong volume can indicate renewed buying momentum.
Potential upside targets:
₹1,120
₹1,160
₹1,200 (if broader market sentiment remains supportive)
Bearish Scenario
A close below ₹1,000 may trigger short-term weakness.
Downside support levels:
₹980
₹950
₹920 if selling pressure intensifies
Trading Plan
Buy on dips near strong support only after bullish price action confirmation.
Momentum buy only after a convincing breakout above ₹1,075 with above-average volume.
Maintain a stop-loss below the nearest support zone based on your trading timeframe.
Trend View
Short-term: Neutral to Bullish
Medium-term: Bullish
Long-term: Bullish, provided the stock holds above the major support zone around ₹940–950.
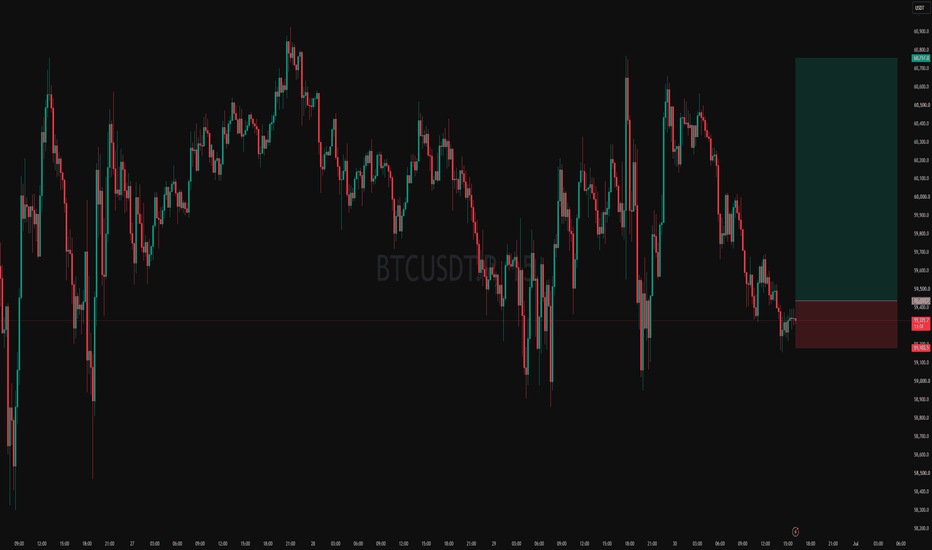
Intraday Long Setup | June 30th 2026 | Valid Until Daily ClosePrice has retraced to a strong pivot zone.
Structure remains bearish but with potential for reversal after pullback.
Tight risk control.
Watch for price reaction within the red zone. Entry only if confirmation appears
The setup expires at end of the daily candle close.
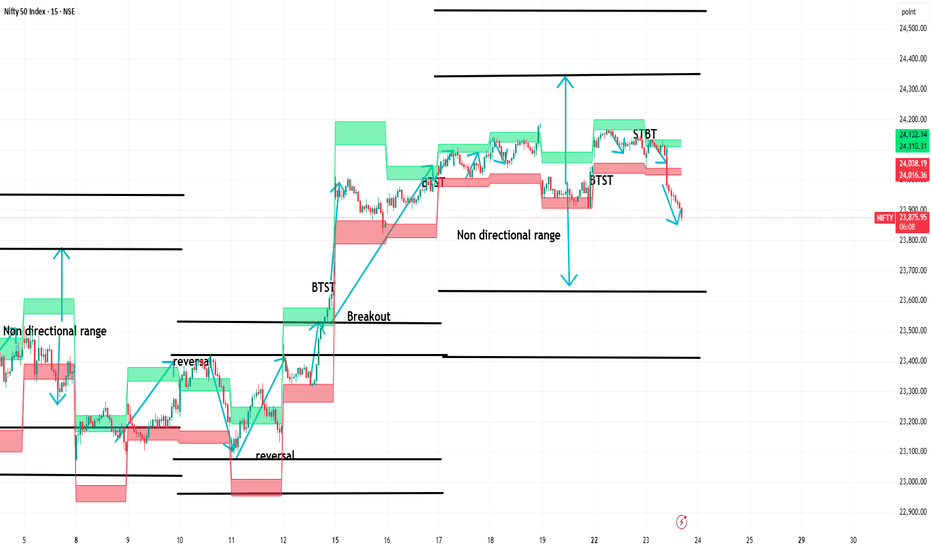
HOW-TO: Large Capital Used Multi-Strategy Baskets in algotradingThis tutorial explains how high-capital traders use multi-strategy baskets combining Intraday S/R levels, Weekly Expiry Range, and BTST/STBT momentum signals. Learn to execute multiple strategies simultaneously with defined risk.
Markets: Nifty, BankNifty
Timeframe: 15-minute
Part 1: The Three-Tool Setup
From the chart:
Tool 1: Intraday S/R Indicator — Identifies entry/exit zones for each strategy
Tool 2: Weekly Expiry Range — Defines weekly boundaries for options selling
Tool 3: BTST/STBT Scanner — Overnight momentum signals for positioning
Current Setup:
Current Price: 23,905
Intraday Support 1: 23,800
Intraday Resistance 1: 24,000
Weekly Range: 23,500-24,200
Part 2: Strategy Mapping
Strategy 1: Breakout Trade
Entry: Above 24,000 (Intraday R1)
Stop-Loss: 23,900 (below resistance)
Trigger: BTST/STBT scanner shows bullish momentum
Basket: BUY Nifty at market
Strategy 2: Reversal Trade
Entry: At 23,800 (Intraday S1) with bullish candle
Stop-Loss: 23,700
Trigger: Price rejects support
Basket: BUY Nifty with defined stop-loss
Strategy 3: Non-Directional (Option Selling)
Entry: Sell Call above 24,200 (Weekly Upper)
Entry: Sell Put below 23,500 (Weekly Lower)
Trigger: Scanner shows range-bound condition
Basket: SELL Call + SELL Put together
Part 3: How BTST/STBT Scanner Enhances Execution
BTST/STBT Scanner identifies momentum signals during final 30 minutes (3:00-3:29 PM IST).
Integration with Baskets:
Bullish BTST signal → Activate breakout/reversal baskets
Bearish STBT signal → Activate short baskets
No scanner signal → Hold, wait
Part 4: How Weekly Expiry Range Defines Boundaries
Weekly Expiry Range provides structural boundaries:
Upper Line 2: 24,200 (Stop-loss zone for call selling)
Upper Line 1: 24,000 (Breakout trigger)
Lower Line 1: 23,800 (Reversal trigger)
Lower Line 2: 23,500 (Stop-loss zone for put selling)
Part 5: Complete Decision Rules
Range-Bound (Between 23,800-24,000):
Strategy: Option Selling (Non-Directional)
Basket: Sell Call + Sell Put
Exit: If price breaches Weekly Upper/Lower
Breakout (Above 24,000):
Strategy: Breakout Trade (Directional)
Basket: BUY Nifty
Exit: If price closes below 23,900
Reversal (At 23,800 with bullish candle):
Strategy: Reversal Trade
Basket: BUY Nifty
Exit: If price breaks below 23,700
Part 6: Why This Works for Large Capital
Factor Why It Matters
Multiple confirmation S/R + Scanner + Weekly range = high probability
Defined risk Each basket has clear SL
Scalable Works with multiple lots
Automated Webhook bridge executes baskets
For Automation
Set webhook alerts for each condition:
Alert 1: Price above 24,000 → Breakout basket
Alert 2: Price touches 23,800 with bullish candle → Reversal basket
Alert 3: Price between 23,800-24,000 → Option selling basket
Alert 4: BTST/STBT scanner signal → Confirm momentum
Disclaimer
This is for educational purposes only. Trading involves risk. Past performance does not guarantee future results.
HOW-TO: Identify Reversals, Breakouts & Sideways in Nifty Index This tutorial explains a practical approach to identifying three key market conditions — reversals, breakouts, and sideways/range-bound markets — using auto-generated support/resistance levels. Based on a real Nifty 15-minute chart.
Markets: Nifty 50
Timeframe: 15-minute intraday
Part 1: Current Market Setup
From the chart:
Resistance Zone: ~24,200 (marked as "Reversal" on chart)
Middle/Range Zone: 24,000-24,100 (marked as "Sideways/Range" on chart)
Support Zone: ~23,800 (marked as "Reversal" on chart)
Current Market Condition: Sideways/Range between 23,800 and 24,200
Key Insight: When price is between support and resistance with no clear direction, it's a sideways/range-bound market. The best action is to wait for breakout or breakdown.
Part 2: Identifying Sideways Market
Sideways defined: Price is trading between a defined Support level (~23,800) and Resistance level (~24,200), with no clear direction.
How to Identify:
Price repeatedly bounces between same support and resistance levels
Price oscillates around VWAP
EMAs are flat, not sloping
Volume is average or declining
Best Action: No trade. Wait for breakout or breakdown.
Active Strategy (For Experienced Traders):
Buy near support with bullish candle confirmation
Sell near resistance with bearish candle confirmation
Stop-loss just beyond the level
Part 3: Identifying Reversal
Reversal defined: Price reaches a support/resistance extreme and changes direction.
From the chart:
At ~24,200 (Resistance) → Bearish Reversal → Price rejected from resistance
At ~23,800 (Support) → Bullish Reversal → Price bounced from support
Reversal Confirmation Checklist:
Price touches support or resistance
Rejection candle confirms (pin bar, engulfing, hammer/shooting star)
Volume spike on reversal candle
Decision Rules:
If price rejects resistance with bearish candle → Consider SELL
If price rejects support with bullish candle → Consider BUY
If price breaks level without resistance → Fakeout/Sweep
Part 4: Identifying Breakout
Breakout defined: Price closes beyond a key support or resistance level with momentum confirmation.
From the chart:
Bullish Breakout: Above 24,200 (Resistance) → Close above + volume confirmation
Bearish Breakdown: Below 23,800 (Support) → Close below + volume confirmation
Breakout Confirmation Checklist:
Price closes above resistance (bullish) or below support (bearish)
Volume above 2x average
Momentum confirmed (MACD/RSI alignment)
Decision Rules:
If price breaks level with volume and momentum → Trade the breakout
If price breaks level without volume → Wait for retest
If price breaks and immediately reverses → Fakeout
Part 5: Complete Decision Rules
Price between 23,800-24,200 → Sideways/Range → Wait or range trade
Price closes above 24,200 → Resistance Breakout → BUY with volume confirmation
Price closes below 23,800 → Support Breakdown → SELL with volume confirmation
Price rejects 24,200 with bearish candle → Resistance Rejection → SELL
Price rejects 23,800 with bullish candle → Support Rejection → BUY
Price breaks 24,200, quickly reverses → Fakeout → Wait for retest
Price breaks 23,800, quickly reverses → Fakeout → Wait for retest
Part 6: Why This Works
Levels define boundaries → Support/resistance give you clear zones
Volume confirms → Differentiates genuine breakouts from fakeouts
Rejection confirms → Shows institutional activity at extremes
Sideways defined → Avoids overtrading in chop
For Automation
These reversal/breakout conditions can be set as TradingView alerts with webhook configuration.
Alert Conditions:
Price closes above 24,200 → Breakout alert
Price closes below 23,800 → Breakdown alert
Price rejects 24,200 with bearish candle → Reversal alert
Price rejects 23,800 with bullish candle → Reversal alert
Disclaimer
This is for educational purposes only. Trading involves risk. Past performance does not guarantee future results.
Gold Is Getting Squeezed Before the Next MoveGold is moving inside a tight triangle, and this is the moment where patience matters more than prediction.
THE SIMPLE READ
Gold is not giving a clean direction yet.
Price is being pressed down by the upper trendline, while buyers are still trying to protect the lower trendline. This means the market is slowly getting squeezed.
When gold moves like this, many traders try to guess the breakout too early.
But the cleaner plan is simple: wait for one side to break clearly, then watch how price reacts at the next important zone.
WHAT I SEE
The first area I’m watching is 4,323.
This zone matters because it sits near the lower trendline and is marked as the breakdown area. If gold breaks below this level and cannot recover quickly, the short-term structure may become weaker.
The next area below is 4,285.
This is the first OB Buy Scalping zone. It matters because if price drops here, buyers may try to create a reaction. This does not mean we buy blindly — it only means this is the first place to watch for buyer response.
The deeper support is around 4,212.
This zone is more important because it sits inside the broader rising channel and is marked as a stronger Order Buy area. If gold reaches this level, it may become a larger reaction zone for buyers.
Above the market, the trendline resistance around 4,345 - 4,351 is still important.
As long as gold stays below this area, buyers have not fully taken control yet.
THE PLAN
📈 IF gold holds above 4,323 and breaks back above the upper trendline:
→ Buyers may try to recover again
→ Price can retest the 4,345 - 4,351 resistance area
→ Possible entry idea: after bullish confirmation above the trendline
→ Invalidation: below 4,323
→ Target 1: 4,351
→ Target 2: 4,370
📉 IF gold breaks below 4,323 and fails to reclaim it:
→ The triangle structure becomes weaker
→ Price may move lower toward 4,285 first
→ If 4,285 fails to hold, the deeper support near 4,212 becomes the next area to watch
→ Possible entry idea: after confirmation below 4,323
→ Invalidation: back above the broken trendline
→ Target 1: 4,285
→ Target 2: 4,212
⏳ No confirmation = no trade.
💡 Tiara’s Tip:
When price is squeezed between two trendlines, the first move can often be emotional.
For beginners, do not ask:
“Should I buy or sell right now?”
Ask instead:
“Which level did price confirm first?”
If gold breaks support and holds below it, sellers may gain control.
If gold breaks resistance and holds above it, buyers may return.
That simple mindset helps you trade the reaction, not the fear.
YOUR TURN
💬 What’s your view today — will gold break below 4,323 first, or will buyers defend the trendline again?
Drop a 🟢 for buyer defense or 🔴 for breakdown below 👇
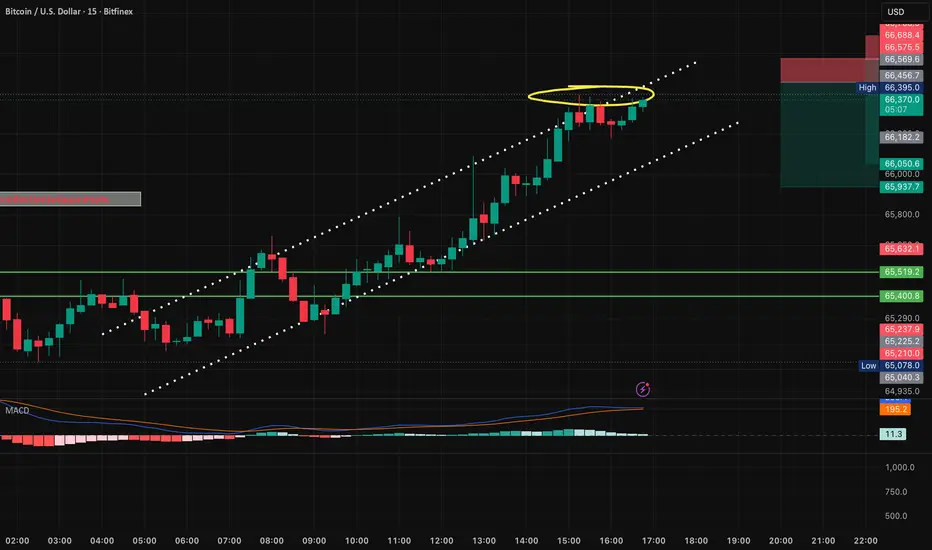
Intraday Long Setup | June 17th 2026 | Valid Until Daily ClosePrice has retraced to a strong pivot zone.
Structure remains bullish with potential for continuation after pullback.
Tight risk control.
Watch for price reaction within the red zone. Entry only if confirmation appears
The setup expires at end of the daily candle close.
HOW-TO: Range-Based Option Selling Strategy Using DTE LevelsThis tutorial explains how to sell options profitably when the market is trading in a range. Using DTE Range levels (2 lines above Base, 2 lines below Base), you can identify optimal strike selection, entry timing, and risk management rules for option selling.
Markets: Nifty, BankNifty, and any liquid instrument with weekly/monthly expiry
Timeframe: 5-minute, 15-minute, or 1-hour charts
Part 1: Understanding the Range-Based Setup
Markets spend most of their time in ranges and only a fraction of time trending. When markets remain range-bound, directional trading becomes inconsistent—one day it goes up, the next day it completely reverses direction.
The solution is simple: Deploy strategies that profit when the market stays within a range. Option selling in range-bound markets is one of the most effective approaches.
Signs of a Range-Bound Market:
Price Action: Highs and lows from recent weeks not broken and sustained
Open Interest: Nifty Calls and Puts OI is almost equal
India VIX: VIX has dropped in recent weeks
Premium Decay: Options premiums decaying daily
Intraday Reversals: Frequent reversals without clear direction
Key Insight: Falling VIX means theta decay accelerates. ATM options lose value faster. Time works in your favor.
Part 2: DTE Range Levels - The Foundation
DTE Range levels are calculated automatically based on historical range analysis and reference price at specified time.
The Output:
Upper Line 2 - Outer Resistance (Breakout level)
Upper Line 1 - Inner Resistance (Reversal level)
BASE - Pivot / Reference Price
Lower Line 1 - Inner Support (Reversal level)
Lower Line 2 - Outer Support (Breakdown level)
When Price is Between Lower Line 1 and Upper Line 1:
This is the sweet spot for option selling. The market is inside the inner range, and historical observation shows it tends to stay there approximately 85-90% of the time in similar conditions.
Part 3: The Option Selling Strategy
Core Logic
When the market is between Lower Line 1 and Upper Line 1:
Setup Steps:
Step 1: Identify Base and Line 1 levels from chart
Step 2: Sell Call at next strike ABOVE Upper Line 1
Step 3: Sell Put at next strike BELOW Lower Line 1
Step 4: Collect credit (premium)
Step 5: Hold until expiry or 50-70% profit target
Risk Management:
Close both legs if price breaches Line 2 (outer)
Position size: 1-2% of capital per trade
Take 50-70% profit - don't wait for 100%
Why This Works:
Theta Decay: Time value erodes fastest when market is range-bound
Volatility Crush: Falling VIX accelerates premium decay
High Probability: Market staying inside Line 1 range is historically high
Part 4: The Complete Decision Matrix
When market is between Lower Line 1 and Upper Line 1:
Trade Type: Option Selling
Entry: Sell Call at U1+1, Sell Put at L1-1
Stop Loss: Close if Line 2 breached
Target: Premium decay (50-70%)
When price touches Lower Line 1:
Trade Type: Reversal BUY
Entry: At L1 with bullish candle
Stop Loss: Lower Line 2
Target: Base
When price touches Upper Line 1:
Trade Type: Reversal SELL
Entry: At U1 with bearish candle
Stop Loss: Upper Line 2
Target: Base
When price closes above Upper Line 2:
Trade Type: Breakout BUY
Entry: Above U2
Stop Loss: Upper Line 1
Target: Measured move
When price closes below Lower Line 2:
Trade Type: Breakout SELL
Entry: Below L2
Stop Loss: Lower Line 1
Target: Measured move
Part 5: Technical Factors That Matter
1. Volatility Regime
A key factor in options selling is market volatility. The 20-Day Range percentage measures price movement over the last 20 trading days.
Quiet Zone - Range below 18%
Ideal for strangles (sell OTM Call + OTM Put)
No Man's Land - Range between 18-30%
Too volatile for strangles, not extreme enough for premium selling
Extreme Zone - Range above 30%
Premium is massive; volatility crush does the heavy lifting
Insight: When the 20-Day Range is low and flat (below 18%), conditions strongly favor short strangles. This aligns perfectly with your DTE Range strategy.
2. Strike Selection Using DTE Levels
Your DTE Range indicator automatically identifies optimal strike levels:
Upper Line 1: Sell Call at next strike ABOVE this level
Lower Line 1: Sell Put at next strike BELOW this level
Why this works: These levels represent natural support and resistance zones. Selling just beyond them puts your strikes outside the expected range.
3. Timing - When to Enter
Market between L1 and U1 → Ready for entry
Falling VIX → Accelerates premium decay
No major news events → Avoid event risk
1-2 days to expiry → Maximum theta decay
Real Example from the Market: When Nifty traded between 23,300 and 24,000 with India VIX declining, option writers benefited as premiums bled away daily.
4. Risk Parameters
Position Size: 1-2% of capital per trade
Stop Loss: Close if price breaches Line 2 (outer)
Profit Taking: 50-70% of credit
Event Risk: No trades 30 min before/after news
Volatility: Smaller positions when VIX is high
Part 6: Market Conditions - When to Sell, When to Avoid
Best Conditions for Option Selling:
Price between L1 and U1 → High probability of staying inside range
Falling VIX → Theta decay accelerates
Low volatility regime (below 18% range) → Ideal for strangles
Expiry week → Levels act as magnets
No major events → Reduced tail risk
When to Avoid Option Selling:
Price at Line 2 (outer) → Wait for price to come inside Line 1
Rising VIX → Consider reversal or breakout trades
High volatility regime (above 30% range) → Extreme moves increase risk
Event days (budget, RBI, FOMC) → Reduce size or wait
Strong trending market → Use reversal or breakout strategies
Part 8: Common Mistakes to Avoid
Selling options when price is at Line 2 → Only sell when inside Line 1
Holding for 100% profit → Take 50-70% and move on
Ignoring VIX/volatility regime → Check regime before entering
Moving stop loss wider → Respect the next level
No position sizing → Max 1-2% risk per trade
Part 9: Why Range-Based Option Selling Works
Theta Decay: Time value erodes fastest in last days
Volatility Crush: Falling VIX reduces premium
High Probability: Market stays inside L1-U1 historically 85-90% of time
Defined Risk: Stop at Line 2 limits loss
No Prediction Needed: Only need market to stay in range, not move directionally
Gold Is At A Critical Decision PointGold remains trapped inside a tight $4300–$4355 range, but this kind of compression rarely lasts for long.
📊 Current Market Structure
The trend remains cautiously bullish, but price is struggling beneath a major resistance zone around $4355–$4365.
🔑 Key Levels To Watch
🔴 Resistance: $4355
A breakout above this level could open the door toward fresh highs.
🟢 Support: $4300
If price loses this level during the US session, a liquidity sweep toward lower demand zones becomes increasingly likely.
📍 Buy Zones
• $4220–$4240 (Liquidity Zone)
• $4165–$4180 (Major Demand Area)
⚠️ What Happens Next?
A break below the range could be nothing more than a liquidity grab before buyers step back in. The reaction around support will reveal whether Gold is preparing for another leg higher or a deeper correction.
Gold is approaching a decision point. The next breakout could set the tone for the rest of the week.
Are you expecting a breakout above $4355 or a sweep below $4300 first?
HOW-TO: 1& 0DTE Range Trading System(Non-Directional+DirectionalThis educational tutorial explains a complete trading system using DTE Range levels (2 lines above Base, 2 lines below Base) for Non-Directional Trading with option selling, Directional Reversal trades from inner lines, and Directional Breakout trades beyond outer lines.
Markets: Nifty, BankNifty, and any liquid instrument with weekly or monthly expiry.
Timeframe: Best on 5-minute, 15-minute, or 1-hour charts.
Part 1: Understanding DTE Range Levels
DTE Range levels are calculated automatically based on historical range analysis and reference price at specified time.
The Output:
Upper Line 2 - Outer Resistance (Breakout level)
Upper Line 1 - Inner Resistance (Reversal level)
BASE - Pivot / Reference Price
Lower Line 1 - Inner Support (Reversal level)
Lower Line 2 - Outer Support (Breakdown level)
Key Insight: These levels are derived from actual market range behavior, adapting to current volatility.
Part 2: Premium Decay - The Technical Logic
What happens in the last 24 hours to expiry:
Force 1 - Time Value Exhaustion (Theta): With one day remaining, time value decays at its fastest rate. Approximately 60-70% of remaining time value typically erodes in the final trading day.
Force 2 - Volatility Smash (Vega Collapse): OTM implied volatility historically decreases significantly in the last 24 hours as demand for protection reduces.
Force 3 - Probability Concentration: Historical observation shows markets tend to stay within inner lines approximately 85-90% of the time in similar conditions during the final trading day.
Note: These are historical observations only, not guarantees of future performance.
Part 3: The Three Trading Strategies
Strategy 1: Non-Directional (Option Selling)
When: Market is between Lower Line 1 and Upper Line 1
Setup Steps:
Identify Base and Line 1 levels from chart
Sell Call at next strike ABOVE Upper Line 1
Sell Put at next strike BELOW Lower Line 1
Collect credit
Hold until expiry or 50-70% profit target
Risk Management: Close both legs if price breaches Line 2 (outer). Position size: 1-2% of capital per trade.
Best for: Range-bound markets, low volatility environment.
Strategy 2: Directional - Reversal (Mean Reversion)
When: Price touches Upper Line 1 or Lower Line 1 with candlestick confirmation
Reversal from Lower Line 1 (BUY):
Entry: At Lower Line 1 plus bullish candle (hammer, engulfing, or pin bar)
Stop Loss: Lower Line 2
Target: Base (conservative) or Upper Line 1 (aggressive)
Reversal from Upper Line 1 (SELL):
Entry: At Upper Line 1 plus bearish candle (shooting star, engulfing, or pin bar)
Stop Loss: Upper Line 2
Target: Base or Lower Line 1
Best for: Trending markets that respect levels, mean reversion strategies.
Strategy 3: Directional - Breakout (Trend Following)
When: Price closes beyond Upper Line 2 or below Lower Line 2
Bullish Breakout:
Entry: On candle close above Upper Line 2
Stop Loss: Upper Line 1
Target: Measured move (distance from Base to Line 2 projected upward)
Bearish Breakdown:
Entry: On candle close below Lower Line 2
Stop Loss: Lower Line 1
Target: Measured move projected downward
Best for: High volatility, news-driven markets, trend days.
Part 4: Complete Decision Matrix
Market Position: Between Lower Line 1 and Upper Line 1
Trade Type: Non-Directional
Entry: Sell Call at U1+1 and Sell Put at L1-1
Stop Loss: Close if Line 2 breached
Target: Premium decay
Market Position: Touches Lower Line 1
Trade Type: Reversal BUY
Entry: At L1 with bullish candle
Stop Loss: Lower Line 2
Target: Base
Market Position: Touches Upper Line 1
Trade Type: Reversal SELL
Entry: At U1 with bearish candle
Stop Loss: Upper Line 2
Target: Base
Market Position: Closes above Upper Line 2
Trade Type: Breakout BUY
Entry: Above U2
Stop Loss: Upper Line 1
Target: Measured move
Market Position: Closes below Lower Line 2
Trade Type: Breakout SELL
Entry: Below L2
Stop Loss: Lower Line 1
Target: Measured move
Part 5: Market Structure Mapping
How levels behave in different market conditions:
Low volatility / Range-bound: Levels tend to hold. Preferred strategy is Non-Directional.
Medium volatility / Trending: Levels act as pauses. Preferred strategy is Reversal from Line 1.
High volatility / Breakout: Levels may get breached. Preferred strategy is Breakout from Line 2.
Expiry week: Levels often act as magnets. Preferred strategies are Non-Directional and Reversal.
Event day (budget, RBI, FOMC): Levels may fail. Recommended to reduce size or wait.
Level interactions:
Bounce from Line 1 means level is respected. Action: Enter reversal.
Line 1 becomes support/resistance after breakout means level has flipped. Action: Trade in new direction.
Multiple touches at Line 1 without breach means level is strengthening. Action: Consider aggressive reversal.
Candle close beyond Line 2 suggests potential true breakout. Action: Consider breakout trade.
Part 6: Practical Application
To apply this system to your chart:
Look at the DTE levels displayed on your chart
Note the Base value
Note Upper Line 1 and Upper Line 2
Note Lower Line 1 and Lower Line 2
Identify where current price is trading relative to these levels
Use the decision matrix above to determine appropriate strategy
From the attached chart:
If current price is between L1 and U1, consider option selling.
If price touches L1 with bullish candle, consider reversal BUY.
If price touches U1 with bearish candle, consider reversal SELL.
If price is above U2, consider breakout BUY.
If price is below L2, consider breakout SELL.
Part 7: Risk Management Rules
Rule 1: Never risk more than 2% per trade for capital preservation.
Rule 2: Stop loss always at next level to remove subjectivity.
Rule 3: Take 50-70% profit on option selling to capture core decay.
Rule 4: No trades 30 minutes before or after major news to avoid volatility spikes.
Rule 5: Scale position size based on volatility - use smaller size in high VIX.
Part 8: Common Mistakes to Avoid
Mistake: Moving stop loss wider.
Correct Approach: Respect the next level.
Mistake: Entering reversal without candle confirmation.
Correct Approach: Wait for candle close beyond level.
Mistake: Selling options when market is at Line 2.
Correct Approach: Only sell when inside Line 1.
Mistake: Holding option selling for 100% profit.
Correct Approach: Take 50-70% and move on.
Mistake: Trading all three strategies simultaneously.
Correct Approach: Pick one based on market condition.
Part 9: Final Notes
This system is based on range probability concepts, not prediction. No strategy works 100% of the time. Consider backtesting before applying to live markets. Start with smaller position sizes. Maintain a trading journal for review.
BANKNIFTY WEEKLY/ POSITIONAL Level Analysis: 15th-19th Jun 2026🔔 SGMN SplW Above BULLISH BIAS => 56881.
🔔 SGMN SplW BELOW Bearish BIAS => 56325.
Mentioned analysis based on 2 consecutive candle close in 15 min Time Frame.
━━━━━🟥🟧🟨🟩🟦🟪⬛━━━━━
💥Level Interpretation / description:
✍🏻L#1: If the candle crossed & stays above the “Buy Gen”, it is treated / considered as Bullish bias. Cfm=> Confirmation.
L#2: Possibility / Probability of REVERSAL near 🔕RL/TF1 & 🔔RL/TF2
L#3: If the candle stays above “Sell Gen” but below “Buy Gen”, it is treated / considered as Sidewise. Aggressive Traders can take Long position near “Sell Gen” either retesting or crossed from Below & vice-versa i.e. can take Short position near “Buy Gen” either retesting or crossed downward from Above.
L#4: If the candle crossed & stays below the “Sell Gen”, it is treated / considered a Bearish bias.
L#5: Possibility / Probability of REVERSAL near 🔕RL/TF1 & 🔔RL/TF2
HZB (Buy side) & HZS (Sell side) => Hurdle Zone,
✍🏻 *** Specialty of “HZB#1, HZB#2 HZS#1 & HZS#2” is Sidewise (behaviour in Nature)
Rest Plotted and Mentioned on Chart
Color code Used:
Green, BLUE =. Positive bias.
Safron, RED =. Negative bias.
RED in Between Green means Trend Finder / Momentum Change
/ CYCLE Change and Vice Versa.
Notice One thing: HOW LEVELS are Working.
Use any Momentum Indicator / Oscillator or as you "USED to" to Take entry.
━━━━━🟥🟧🟨🟩🟦🟪⬛━━━━━
⚠️ DISCLAIMER:
The information, views, and ideas shared here are purely for educational and informational purposes only. They are not intended as investment advice or a recommendation to buy, sell, or hold any financial instruments. I am not a SEBI-registered financial adviser.
Trading and investing in the stock market involves risk, and you should do your own research and analysis. You are solely responsible for any decisions made based on this research.
"🔔As HARD EARNED MONEY IS YOUR's, So DECISION SHOULD HAVE TO BE YOUR's".
━━━━━🟥🟧🟨🟩🟦🟪⬛━━━━━
❇️ Follow notification about periodical View
💥 Do Comment for Stock WEEKLY Level Analysis.🚀
📊 Do you agree with this view?
✈️ HIT THE PLANE ICON if this technical observation resonates with you. It will Motivate me.
━━━━━🟥🟧🟨🟩🟦🟪⬛━━━━━
💡 If You LOOKING any CHART & want for Level and ANALYZE?
Share your desired stock names in the comments below! I will try to analyze the chart Levels, patterns and share my technical view (so far my Knowledge).
If Viewers think It can identify meaningful setups. Looking forward to hearing from all of you — let's keep this discussion going and help each other make better trading decisions.
___________🔕^^^⚫⚪^🙏🏼🙏🏼🙏🏼^⚪⚫^^^🔔___________
Gold's Next Big Move Is Loading After weeks of heavy selling, gold is no longer in freefall. Instead, price is compressing inside a tight ascending triangle, suggesting a major breakout could be approaching.
📌 Key levels to watch:
🟢 $4171 – Immediate support. Bulls need to defend this level to keep the recovery structure intact.
🟢 $4133 – Important buy reaction zone. A healthy pullback here could attract fresh demand.
🟢 $4081 – Major bullish order block. Losing this level would signal weakening momentum.
🔴 $4245 – First key resistance. A breakout above this level could trigger the next leg higher.
🔴 $4270 – Critical supply zone. Sellers may step in aggressively here.
🎯 $4335 – The level that could confirm a much stronger bullish reversal.
Gold has entered a decision zone.
Will buyers force a breakout above resistance, or is another rejection waiting around the corner?
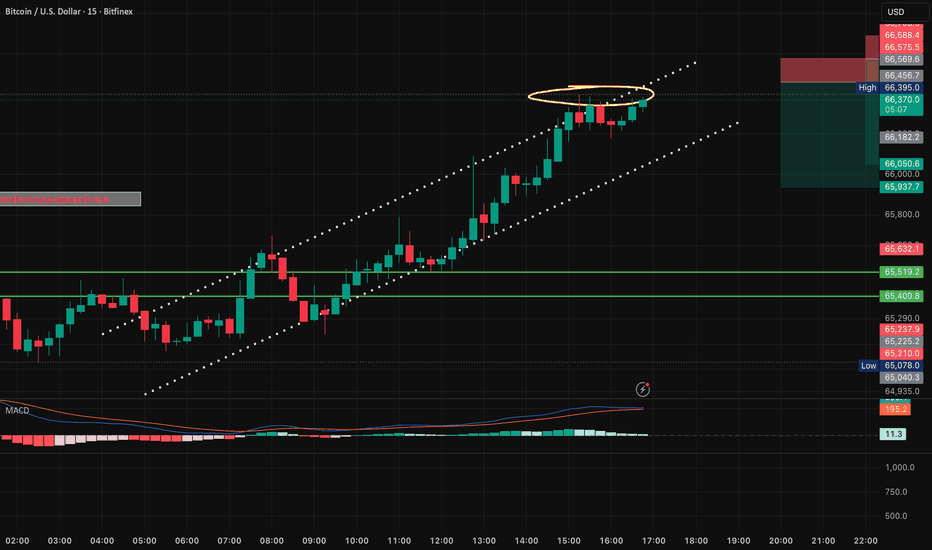
Will Bitcoin Drop to $60K Again?Bitcoin is attempting to recover after sweeping key lows, but growing geopolitical tensions and a stronger U.S. dollar continue to keep pressure on risk assets.
📊 Key Factors Driving The Market:
• Oil prices are surging amid Middle East tensions
• DXY has pushed back above 100
• Treasury yields remain elevated
• BTC is fighting to hold recent gains
🎯 Key Levels To Watch:
• Support: $60,000–$61,000
• Resistance: $64,000+
• Major Bullish Trigger: Sustained strength above recent highs
Despite macro headwinds, Bitcoin managed to close above the 200-week SMA, a level many analysts view as a long-term bullish signal.
⚠️ The big question now: Is this the start of a recovery rally... or just a temporary bounce before another test of $60K?
NTPC: A Look at the Hidden Bullish Setup on the Daily ChartIn my previous post on TCS and its hidden bearish divergence: , we saw bearish signals.
Today, we have a very similar chart setup on NTPC Limited, but this time it has a bullish bias.
Let’s look at the daily chart using simple terms:
The Chart Disagreement
Price Chart: Is making a Higher Low . It is holding a higher floor compared to April.
RSI Indicator: Is making a Lower Low . This shows the internal momentum has completely refreshed and cooled down.
This combination is a classic Hidden Bullish Divergence , suggesting that the broader uptrend may want to continue.
The Risk and Key Levels
Remember, no trade case is completely safe. If the market chooses a different path, here are the exact levels to watch:
The Invalidation Zone: The critical line is kept at 363.05 . This is a major historical pivot point on the chart.
If the Thesis Fails: A clean break below this pivot could lead to a further downward move, possibly dragging the price toward the next support cluster at 352.00 .
It is a clean, textbook level to watch over the next few sessions.
Disclaimer: This post is for educational purposes only and is not investment advice. I am not a SEBI-registered analyst. Please do your own research or check with a professional before trading.
NIFTY50 Weekly Expiry Setup | Key Technical Levels to WatchNIFTY50 Analysis
NIFTY50 continues to trade below a descending trendline, reflecting a weak short-term market structure. Price is currently positioned near the Break Down zone around 23,277, while the Buy Reversal level near 23,405 remains an important reference area on the chart.
The recent price action highlights continued pressure below key intraday levels, with market participants closely monitoring reactions around nearby support and resistance zones.
Key Levels:
• Resistance : 23,405 | 23,570 | 23,659
• Support : 23,277 | 23,129 | 23,066
The current structure remains focused on price behavior around these levels, particularly while NIFTY50 trades below the descending trendline. Any change in momentum may become clearer through how price interacts with these reference zones.
What is your view on the current NIFTY50 structure?
Educational analysis only. Not investment advice.