Breakout soon the stock was consolidating since last few months but now it is at the verge of breakout. it have potential to give a good return soonby Adarsh_Chaurasia2
Nifty Analysis Technical :- #Nifty50 CPR 2 day relationship suggest a bullsh-to-sideways trend for the expiry ahead. Nifty might open around at 26,000 levels. A golden pivot zone at 29,950 area make it a good #support for the day and we can #bearish move only if this breaks. In the #resistance side there's nothing much to see just a minor resistance at 26,050 levels. OI Data :- Open interest data shows a series of short covering on muplites put strikes which signifies a #bullish sentiment between traders. Hby karan_bagri0
Accelya Kale Triangle + RSI breakoutAccelya Kale solutions is a software solutions provider for airline and travel industry which has good fundamentals and stellar OPM, ROE & ROCE with reduction in debtor days and increase in operating cashflow. Technicals: Stock has made RSI breakout in weekly timeframe. Price yet to make move strong. 30-40% potential to rise Cons: Working capital days increased Dividend payout ratio above 70% Stock trading 9 times the book value by naraykln0
BANKNIFTY EXPIRY ANALYSIS#Indicator :- #NiftyBank's #CPR levels shows that there's a Golden Pivot Zone near 54,050 range, which might act as a crucial #resistance for the day. Also the placement of CPR for upcoming day suggests that the index can open under 54,000 and continue to be bearish for the rest of the day. #Chart Pattern :- The index is in the process of forming an "M" pattern. Which can lead the price to more downside till next support of 53,700 zones. OI Data :- The OI data of BANKNIFTY for 25/Sept expby karan_bagri0
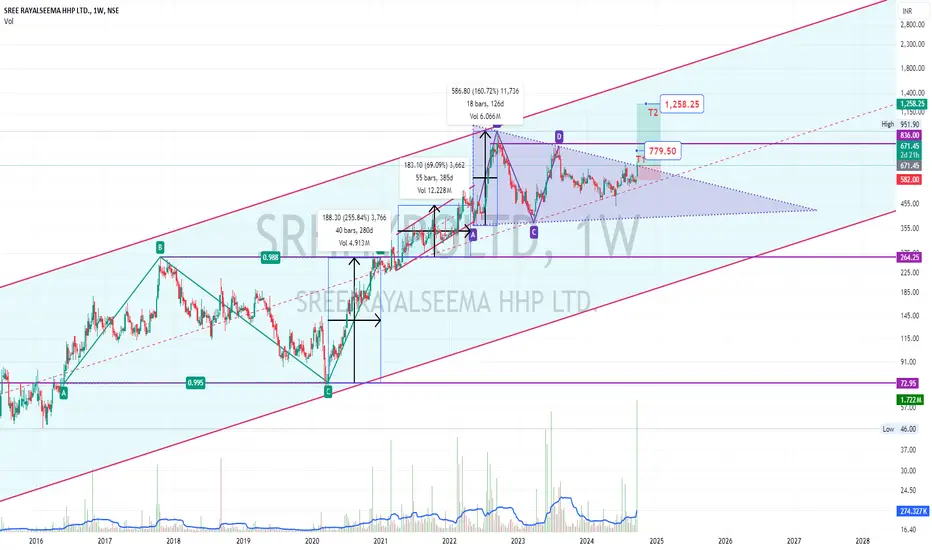
Sree Rayalaseema Hi-Strength Hypo Ltd Ready for TrianglebreakoutSree Rayalaseema Hi-Strength Hypo Ltd witnessing good volume this week. 87% rising potential. Company has reduced debt and debt free. Reasonably good financials. Technicals looking good. Triangle breakout with target as 779.50 and 1258.25Longby naraykln1
Alkyl Amine Daily Chart SetupCMP@2396.25 Chart Structure Looks Bullish Price Volume Breakout Weekly Supertrend Turn Positive Stock Above 30 Period Weekly EMA RSI Bullish RS Bullish ADX Trending Longby rkalunge3
DEVYANI DAILY CHART ANALYSISDEVYANI CMP@196 Chart Pattern Looks Bullish Above All Major Averages Above Monthly CPR RSI Bullish RS Bullish 5X Volume Today Headed Towards 225Longby rkalunge21
Bitcoin Daily Chart SetupBitcoin CMP@57800 Chart Pattern Looks Weak Descending CPR Price Trading Below All Major Averages Heading Towards 49500 Chart Pattern will Negate if Closes Above 60700 Shortby rkalunge21
Devyani International Potential Bullish MomentumFollowing a notable consolidation phase that commenced in January 2024, Devyani International has exhibited promising technical signals, suggesting a potential shift towards a bullish trend. Last week, the stock successfully breached the pivotal resistance level of 185 on the weekly timeframe, which is a critical psychological and technical milestone. The 20 EMA has crossed above the 50 EMA on the weekly chart, a classic indicator of bullish momentum known as a "Golden Cross." This crossover tyLongby NiftyNotion6
Banknifty Weekly Chart AnalysisBanknifty Spot CMP@51938 Weekly Chart Setup Bullish RSI Bullish ADX Neutral Majort Support Stands@50300 Break& Close Below will lead towards 48500 Longby rkalunge0
Nifty 50 Weekly Chart AnalsisNifty Spot Cmp@25356 Weekly Chart Setup Bullish RSI Bullish ADX Neutral Major Support@24700 Break& Close Below will lead Towards 23900Longby rkalunge1
Nifty 50 Weekly Chart AnalsisNifty Spot Cmp@25356 Weekly Chart Setup Bullish RSI Bullish ADX Neutral Major Support@24700 Break& Close Below will lead Towards 23900Longby rkalunge0
AMBER Follow up BO [WEEKLY]AMBER came up recently in my momentum scanner so I looked up some Fundamental numbers as I liked the chart and I wanted to share the same. This looks a like a good scrip to track as it ticks some boxes and gives a good gut feel for fundamental numbers to improve in upcoming quarters. On Relative Strength Scores : 23rd Aug - 50 30th Aug - 63 6th Sep - 65 13th Sep - 69 Certainly the stock has improving RS scores week over week so can be said is in momentum especially post seeing the by HawkishDove0
Nifty Spot Daily Chart AnalysisNifty Spot CMP@24918 Major Support @24800 Monthly Pivot Trend Reversal Level@24500. New Bull Run Only Above Closing@25150. So Be Cautious If Spot Closes Below 24800 Levelsby rkalunge12
Lauras Lab Daily Chart AnalysisCMP@506 Perfect Price Volume Breakout Setup Stock Above 20 Days High Price Above Monthly CPR Above Upper Bollinger BandLongby rkalunge1
Nifty Spot Daily Chart AnalysisNifty Spot Cmp@24852 Two Months pivot Overlapping Suggesting a Strong Support @24500 Break & Close Below 24500 will confirm the Medium Term Downtrend Which will Lead the Nifty Towards Previous Month Low@23893by rkalunge2
JUBINGREA Daily Chart AnalysisChart Pattern Looks Promising CMp@740 Price Volume Breakout Above Monthly CPR RS PositiveLongby rkalunge2
XAUUSD 2560Golden Information Gold prices fell during the North American session as traders returned to their desks following the Labor Day holiday. Data from the United States (US) hinted that business activity contracted, though traders bought the Greenback. The XAU/USD trades at $2,490, down 0.34%. Gold prices fall despite stronger US Dollar amid economic slowdown signs. US ISM Manufacturing PMI remains in contraction; employment sub-component improvement offers market some relief. DespiShortby AngelScalping3
XAUUSD STRONGINTRO Current Status 1.Gold prices fall despite stronger US Dollar amid economic slowdown signs. 2.US ISM Manufacturing PMI remains in contraction; employment sub-component improvement offers market some relief. 3.Despite a drop in 10-year Treasury yields to 3.84%, Gold only briefly recovers after dipping to $2,473. Gold price is upwardly biased, even though momentum shifted in sellers’ favor and opened the door for a drop to $2,470. The Relative Strength Index (RSI) hints that buyers are in cShortby AngelScalping421
Tatachemical Daily Chart AnalysisChart Pattern Looks Good CMP@1108 RSI Bullish Spread Chart Bullish Spike In Delivery Volume Stock Above 30 DEMALongby rkalunge3
A BREAKOUT WITH VOLUME - ARIHANT CAPITAL.NSE:ARIHANTCAP ❇️ Strong breakout on weekly chart. ❇️ Flag and poll pattern in 30mint time frame. ❇️ Stock can achive 108-115 targets in upcoming days. ❇️ Short and log terms targets 140-160-190++. ❇️ Nearby support 88-90. ❇️ Above 95 we can see a real move🔥 👉🏻 @thetradeforecast 🇮🇳Longby thetradeforecast113
Sbicard Daiky Chart AnalysisDaily Chart Pattern Looks promising.CMP@745 RSI Bullish RS Bullish Stock Crosses Preious Month High Chart Pattern @ill Negate if Closes Below 715 Headed Towards 850-880Longby rkalunge4
RUNEUSDT: Could This Bearish Structure Signal a Major Move?Yello, Paradisers! Are you ready to catch the next big move in RUNEUSDT? Let's dive into the details. 💎RUNEUSDT is currently following a bearish market structure, making it an ideal candidate for short opportunities. Recently, we’ve seen the formation of a Head and Shoulders pattern right after RUNEUSDT touched the bearish Order Block (OB) zone. This pattern strengthens the likelihood of a bearish continuation, but we need a breakdown with a candle close below the support zone for confirmation.Shortby MyCryptoParadise_Nathan3
Lalagi In Super trend? Weekly wrap #Nifty50 31st Aug 24First Step of a successful trader is to build a Trade plan & review what he has done. (education purpose for all ) *Trend is UP *Trade plan: Buy on Dip *for Critical levels see the video Jai Hind. Disclaimer : This video is only for educational purposes. Please consult your financial advisor before you take any trade.03:36by Tradeplannifty0


 Long
 Long
 Long
 ShortLongLongLongLong

 Long
 Long
 ShortShort
 Long
 Long
 Long
 Short