PAISALO - consolidation breakout PAISALO formed a base and breakout on 11 July 2024 with volume pulling back to the breakout candle, now forming a pivotal candle for pullback entry. PAISALO in stage 2 in the weekly time frame. now the entry can be attempted above the trigger candle keeping the low of the trigger candle low as a stop-loss for swing trade.
Pivot Points
Bears Taking Over? Trade Plan Nifty 50 22nd July 2024First Step of a successful trader is to build a Trade plan & review what he has done.
This is my Trade Journal . (education purpose for all )
Trend is down
Trade plan: Sell on rise.
for detail levels see the video
Jai Hind.
Disclaimer :
This video is only for educational purposes. Please consult your financial advisor before you take any trade.
Weekly Wrap Nifty 50 20th July 2024First Step of a successful trader is to build a Trade plan & review what he has done.
This is my Trade Journal . (education purpose for all )
Trend is down, Sell on rise
Critical levels & Traadeplan see the video till the end.
Jai Hind.
Disclaimer :
This video is only for educational purposes. Please consult your financial advisor before you take any trade
Silver sold at 94000 , 89300 Target hit ,4700 points profit Avoid carry farward trade for weekend
Disclaimer -
This information is only for educational purposes, this is not for any buy or sell recommendations .
On Our Harmonic pattern indicator
based trade setup take trade as explained below :-
ENTRY -
When price breaks 30% retracement Which is D points then take Entry on Buy or Sell Trade
SL -
SL is (-3%) Which is mentioned in Chart . our SL is just above or below of Recent high or Low .
TARGET -
Target 1- (T1 : 61.8 %)
Target 2-
Sell gifty nifty on rise near 24750 if comes up good fall soonDisclaimer -
This information is only for educational purposes, this is not for any buy or sell recommendations .
On Our Harmonic pattern indicator
based trade setup take trade as explained below :-
ENTRY -
When price breaks 30% retracement Which is D points then take Entry on Buy or Sell Trade
SL -
SL is (-3%) Which is mentioned in Chart . our SL is just above or below of Recent high or Low .
TARGET -
Target 1- (T1 : 61.8 %)
Target 2- (T2 : 88.6 %)
Target 3- (T3 : 127.2 %)
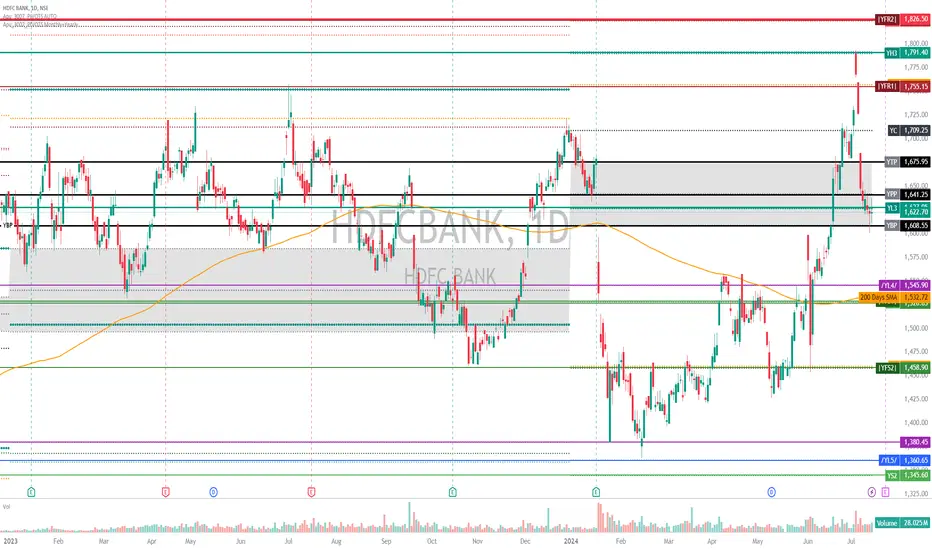
HDFC BANK: Need to hold the range 1600-1675After sharp selling from YH3 1790 , drawdown of -182 i.e -10.25%, NSE:HDFCBANK need to hold the range 1608-1675 and trade above 1675 for buullish momentum to continue.
Failing to hold 1600-1608 can see intermediate support of 1545/1525 downside. If took support from 1545-25 and trade above 1675 ,will be a better confirmation to continue bullish momentum..
With Union Budget to be presented on July 23 2004 ,it may consolidate in between 1608 and 1675.
Also need a positive Q1 result , that
Buying opportunity today According to 4h candlestick chart or Technical indicators price prediction or possibility.
1. Price sustain pivot point with strong volume indicat good support.
2 . Current formed bullish or price above 2% showing good buying Strength.
3.risk reward ratio good.
4. Right time to entry
* my personal view bullish for intraday good opportunity to buy .
BANDUSDT Falling Wedge: Is a Bullish Breakout Imminent?Yello, Paradisers! Have you been tracking BANDUSDT? The market is presenting a prime opportunity that you can't afford to ignore. Let's break it down!
💎BANDUSDT has formed a falling wedge pattern, and the price is currently sitting in the support zone, increasing the probability of a bullish move.
💎If the price shows an I-CHoCH (Internal Change of Character) in the lower timeframes, indicating a shift towards a bullish market structure, the probability of a bullish move will increase.
💎The pr
VETUSDT Descending Channel: Potential Breakout or Breakdown?Yello, Paradisers! Have you been keeping an eye on VETUSDT? The market is at a critical juncture, and you don't want to miss out. Let's dive in!
💎VETUSDT has formed a descending channel and recently bounced from a bullish order block after taking liquidity, increasing the probability of a bullish move.
💎For a confirmed bullish move, we need a breakout of the descending channel and the resistance zone together. This will significantly increase the probability in our favor.
💎If a pullback occur
NIFTY FIN SERVICE FOR 08 Jul#Execution only after break and close above or below from resistance or support 15-minute candle.
#Stop Loss above or below from resistance or support 15-minute candle.
(S/R Levels Will be Flipped in The Situation of Gap up OR Gap down Open, Support Will Turn in Resistance and Resistance Will Turn in Support)
(This Analysis and idea is based only on support and resistance mechanism, Buy after resistance break and close above sell after support break and close below, Closing below resistance a
Massive Opportunity Ahead for XECUSDT! Don't Miss Out!Yello Paradisers! Are you ready to seize a potential bullish move in XECUSDT? 📈 The market is showing signs of a major breakout, and you won't want to miss this. Let's dive into the details:
💎XECUSDT has formed a falling wedge pattern and taken liquidity, increasing the probability of a bullish move after confirmation.
💎We need a breakout of the falling wedge and resistance zone to confirm the bullish move.
💎While a small pullback entry is possible, it's riskier. I suggest waiting for the bre
NIFTY FOR 03 Jul#Execution only after break and close above or below from resistance or support 15-minute candle.
#Stop Loss above or below from resistance or support 15-minute candle.
(S/R Levels Will be Flipped in The Situation of Gap up OR Gap down Open, Support Will Turn in Resistance and Resistance Will Turn in Support)
(This Analysis and idea is based only on support and resistance mechanism, Buy after resistance break and close above sell after support break and close below, Closing below resistance a
NIFTY FIN SERVICE FOR 03 Jul#Execution only after break and close above or below from resistance or support 15-minute candle.
#Stop Loss above or below from resistance or support 15-minute candle.
(S/R Levels Will be Flipped in The Situation of Gap up OR Gap down Open, Support Will Turn in Resistance and Resistance Will Turn in Support)
(This Analysis and idea is based only on support and resistance mechanism, Buy after resistance break and close above sell after support break and close below, Closing below resistance a
BANKNIFTY FOR 03 Jul#Execution only after break and close above or below from resistance or support 15-minute candle.
#Stop Loss above or below from resistance or support 15-minute candle.
(S/R Levels Will be Flipped in The Situation of Gap up OR Gap down Open, Support Will Turn in Resistance and Resistance Will Turn in Support)
(This Analysis and idea is based only on support and resistance mechanism, Buy after resistance break and close above sell after support break and close below, Closing below resistance a
Copper buy given at 840 , 23 points profit running hold 858 sl
Copper buy given at 840 made high 866 , hold with SL 858 upside Target mentioned on chart
Disclaimer -
This information is only for educational purposes, this is not for any buy or sell recommendations .
On Our Harmonic pattern indicator
based trade setup take trade as explained below :-
ENTRY -
When price breaks 30% retracement Which is D points then take Entry on Buy or Sell Trade
SL -
SL is (-3%) Which is mentioned in Chart . our SL is just above or below of Recent high or Lo
Is CFXUSDT on the Brink of a Bullish Breakout?Yello Paradisers! Are you ready for a potential game-changer in the crypto market? Let's dive into the current setup for CFXUSDT and see what's brewing.
💎CFXUSDT has formed a classic cup and handle pattern, often a strong indicator of a bullish move. The recent price action suggests an inducement, increasing the likelihood of an upward breakout.
💎For this pattern to be confirmed, we need a decisive breakout above the resistance level. There's also a resistance line just above the current price
NIFTY FOR 02 Jul#Execution only after break and close above or below from resistance or support 15-minute candle.
#Stop Loss above or below from resistance or support 15-minute candle.
(S/R Levels Will be Flipped in The Situation of Gap up OR Gap down Open, Support Will Turn in Resistance and Resistance Will Turn in Support)
(This Analysis and idea is based only on support and resistance mechanism, Buy after resistance break and close above sell after support break and close below, Closing below resistance a
NIFTY FIN SERVICE FOR 02 Jul#Execution only after break and close above or below from resistance or support 15-minute candle.
#Stop Loss above or below from resistance or support 15-minute candle.
(S/R Levels Will be Flipped in The Situation of Gap up OR Gap down Open, Support Will Turn in Resistance and Resistance Will Turn in Support)
(This Analysis and idea is based only on support and resistance mechanism, Buy after resistance break and close above sell after support break and close below, Closing below resistance a
BANKNIFTY FOR 02 Jul#Execution only after break and close above or below from resistance or support 15-minute candle.
#Stop Loss above or below from resistance or support 15-minute candle.
(S/R Levels Will be Flipped in The Situation of Gap up OR Gap down Open, Support Will Turn in Resistance and Resistance Will Turn in Support)
(This Analysis and idea is based only on support and resistance mechanism, Buy after resistance break and close above sell after support break and close below, Closing below resistance a
Gold XAUUSD buy on dip given near 2300 , uptrend started continuDisclaimer -
This information is only for educational purposes, this is not for any buy or sell recommendations .
On Our Harmonic pattern indicator
based trade setup take trade as explained below :-
ENTRY -
When price breaks 30% retracement Which is D points then take Entry on Buy or Sell Trade
SL -
SL is (-3%) Which is mentioned in Chart . our SL is just above or below of Recent high or Low .
TARGET -
Target 1- (T1 : 61.8 %)
Target 2- (T2 : 88.6 %)
Target 3- (T3 : 127.2 %)
NIFTY FIN SERVICE FOR 01 Jul#Execution only after break and close above or below from resistance or support 15-minute candle.
#Stop Loss above or below from resistance or support 15-minute candle.
(S/R Levels Will be Flipped in The Situation of Gap up OR Gap down Open, Support Will Turn in Resistance and Resistance Will Turn in Support)
(This Analysis and idea is based only on support and resistance mechanism, Buy after resistance break and close above sell after support break and close below, Closing below resistance a
BANKNIFTY FOR 01 Jul#Execution only after break and close above or below from resistance or support 15-minute candle.
#Stop Loss above or below from resistance or support 15-minute candle.
(S/R Levels Will be Flipped in The Situation of Gap up OR Gap down Open, Support Will Turn in Resistance and Resistance Will Turn in Support)
(This Analysis and idea is based only on support and resistance mechanism, Buy after resistance break and close above sell after support break and close below, Closing below resistance a
Gift nifty ready for fresh akl time high Disclaimer -
This information is only for educational purposes, this is not for any buy or sell recommendations .
On Our Harmonic pattern indicator
based trade setup take trade as explained below :-
ENTRY -
When price breaks 30% retracement Which is D points then take Entry on Buy or Sell Trade
SL -
SL is (-3%) Which is mentioned in Chart . our SL is just above or below of Recent high or Low .
TARGET -
Target 1- (T1 : 61.8 %)
Target 2- (T2 : 88.6 %)
Target 3- (T3 : 127.2 %)