#NIFTY Support & Resistance / 1 Mar 202415-minute support and resistance levels for NIFTY, which I use as context for my larger, single stock breakout and reversal intraday trading setup. I try to share next-day stock and index levels, as well as results, to benefit the community. If you or someone you know may find this information useful, please feel free to share, comment, follow or get in touch for more information.
Disclaimer: Trading and investing carry risks, and you should consult with a qualified financial professional befor
Pivot Points
As said many times reliance go to 3000 then 2800 possible On Our Harmonic pattern indicator based trade setup take trade as explained below :-
Early trades Buy or sell below/ above 23.6 %, safe trades buy or sell above / below 41% , after taking trade next upside or downside levels will be target ,
When reverse buy or sell signal appear then book profit on Target or trail SL to 23.6 % If trailing SL hit then early trade can be taken above or below 23.6 and safe trade can b taken above/ below 41% ..
Please note:-
It's working on news based and vol
#TATAMOTORS Support & Resistance / 29 Feb 2024Here’s a stock I'm keeping an eye on for the next day's trading. I'm aiming for a 1%+ intraday profit with a flexible stop-loss.
The rules are simple - there are two lines marked on the chart that act as support or resistance, depending on where the price opens. When the price touches or crosses either line, from any direction, for the first time, I decide whether to buy or sell at or near the line based on six simple indicators + order book confirmations. If no trade is taken, the chart become
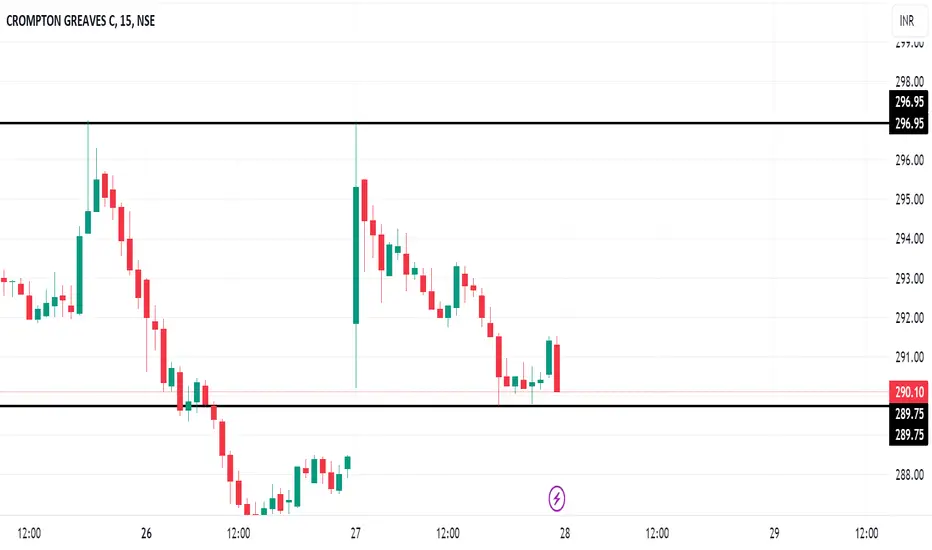
#CROMPTON Support & Resistance / 28 Feb 2024Here’s a stock I'm keeping an eye on for the next day's trading. I'm aiming for a 1%+ intraday profit with a flexible stop-loss.
The rules are simple - there are two lines marked on the chart that act as support or resistance, depending on where the price opens. When the price touches or crosses either line, from any direction, for the first time, I decide whether to buy or sell at or near the line based on six simple indicators + order book confirmations. If no trade is taken, the chart become
AMD to 185, then 200. NFAAMD is looking bullish. Good volume bottoms, a nice support retest in extended hours in preparation for markup. Looks like a good entry for calls. This isn't financial advice or recommendation. just an idea to share in words
I like $200 and $210 strikes for April19th expiry the most. Will watch those
NFA
NASDAQ:AMD
#Nifty50 Support & Resistance / 28 Feb 2024Char for 15-minute support and resistance levels for broader market index, which I use as context for my broader single stock breakout and reversal intraday trading setup. I try to share next-day stock and index levels, as well as results, to benefit the community. If you or someone you know may find this information useful, please feel free to share, comment, follow or get in touch for more information.
Disclaimer: Trading and investing carry risks, and you should consult with a qualified f
ACCELYA Near ATH BO [Weekly]I somehow just zoomed out and checked the chart of ACCELYA solutions and I was amazed by it.
Its slowly moving towards its all time high BO and this might move strong post that, keep a check on this as this scrip has been in the chatter on value research and on twitter as well a bit.
Recent BOs have been with good volumes and seem to be sustaining. See if your risk management allows you to take a position with SL to anticipate a BO if you like those kind of plays.
BORORNEW BO [Weekly]This BO happened a couple of weeks back and i forgot to post about this. Volumes here are a big plus and i have seen some twitter handles talking about this as a decent play as well. Entered my radar recently. Much upside ahead, keep a check on this as this play has a lot of chatter and volume to go along with it.
NAZARA BO [Weekly]NAZARA breaking out of weekly base, volumes are encouraging and next level where overhead supply might kick in with force could be around 1350.
Keep an eye on market sentiment, it ideally should be in our favor while taking a position if one likes the setup.
Keeping in watchlist for now. :)
#BATAINDIA 15m Support & Resistance - 27 Feb 2024Support and resistance levels are key concepts in technical analysis, a method used to evaluate and forecast price movements in financial markets, particularly in stocks, forex, and commodities. Support level refers to a price level at which a security or asset often finds buying interest, preventing its price from falling further. Traders and investors view support as a psychological or structural level where demand for the asset increases, leading to a potential reversal or a slowdown in price
BankNifty 15m Support & Resistance - 26 Feb 2024Look for areas where the price has consistently reversed or stalled. Once established, use additional indicators such as moving averages, Fibonacci retracements, or trendlines to confirm these levels.
When trading, focus on price action around these zones. Buy near support when there's a bounce, and sell around resistance during pullbacks. Utilize candlestick patterns for entry and exit signals, paying attention to bullish or bearish reversal patterns.
Nifty50 15m Support & Resistance - 26 Feb 2024 Look for areas where the price has consistently reversed or stalled. Once established, use additional indicators such as moving averages, Fibonacci retracements, or trendlines to confirm these levels.
When trading, focus on price action around these zones. Buy near support when there's a bounce, and sell around resistance during pullbacks. Utilize candlestick patterns for entry and exit signals, paying attention to bullish or bearish reversal patterns.
Nifty 50 Technical Analysis - 26th February 2024Nifty 50 Technical Analysis - 26th February 2024
## Overview
Nifty 50 has exhibited movements in response to identified support and resistance levels. Traders are advised to closely monitor these levels for potential market insights.
### Support Levels
**1. Support Level 1: 22,100**
- A crucial support level that, if broken, may lead to a potential decline towards 21,900.
**2. Support Level 2: 21,900**
- A secondary support level that could be tested if the market breaks below 22,100.
BANKEX Finally Bullish?The upmove in bankex especially on Wednesday was a very crucial and decisive one,
Looks like Bankex has made a bottom for now. I will only be looking for bullish trades.
As long as bankex is above 52850 I am only going to be taking bullish trades.
Simplicity and understanding what the price is telling is the only thing one should aim for is what I believe as a trader.
Golden Pivot zone Formation.If price opens above/near CPR on Monday we can go long from GPZ to H3 and VAH
if Price opens above VAH/Near VAH and shows bearish Price Action, then in that case we will go short till GPZ/CPR and Long on CPR-GPZ as Bulls will definitely defend this zone if price comes to this level then going long should be considered.
NOTE- This is an analysis and does not mean a buy-sell advise to anyone in any manner, please consult your financial advisor before investing. (I am not SEBI Registered Advisor)
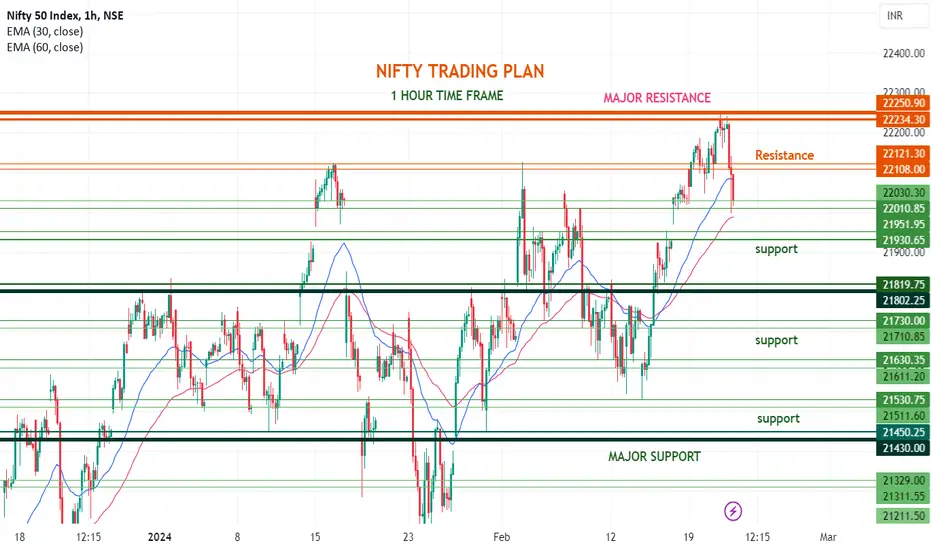
Nifty Confirm Targets For Expiry Day 22 Feb 2024 Nifty Trading Plan For Expiry Day
Nifty Supports
Nifty Support 1 - 22000
Nifty Support 2 - 21930
Nifty Support 3 - 21730
Nifty Resistance
Nifty Resistance 1 - 22130
Nifty Resistance 2 - 22230
Nifty Resistance 3 - 22250
Nifty Trend Signal From Open Interest Analysis
PCR ratio as per Option Chain Analysis - 1.09 ( Bullish)
Max Pain As per Option Chain Analysis - 21850
Major Resistance as Per Nifty Open Interest Analysis - 22200 /22500
Major Sup
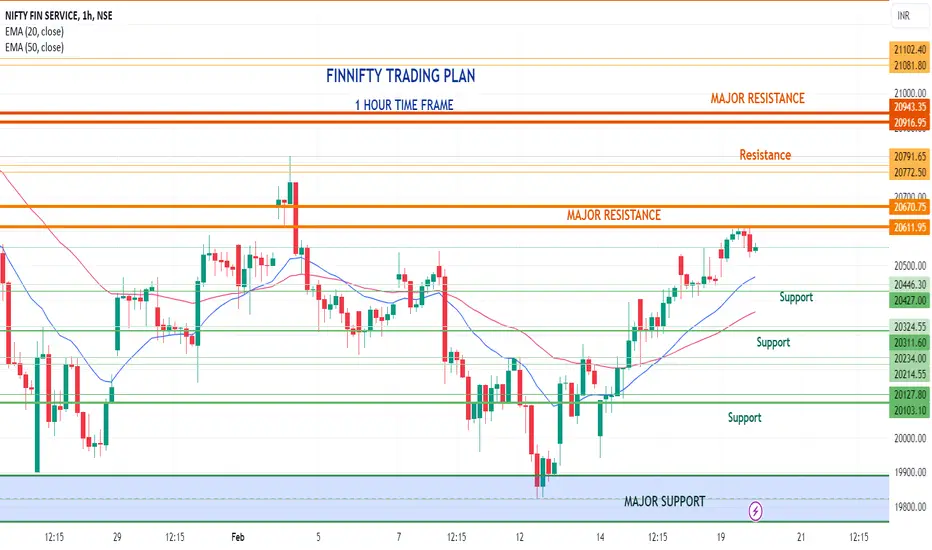
Finnifty Confirm Targets with Trading Plan for Expiry Finnifty End of Day Analysis to Identify Potential Trading Opportunities for the Next Trading Day
Finnifty Supports
Support 1 - 20430
Support 2 - 20310
Support 3 - 20215
Finnifty Resistance
Resistance 1 - 20670
Resistance 2 - 20770
Resistance 3 - 20915
Finnifty Trend Signal From Open Interest Analysis
PCR ratio as per Option Chain Analysis - 1.016 ( Bullish)
Max Pain As per Option Chain Analysis - 20500
Major Resistance as Per Finnifty Open Interest Analysis - 21000
Major Sup
Glenmark Pharma - Nearing buy zone on weekly chart The stock took support at the 40 weekly moving average and is hovering near the buy zone.
Positive momentum expected above the levels of 925 for an initial target of 1100.
Will review once the target is achieved.
Strict stop loss at 5-8%.
Note: Not a buy/sell recommendation. Consult your financial advisor.
Mphasis Ltd - Positional view on weekly chartFor those who have read Stan Weinstein's book "Secrets For Profiting in Bull and Bear Markets" will relate to the structure forming here and the stage in which the stock is currently in.
The stock price is hovering above the 40 Weekly Moving Average (WMA), is in an uptrend and has formed positive base formations. Post this week's bullish candle formation the stock price is near the buy zone.
Manage strict stop loss of 5-8% if the trade goes wrong
Note: Not a buy/sell recommendation. Please do
Accelya solutionsLook out for accelya solutions breaking out 6.5Y consolidation. A stock roars when the consolidation is longer timeframe. 2800 can be a target. Fundamentals are good but not as good as cigniti or something. Bought just bcuz the consolidation is 6.5Y and is looking for breakout.
Disclosure: Holding