Swing High and Swing Low 🧭 Overview
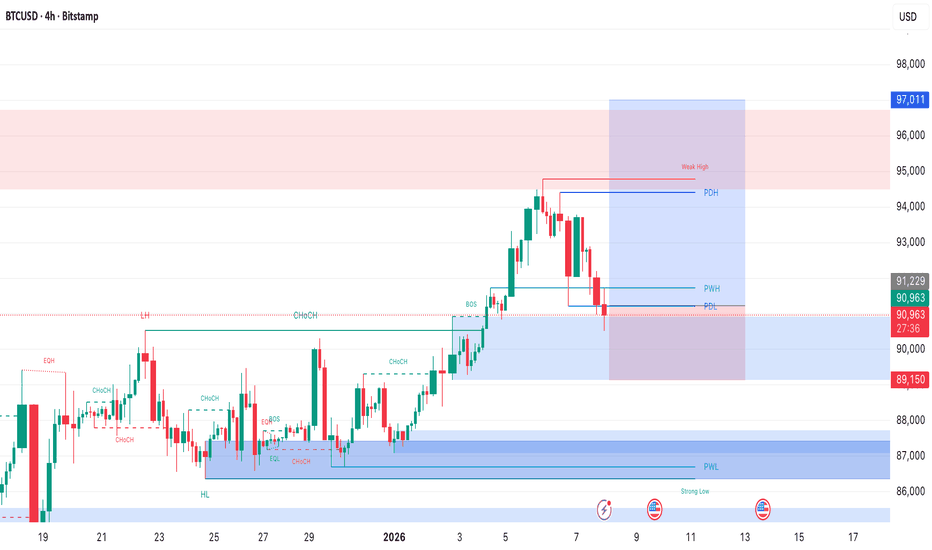
Swing Highs and Swing Lows are fundamental concepts used to understand market structure, trend direction, and key reaction zones. By identifying where price makes temporary tops and bottoms, traders can better interpret momentum, structure shifts, and areas of potential support or resistance.
⸻⸻⸻⸻⸻⸻⸻⸻⸻⸻⸻⸻⸻⸻
📌 Swing High
A Swing High forms when a candle’s high is higher than the highs of surrounding candles on both the left and right sides.
It represents a local price peak, where buying pressure weakens and selling pressure begins to appear.
⸻⸻⸻⸻⸻⸻⸻⸻⸻⸻⸻⸻⸻⸻
📌 Swing Low
A Swing Low forms when a candle’s low is lower than the lows of surrounding candles on both the left and right sides.
It represents a local price bottom, where selling pressure weakens and buying interest starts to emerge.
⸻⸻⸻⸻⸻⸻⸻⸻⸻⸻⸻⸻⸻⸻
🔑 Key Points
• Confirmation Delay: Swing points are confirmed only after the required right bars are formed .
• Market Structure: Swing highs and lows define trend direction .
• Break of Structure: Price breaking a prior swing high or swing low signals a potential structure shift.
• Support & Resistance: Swing lows often act as support, and swing highs often act as resistance.
• Reversal Zones: Swing points frequently mark areas of price rejection.
• Noise Filtering: Left and right bar logic helps filter minor price noise.
• Higher Timeframe Reliability: Swing points are more reliable on higher timeframes.
• Context, Not Signals: Swing points provide market context and should be used with confirmation tools.
⸻⸻⸻⸻⸻⸻⸻⸻⸻⸻⸻⸻⸻⸻
📊 Chart Explanation
On the chart, swing highs are marked where price creates a higher high relative to neighboring candles, while swing lows are marked where price creates a lower low.
The left bars represent candles formed before the swing candle, and the right bars represent candles formed after it.
Only when both sides are completed is the swing point confirmed, making it a reliable reference for structure and trend analysis.
⸻⸻⸻⸻⸻⸻⸻⸻⸻⸻⸻⸻⸻⸻
🟢 Summary
Swing High = Local price top
Swing Low = Local price bottom
Swings define market structure, trend bias, and reaction levels
Confirmation comes after, not during, formation
⸻⸻⸻⸻⸻⸻⸻⸻⸻⸻⸻⸻⸻⸻
👀 Observations
• Frequent swings suggest strong momentum.
• Wider spacing between swings indicates consolidation.
• Breaks of major swing points often lead to strong directional moves.
• Swing points align well with support/resistance and price-action strategies.
⸻⸻⸻⸻⸻⸻⸻⸻⸻⸻⸻⸻⸻⸻
🏁 Conclusion
Swing Highs and Swing Lows are essential tools for reading price action objectively. They help traders understand where the market has reacted in the past and how structure evolves over time. When combined with confirmation and higher-timeframe context, swing analysis becomes a powerful foundation for disciplined trading decisions.
⸻⸻⸻⸻⸻⸻⸻⸻⸻⸻⸻⸻⸻⸻
⚠️ Disclaimer
📘 For educational purposes only
🙅 Not SEBI registered
❌ Not a buy/sell recommendation
🧠 Shared purely for learning and pattern understanding
📊 Not Financial Advice
Pivot Points
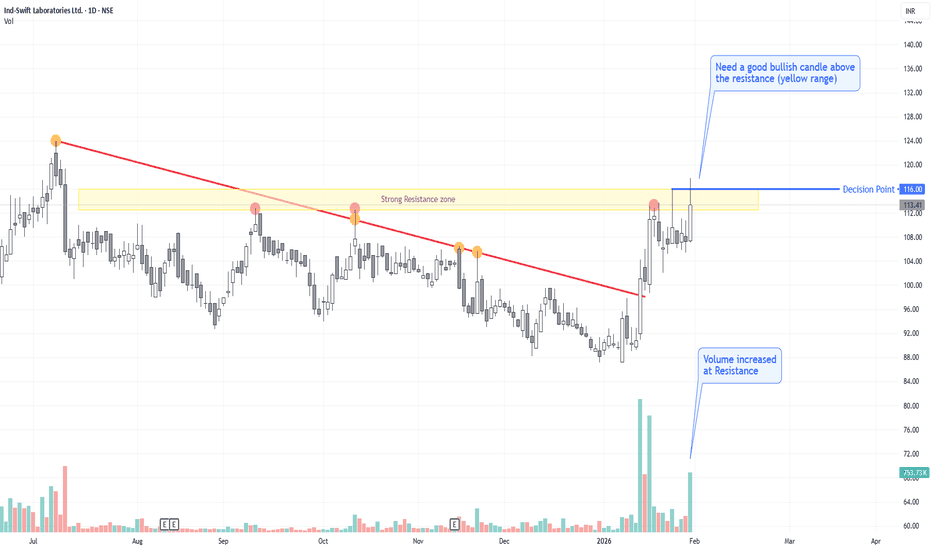
INDSWFTLAB - Volume increased at ResistanceDISCLAIMER: This is purely an observation and should not be considered a trade recommendation. Kindly conduct your own analysis before making any trading decisions.
Key Observations:
1. The price has repeatedly rejected the same level in previous attempts.
2. Currently, it is testing the strong resistance zone with notable volume.
3. A confirmed close of a strong bullish candle above the resistance zone is required for validation.
XAU/USD | 1H | CPI Setup in PlayGold just swept the previous low around 3615 and is showing signs of accumulation. Liquidity below has been taken, and the market structure hints at a bullish delivery if CPI comes in line with expectations.
Key levels:
Demand Zone 3610–3620 where buyers stepped in
First Target 3650 area (mid supply)
Final Target 3685–3690 (major supply/liquidity pool)
Bias: Waiting for a clean internal break of structure and retest before the impulsive move up. CPI data could be the catalyst for this push toward the upper liquidity zones.
Indus Tower – Long Trade SetupIndus Towers has triggered a bullish breakout above a prior supply zone supported by strong momentum and confluence with the 21-day EMA.
🔍 Trade Thesis:
- Breakout Confirmation: Price has decisively breached the previous supply zone, indicating a shift in market structure.
- EMA Confluence: The breakout aligns with the 21 EMA (₹426.41), reinforcing trend strength. The 50 EMA serves as a deeper support and stop-loss buffer.
- Risk-Reward Setup: Defined stop-loss below the 50 EMA targeting a 1:3 reward ratio with a projected upside near.
Note: The trade remains invalid if prices travel up with more than 2-3% move and retest the zone.
Intraday Short Setup | Jan 16th 2026 | Valid Until Daily ClosePrice when pushed into a potential intraday Pivot supply zone (red box) where sellers may step in. This trade is based on the expectation of a rejection from this area.
Entry: Red box - a short entry zone aligned with overhead supply
Stop Loss: Above the red zone (invalidates the setup)
Target: Green box - area to consider partial/full exit based on momentum
Risk-reward is favorable with a tight invalidation and clean downside target
Price may stall or reverse near the red box, creating short opportunity
Note:
This is an intraday trade idea that expires at 00:00 UTC (Daily Candle Close). Re-evaluate the setup if price remains indecisive near the entry zone close to that time.
Intraday Long Setup | Jan 16th 2026 | Valid Until Daily ClosePrice might retrace to a strong pivot zone.
Structure remains bullish with potential for continuation after pullback.
Tight risk control.
Watch for price reaction within the red zone. Entry only if confirmation appears
The setup expires at end of the daily candle close.
Weekly Long Setup | Jan 20th 2026 | Valid Until Weekly ClosePrice has retraced to a strong pivot zone (marked by the red box).
Structure remains bearish however, with potential reversal for continuation after pullback.
The green box represents a high-probability long opportunity with tight risk control.
Watch for price reaction within the red zone. Entry only if confirmation (e.g., bullish engulfing, strong wick rejections) appears.
The setup expires at end of the weekly candle close.
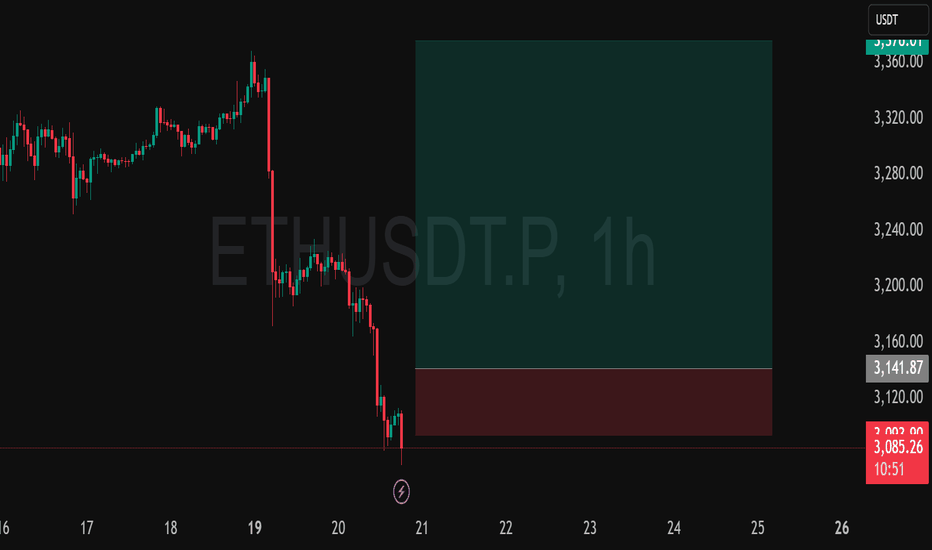
Weekly Long Setup | Jan 20th 2026 | Valid Until Weekly ClosePrice might retrace to a strong pivot zone (marked by the red box).
Structure remains bullish on HTF with potential for continuation after pullback.
The green box represents a high-probability long opportunity with tight risk control.
Watch for price reaction within the red zone. Entry only if confirmation (e.g., bullish engulfing, strong wick rejections) appears.
The setup expires at end of the weekly candle close.
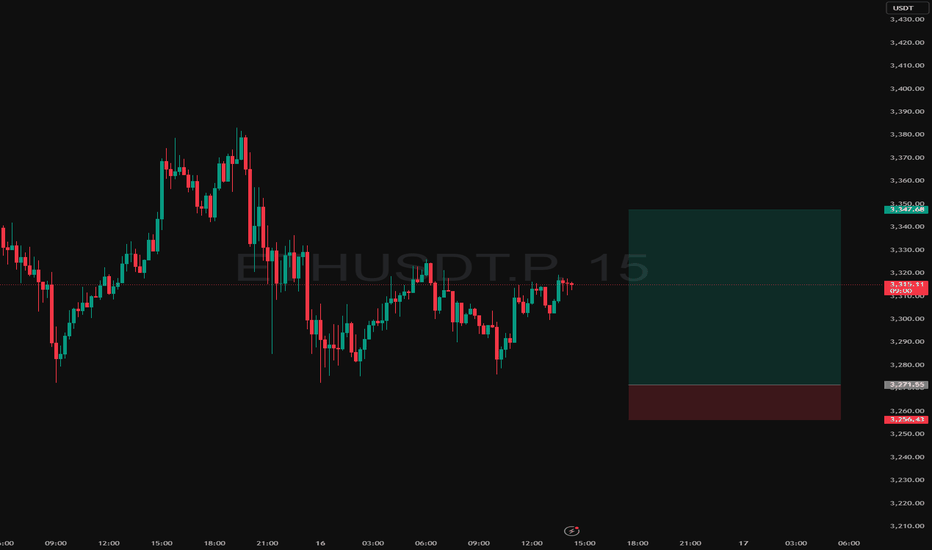
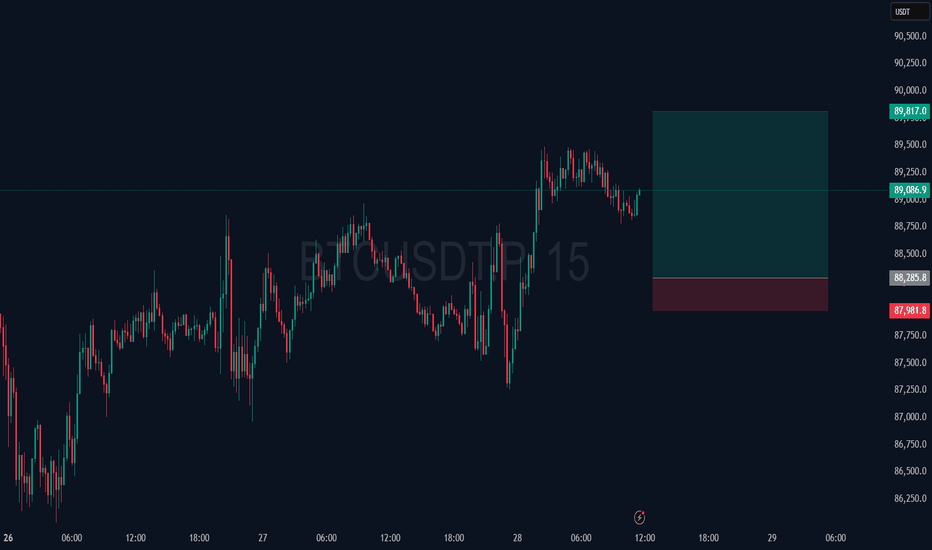
Intraday Long Setup | Jan 28th 2026 | Valid Until Daily ClosePrice might retrace to a strong pivot zone.
Structure remains bullish with potential for continuation after pullback.
Tight risk control.
Watch for price reaction within the red zone. Entry only if confirmation appears
The setup expires at end of the daily candle close.
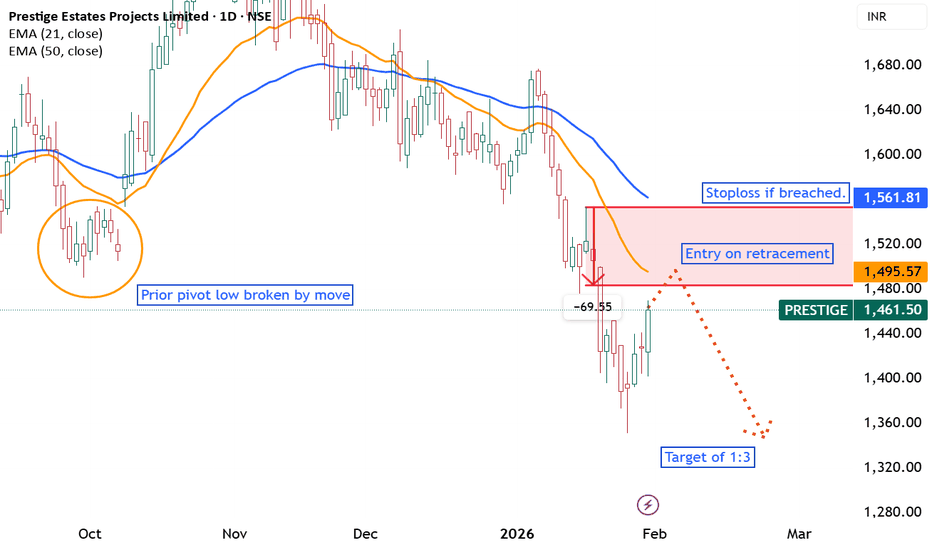
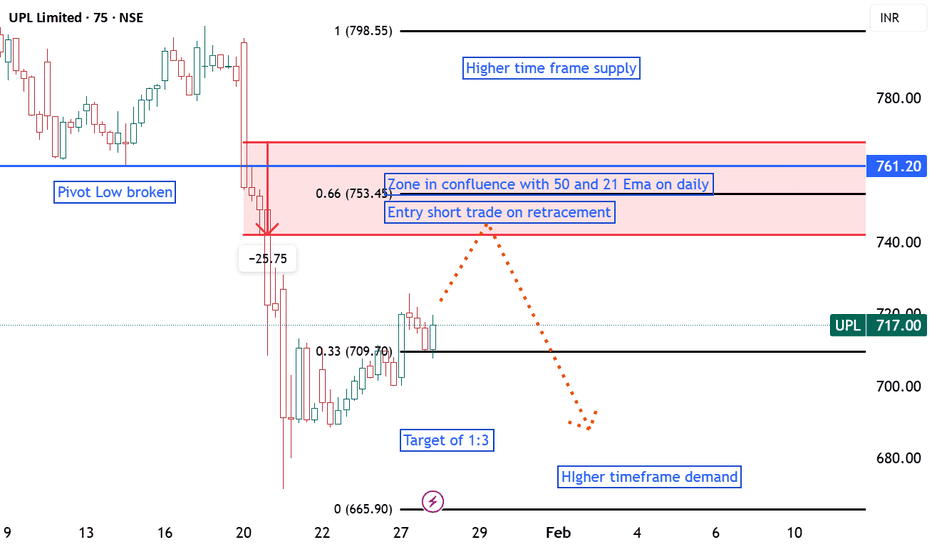
UPL Short Trade Setup UPL has broken a prior pivot low signaling potential weakness. Price is retracing toward supply zone which aligns with the 50 and 21 EMA confluence on the daily chart—a strong area of resistance.
This zone offers a high-probability short entry, targeting a move back toward the higher time frame demand zone.
Trade Plan:
- Entry: On rejection from the zone
- Stop Loss: Above supply zone at 15 % Datr
- Target: (1:3 RR)
Trade entry remains invalid if price moves down before retracement creating a lower low and lower high.
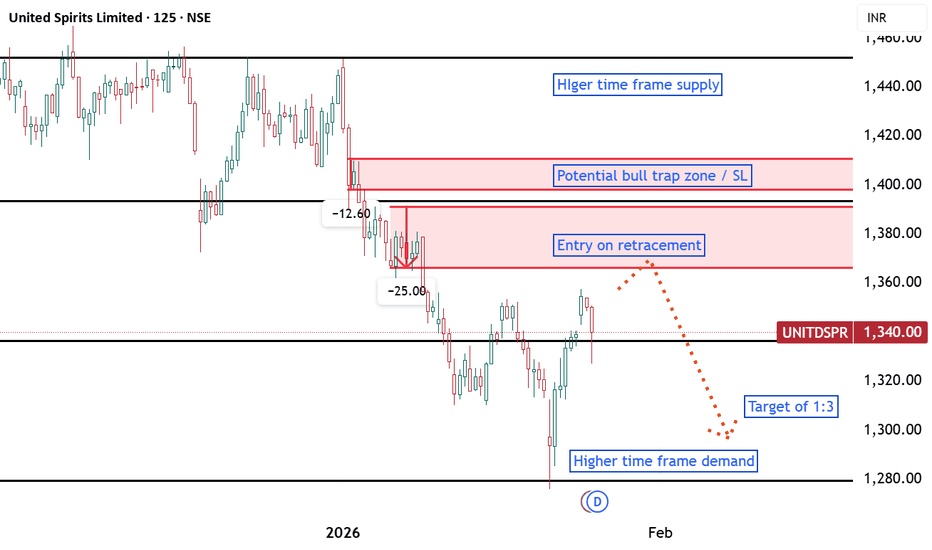
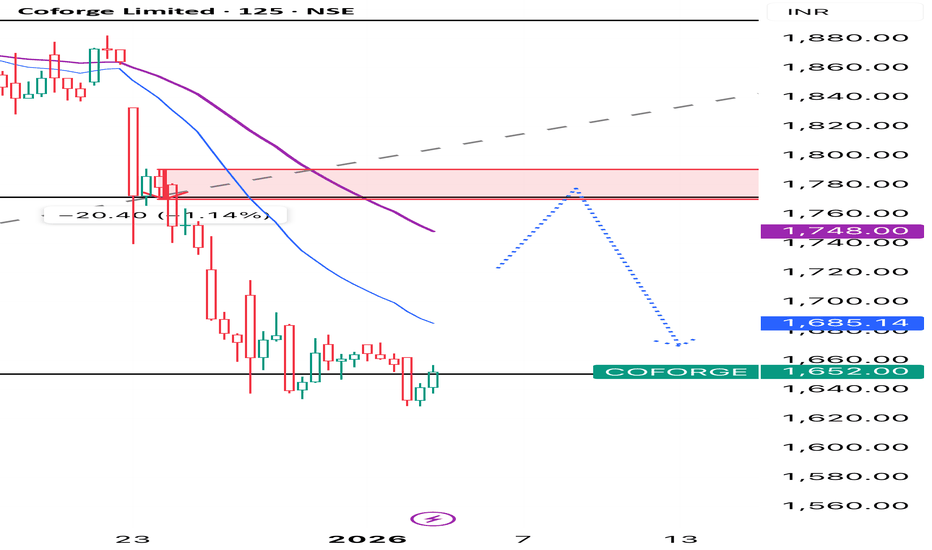
Unitdspr Short setup.Highlighting key zones and a potential short setup:
The stock is already on downtrend on the daily timeframe. With this the zone marked formed can act as a strong resistance as it is in confluence with 50 EMA on the daily and weekly.
The prices below the 21 Dema marks this significance too.
With the price breaking pivot levels with the move it can be opportunity for short trade.
Keep SL at or above the trap zone.
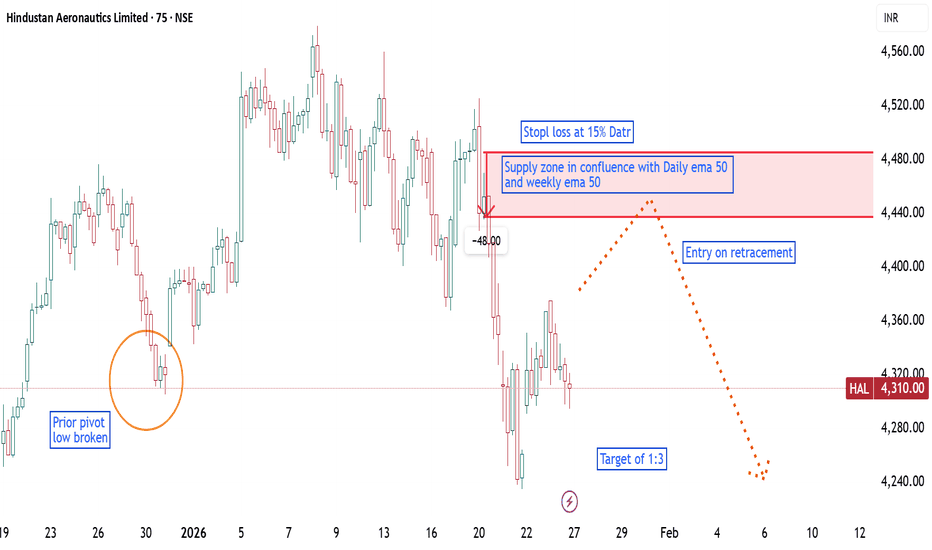
Hal short setupSpotted a high-probability short setup on Hindustan Aeronautics Ltd based on multi-timeframe confluence:
- 🔴 Supply Zone aligned with Daily EMA 50 and Weekly EMA 50 – strong resistance cluster.
- 🔄 Entry on retracement into the zone, post breakdown of prior pivot low.
- 🟠 Stop Loss placed at 15% DATR above the zone for volatility buffer.
- 🎯 Target set at 1:3 RR, respecting structure and momentum.
- 📉 EMA 21 < EMA 50 confirms short bias
The zone is placed with high probability.
The trade is valid till the time price retraces to to level and moves down.
The trade remains invalid if price moves down first to form lower high and lower low and then retraces back in sessions to come.
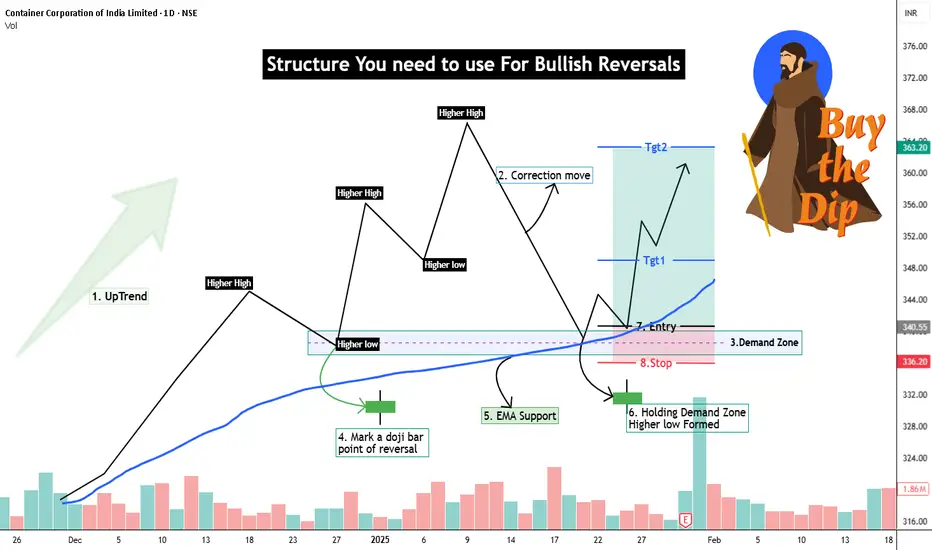
Bullish Reversal Setup - Simple & Practical GuideIntroduction to the Setup
In this educational post, we will discover a low-risk bullish reversal setup,
We all know that markets are dynamic & getting more and more efficient, and in such conditions, we also need to take a dynamic approach to the markets in different situations, you can't have a edge if you stick to only one setup in every market situation. For Example If you are a breakout trader then you will only look range breakouts but the current market situation is kind of end phase of A correction. So there you won't find stocks with good ranges building up for breakout At that point You either will have bad entries or either you need to wait for the range to build.
But here let's say you have another setup of reversal trading then you can find many good entries with low risk.
This setup a combination of price action and moving averages, Let's explore great setup in detail.
1. You need to identify the The trend
👉🏻Market was already in an uptrend.
👉🏻Higher highs and higher lows were present earlier.
Once you have identified a uptrend then you are ready to move to the second step.
2. Correction Phase – Healthy Pullback, Not Breakdown
👉🏻Price made a deep correction from the top.
👉🏻This correction came into the EMA support area.
👉🏻No panic selling, no long red candles exploding downward.
A correction should show signs of weakness when it reaches into 3rd step.
3. The Demand Zone
👉🏻 You need to find a area on the left side of chart (in uptrend) from where Massive up move has started.
👉🏻 On the chart you will find we have marked a rectangle box in blue color starting from the previous higher area, From this point the price has good up move Hence it's a demand zone.
👉🏻 When falling price reaches this area the price should react
by giving wicks from below in a candle or the size falling candle should reduce or some indecision candle form like Doji, spinning top etc.
4. Demand Zone Marking
👉 On the higher low you area you will find range candle just before the upmove bursts so that candle is used to mark the demand zone
5.EMA + Demand Zone = Support Cluster
👉Price reacts exactly where EMA support and demand zone overlap.
👉This zone is where buyers previously stepped in.
👉Market is basically saying: “This area still matters.”
⭐️ One support is weak. Multiple supports together are strong.
6. Holding demand zone
👉🏻After touching demand, price does NOT make a lower low.
👉🏻Instead, it forms a higher low.
👉🏻This is the first real signal that sellers are losing control.
7. Entry Action
👉🏻 Usually when the price hit demand zone and it forms few bullish candles, it tries to retest the demand zone once again but this time it reverses a little above from demand zone at that time you need to act and place your buys.
8. Setting The Stoploss
👉🏻 The stop loss is below the demand zone, If the demand zone fails to hold the prize then you will get a very early exit, Usually these kind of entries have 1% to 2% of stop loss because we do not want to trade any demand zone which is bigger than 2%
9. The Reward
👉🏻 In a reversal setup you at least need to maintain 1:2 risk to reward ratio.
👉🏻 Pay attention last Higher High Zone From where this correction has started That point will be called as a supply zone and there also you will find range bar just the starting of down move so that supply zone is the maximum target that you need to aim for.
👉🏻 Make sure that the last supply zone is not too near from your entry you need to give price some room to make movements.
Practice Time - With Live Examples🗒
This is HOSE:TVS motor 1h chart and we have applied a 200 EMA.
First you will find a very good uptrend then a pullback that has stopped for the first time just above 200 EMA and then it gave a very good high making new swing high then it corrected down into the last reversal area which we have marked as a demand zone and there 200 EMA is also acting as a support so we have a very good cluster of supports there,
At that time you will strike and place your buy orders.
I hope you have a good Clarity on this Setup, simple and actionable with a good price action understanding.
Hit the Boost Button & Comment down your Doubts, Queries and ideas
Keep Learning,
Happy Trading.
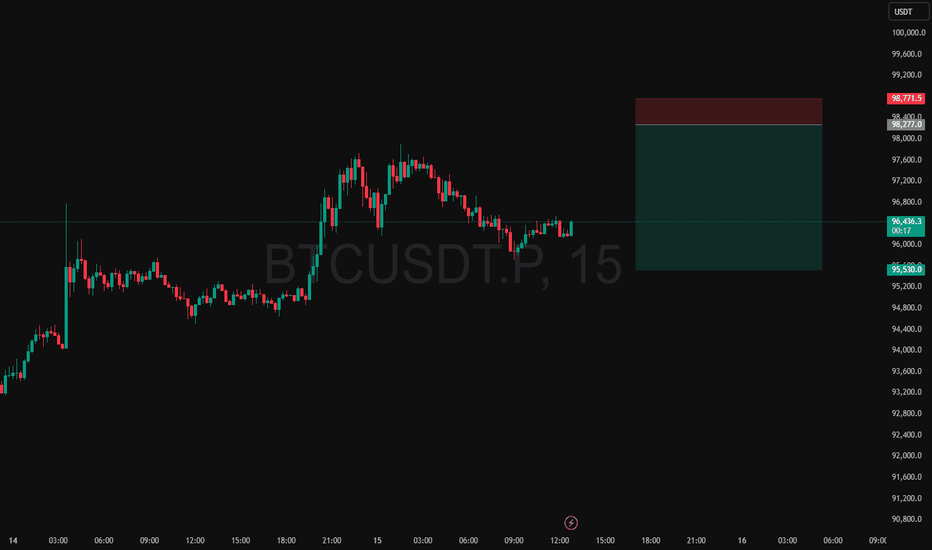
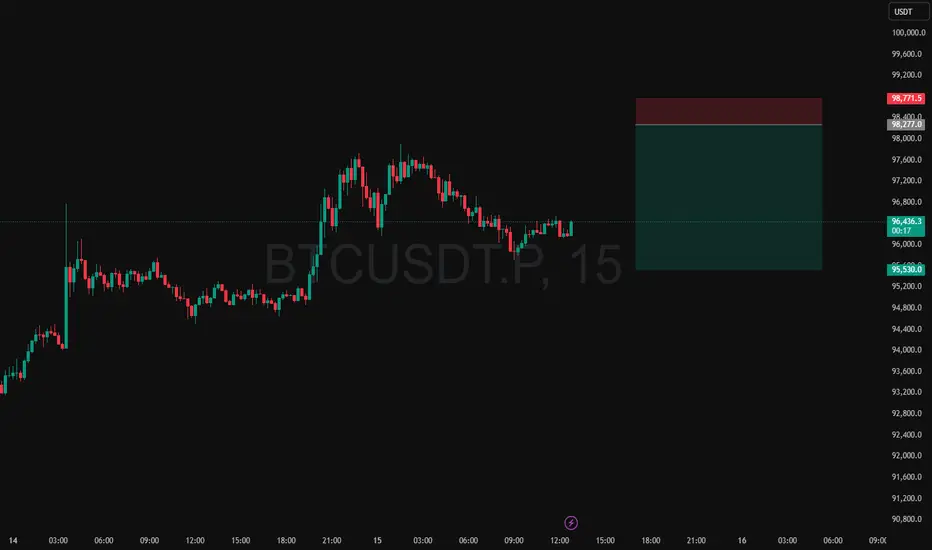
Intraday Short Setup | Jan 15th 2026 | Valid Until Daily ClosePrice when pushed into a potential intraday Pivot supply zone (red box) where sellers may step in. This trade is based on the expectation of a rejection from this area.
Entry: Red box - a short entry zone aligned with overhead supply
Stop Loss: Above the red zone (invalidates the setup)
Target: Green box - area to consider partial/full exit based on momentum
Risk-reward is favorable with a tight invalidation and clean downside target
Price may stall or reverse near the red box, creating short opportunity
Note:
This is an intraday trade idea that expires at 00:00 UTC (Daily Candle Close). Re-evaluate the setup if price remains indecisive near the entry zone close to that time.
Intraday Short Setup | Jan 15th 2026 | Valid Until Daily ClosePrice when pushed into a potential intraday Pivot supply zone (red box) where sellers may step in. This trade is based on the expectation of a rejection from this area.
Entry: Red box - a short entry zone aligned with overhead supply
Stop Loss: Above the red zone (invalidates the setup)
Target: Green box - area to consider partial/full exit based on momentum
Risk-reward is favorable with a tight invalidation and clean downside target
Price may stall or reverse near the red box, creating short opportunity
Note:
This is an intraday trade idea that expires at 00:00 UTC (Daily Candle Close). Re-evaluate the setup if price remains indecisive near the entry zone close to that time.
BTCUSD – 1H | Liquidity Run → Distribution →Mean Reversion ScenePrice delivered an impulsive expansion into premium after sweeping internal liquidity from the range lows. That move was displacement, not acceptance.
We are now stalling at a prior H1 supply / EQH zone near the range high. Structure here is weak: wicks, overlap, and loss of momentum hint at distribution rather than continuation.
Narrative
Liquidity taken above recent highs
Price taps premium supply
Expect a lower high / range failure
Smart money likely reallocating shorts
Execution Bias
Shorts favored below the blue level
Invalidation only on clean H1 acceptance above supply
Downside Targets
Range mid → internal liquidity
Range lows
External sell-side resting near deep discount zone
Until price shows acceptance above supply, this remains a sell-the-rally environment.
Expansion up was the trap. Mean reversion is the play.
Dr reddy short idea
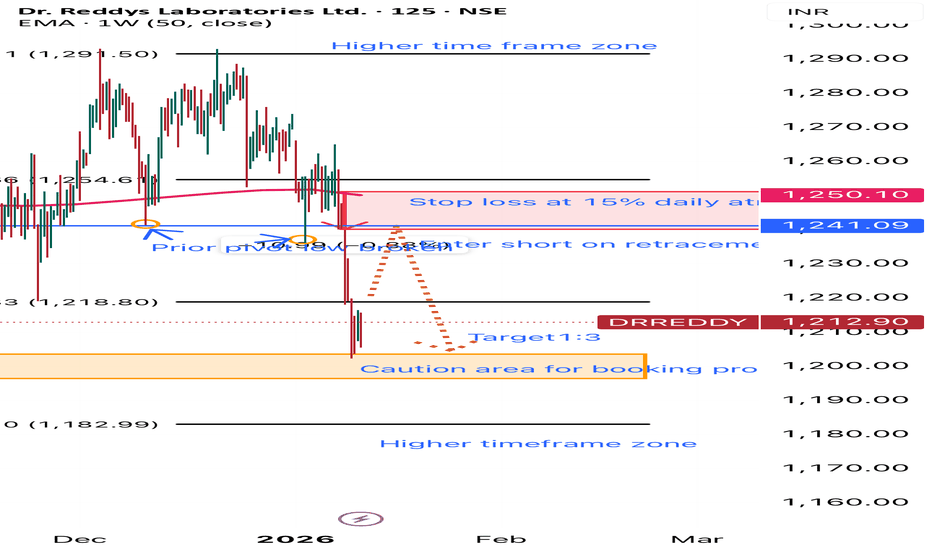
Short Trade Setup Description
This setup is based on a clean break of the prior pivot low around the level ₹1,246.61, confirming bearish momentum. Defined short entry zone just below ₹1,241.09, aligning with a weekly supply zone from the higher timeframe.
The zone confluences with a weekly 50 EMA also.
• 🔻 Entry: Short on retracement into the supply zone
• 🛡️ Stop Loss: Above the zone with a buffer of 15% DATR
• 🎯 Target: 1:3 Risk-Reward, aiming toward the ₹1,200 region
• ⚠️ Caution: Profit booking advised near the weekly demand zone and the orange-shaded caution area
This trade respects multi-timeframe confluence and risk management principles.
Voltas Bullish viewThe 3% move created by Voltas, has changed the trend of the stock.
The demand zone at 1390 level and a trap zone at 1365 levels considered can be a bullish opportunity with the stock beginning to make up-move and at low range on higher time frame.
The move created has broken a prior pivot too.
Also the demand zone created lies on an area of 21 and 50 DEMA.
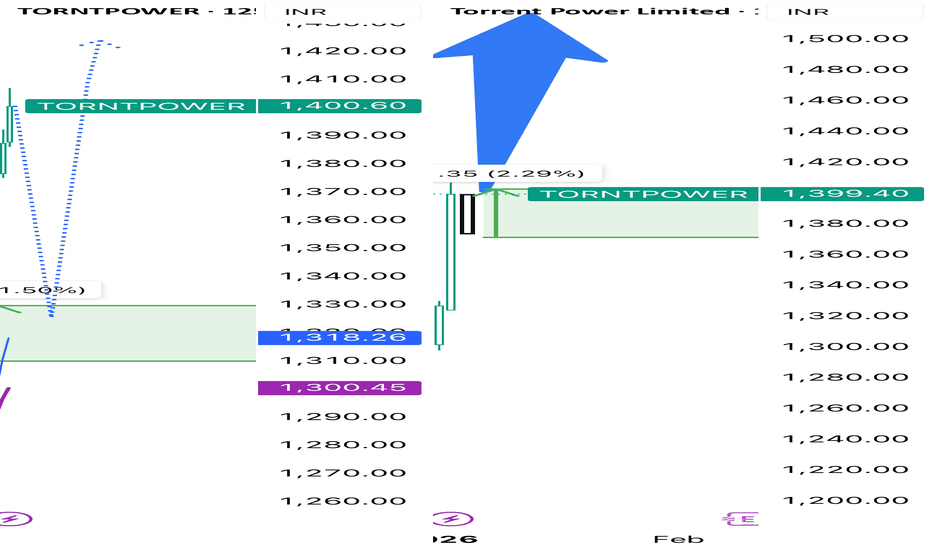
Torrent Power Ltd Bullish viewTorrent Power has created a 5%+ move followed by change in trend.
The stock has closed above EMA21/50 marking it as a bullish sign.
With such change in trend there can be 2 scenarios which can exist.
Scenarios1: The stock retraces to the demand zome formed at 1318 levels. In such a retracement going long would be a opportunity.
Scenario 2: A small daily inside candle if formed on the daily ( inside candle meaning a smaller range candle which has a high low with the range of previous candle), can be an opportunity for break out.
BTC Weekly downtrend & Potential Reversal zoneson 27th Oct, BTC had its buyside sweep on Daily chart and later confirmed to be the Lower High for its weekly bearish trend reversal.
(Marked with grey arrow)
Earlier we had the bullish fib marking 2nd swing target of 124.4k & that marked the end of bullish trend in October this year.
With current weekly downtrend, we have 1st , 2nd & 4th swing targets.
(refer to the red downward fib)
1st swing target zone - 90.9k till 82.1k
2nd swing target zone - 73.2k till 64.4k
( this is also confluencing with 3M FVg gap as marked on the chart)
this maybe highly probable area for weekly trend to reverse or atleast a strong bounce up.
4th swing target zone - 37.9k till 29.1k