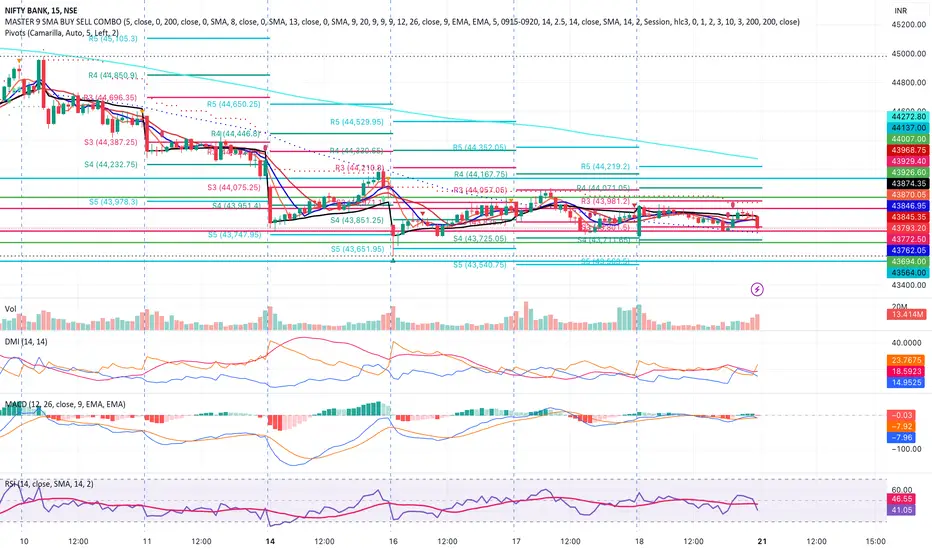
Pivot Points
Nifty Trading Plan for Monday 28 Aug Nifty Support & Resistance is the Best Nifty Trading Indicator for Day Trading it is also called Nifty Price Action Strategy
Support Zones for Nifty are as Given Below
S1- 19180
S2- 19050
S3 -19000
Resistance Zones for Nifty are as Given Below
R1- 19270
R2 -19370
R3 -19440
Nifty Trend Signal From Open Interest Analysis
PCR ratio as per Option Chain Analysis -0.75 ( Bearish)
Max Pain As per Option Chain Analysis -19300
Major Resistance as Per Nifty Open Interest Analysis -19400
Major S
PRE MARKET ANALYSIS FOR NIFTY AND BANK NIFTY FOR 21 AUG 202321 Aug 2023
WORLD MARKETS
1. World markets has turned negative. US, Europe and Asia all are negative.
INDIA VIX AND GIFT NIFTY
1. India VIX is at 12.14 indicatig bearishness.
2. GIFT Nifty is indicating 48 points downtick at 19262. This amounts to 43700 levels for bank nifty.
INDEX HEAVY WEIGHTS
1. HDFC Bank is bearish. It has support at 1579.5. Resistance can be seen @ 1596 . Any break of 1587 is bearish for a tgt of 1581.
2. ICICI Bank has resistance at 959. Any break of 946 is bearish. Bullis
Can we see more fall in NIFTY ?Hey Hardworking traders! Here's a quick update on the Nifty 50 index's recent journey and its future outlook-
Nifty highlights:
>>So, It has been a roller coaster ride for NIFTY, It has witnessed multiple obstacles, Be it after Covid affects be it Russia-Ukrain war, High inflation and interest rate hike.
>>These macro incidents combined together resulted Index to stay sideways. But the game changed in June, when it broke out and nearly touched 20,000.
Current Market updates/My views
>>R
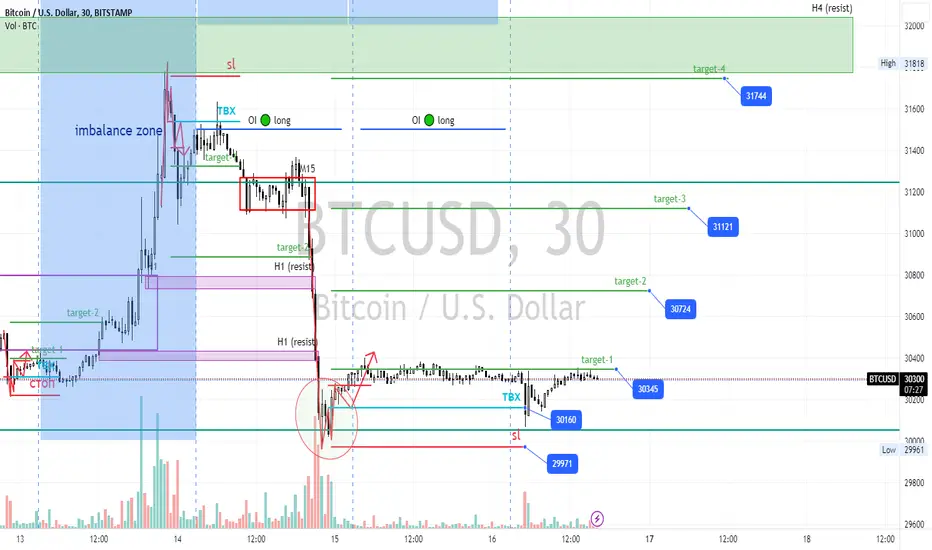
#BTC 🟢 M15 LONG (Bitcoin). Long awaited failure 📣For more than one week, Sellers have been gaining selling positions... Although they haven't reached the main selling zone 32k. But there was an impressive sale .. and at the same time, grandiose discounts for 26.2K, who didn’t have time - he didn’t have time)
On the retest of the M15 imbalance near our D1 Buy Zone, we expect a hike up and a breakout of the long-awaited level of 31K.
Entry price below market opening price.(✔️)
M15 imbalance at the potential of the D1 range.(✔️)
Below the
Huge breakout in Morganite crucible.Hello Smart traders Hope you are doing exceptionally well in you Trading journey.
This time we will discuss about another beautiful breakout stock Morganite Crucible (India) Ltd.
Technical-
Morganite Crucible (India) Ltd has shown a rectangle channel pattern breakout. It spent six years in a consolidating phase. During this time, it consistently tested its resistance level, moving back to its strong support. Recently, it retested its resistance once again, undergoing a pullback. However, this
"Beautiful Breakout in ESAB India: Unlocking Potential.Welcome back again. Today we will discuss about ESAB INDIA.
>>Esab India was consolidating in rectangle channel pattern for 20 months. two weeks back it has given a breakout and retraced till its BZ.
>>Again last week it has took support from crucial pivot point and bounced back with a good healthy green candle along with good momentum.
>>Today this stock seems to continuing its bullish trend while overall market is being bearish. We can see from chart its consolidation phase was fairly long,
7th August Bank NiftyElliot wave. Bold/Experimental idea. You can try shorting (buying in the money PE) with 1-2 lots using the correct Pivot as per your intuition. Once BNf goes down below Pivot 4, a put option can give you 100 points profit in terms of option premium.
If BNf goes above Pivot 1, the Elliot wave does not hold true. 5th wave wont happen with proper momentum.
#BANKNIFTY… Looking good for this level#BANKNIFTY...
Intraday as well as swing trade
All levels given in charts ...
IF good potential seen then we work in options also
if activate then possible a good movement Keep eye on this ...
We take trade only when it activates...
Possible to give good target
TRADING FACTS
Panacea Biotec will repete the History ?Support and resistance levels: The key support levels are 107.81 The key resistance levels are 134.5.
stock has crossed the 50 day moving average on weekly chart.
first target 178.78 then we will move forward.
Disclaimer:
This is not investment advice. Please do your own research before making any investment decisions
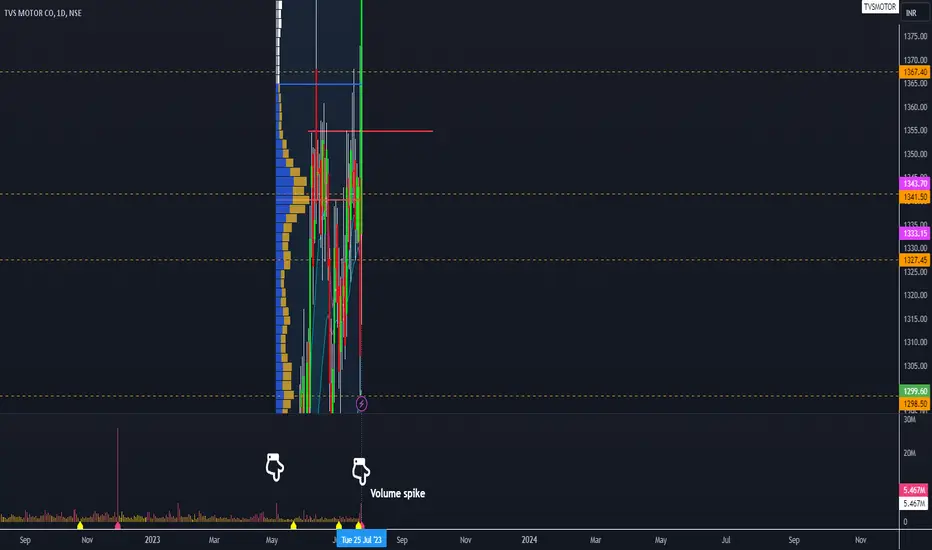
TVS Motor Stock Support and ResistanceUsing the Volume Profile Indicator to Find Support and Resistance in TVS Motor Stock
The volume profile indicator is a technical analysis tool that can be used to identify support and resistance levels. In this article, we will use the volume profile indicator to analyze the TVS Motor stock on the daily chart. We will identify the high volume nodes on the volume profile and consider these price levels as potential support and resistance levels. We will also provide some additional tips for usin
MEDPLUS Episodic Pivot Trade IdeaMEDPLUS had an episodic pivot and gave a good retracement near its previous support and now is clearly respecting its 50 day moving average which is a clear indicator of strength in the scrip. Good opportunity to go long.
*DISCLAIMER*
This analysis is only for educational purpose. I am not a SEBI Registered Analyst/Advisor. Please consult your financial advisor before taking any position and please use a Stop Loss for any Investments/Trading Positions. It is your hard earned money so give ris
BankNifty Trading Levels for 18th July 2023BankNifty Trading Levels - Resistance and Support
NSE:BANKNIFTY
Closing Price - 45449.75
Major Resistance - 46311
Neutral Zone - 45250 to 45650
Major Support - 44588
These levels are very rarely break and if it breaks in first 15 min and continues than we can see big move that day whichever side it breaks.
NOTE- This is only for educational purpose.
Please Give a LIKE and COMMENT. Thank you
#BTC 🟢 M15. Buy. (#BITCOIN)Range H4, within which the price has been moving stubbornly for more than three weeks.
After the enchanting liquidation of all longists by one hourly candle (who expected continued growth above 31K), an imbalance formed at the lower boundary of the H4 range, which I decided to take into work.
But he predicted the development of events for Monday, when all markets will be active and volumes will come in.
The long-awaited entry point, I did not expect that there would be an activation on the weeke
#AUDUSD 🔴 M15. Short (#AustralianDollar)The price approached the decision zone. The potential of the uncovered potential of the completed H4 range. We can try to trade on the correction.
Above the market opening price. (✔️)
Imbalance at the border of the potential of the completed range H4. (✔️)
Futures CFTC reports 🟢47736 / 🔴88942 (✔️)
Price under the First Seller of Exchange Options. (⚠️)
input: 0.68774
stop: 0.69007
tp-1: 0.68545
tp-2: 0.68085