Bank Nifty Weekly Outlook (20th Oct – 24th Oct 2025)The Bank Nifty ended the week at 57,713.35, gaining +1.95%, showcasing strong momentum and follow-through buying from lower levels.
🔹 Key Levels for the Upcoming Week
📌 Price Action Pivot Zone:
57,593 to 56,834 – This blue-shaded range remains the crucial zone to watch. Sustaining above this area may lead to further bullish expansion, while a drop below could invite profit booking.
🔻 Support Levels:
S1: 57,235
S2: 56,756
S3: 56,300
🔺 Resistance Levels:
R1: 58,195
R2: 58,678
R3: 59,052
📈
Pivot Points
Nifty 50 Weekly Outlook (20th Oct – 24th Oct 2025)The Nifty 50 ended the week at 25,709.85, gaining +1.68%.
🔹 Key Levels for the Upcoming Week
📌 Price Action Pivot Zone:
25,630 to 25,791 – This blue-shaded range will act as the critical zone. A breakout or breakdown from this area may determine the next directional move.
🔻 Support Levels:
S1: 25,391
S2: 25,073
S3: 24,730
🔺 Resistance Levels:
R1: 26,033
R2: 26,355
R3: 26,715
📈 Market Outlook
✅ Bullish Scenario:
If Nifty sustains above the pivot zone high of 25,791, buyers may take contro
EUR/USD Buy Setup 📊 EUR/USD Buy Setup – Resistance Turned Support at 1.16469
EUR/USD has broken above the key resistance level at 1.16469, which is now acting as support. The price is currently showing signs of holding above this level, indicating a potential bullish continuation.
🔹 Trade Idea:
Looking to buy around 1.16469, expecting the support to hold.
🎯 Target (TP): 1.16753
🛑 Stop Loss (SL): Just below the 1.16469 support zone
🔍 Technical Reasoning:
Breakout and retest of previous resistance
Support hol
Pilani Investment and Industries Ltd – DailyMarket Structure:
Price is currently in a bullish market structure, forming a series of higher highs and higher lows after breaking previous internal structure. The recent pullback appears to be a retracement into a discount zone, aligning with potential demand area.
Point of Interest (POI):
A clear demand zone is visible around ₹5,200–₹5,300, where price previously showed strong bullish reaction. Current price action suggests liquidity sweep below recent equal lows before potential mitigation.
Max Healthcare – Impressive Earnings, Fragile TechnicalsMax Healthcare Institute shares have slid sharply, closing near ₹1,069 with heavy selling volume. On the Elliott Wave front, price appears to have completed Wave W at 1,060 after a clean five-wave decline. With RSI deeply oversold, a relief rally in Wave X could unfold, but the larger structure still favors another leg down into Wave Y , with the major demand zone around 980–940 in focus.
The overhead resistance supply zone near 1,120–1,140 remains the key cap for any bounce. Unless
Gold Futures - Daily swing chart has not swung up23/9 High volume 262,918 sign of selling and high of 3824.6
Weekly swing : 200% of previous swing range = 3806.8 which equals $17.8 over resistance level.
Not even 1/2 % over resistance level.
The high volume and doing 200% of previous could be a sign sell off for a reaction to the 50%. We have not even tested the 50% of the daily swing ever lone the test of the weekly 50%.
Friday 26/9 High 3814.4 with lower volume and only $1.8 over the high of 24/9. Note 25/9 was an inside day so this day is
Trend Continuation or Breakdown? Technical Analysis OverviewThe chart has formed a symmetrical triangle pattern, which has taken shape over approximately 270 days. This pattern was recently broken, and a new support level has emerged around 713.
If the 713 support fails to hold, the next potential downside targets are 703, 695, and 685.
However, it's important to note that the stock remains in a broader upward trend, as illustrated by the ascending channel. As long as the price stays within this channel, any pullback toward the lower boundary could pr
Will Fibonacci Levels Hold? Key Areas to WatchThis chart combines price action with key Fibonacci retracement and extension levels to anticipate potential support or reversal zones. Price is currently testing the crucial 0.618 retracement (24,801.50) after a notable downward move. RSI is also reacting near its own significant levels, aligning with both 0.618 on the downside (37.8) and the 1.414 extension (70.6) on the upside. Watch for reactions at these levels for clues on whether price will bounce or continue to the next fib zone, especia
Gold Market Analysis: September 20, 2025Gold (XAU/USD) continues its remarkable bullish run in 2025, driven by persistent geopolitical tensions, central bank buying, a weakening US dollar, and expectations of further Federal Reserve rate cuts. As of today, the spot price stands at approximately $3,685 per ounce, marking a 1.06% increase from the previous day and a staggering 40.47% year-over-year gain. This follows a 26% rise in the first half of the year and nearly 41% year-to-date, with the metal recently touching an all-time high n
Nifty 50 Analysis as of September 19, 2025~ Technical Analysis ~
Trend Overview: Nifty 50 remains in a broader uptrend, trading within a broken descending channel on the 4-hour chart. It has held above the key psychological support of 25,000 for most of September, but a corrective fall is possible if it breaches 25,250-25,000. Resistance is clustered around 25,400-25,850, with a potential breakout targeting 26,000-26,300.
Key Levels:Support: Immediate at 25,200 stronger at 25,000. A drop below 25,000 could accelerate bearishness toward
TdPowerSystem - Inverted Head & ShoulderTD Power Systems secured a ₹67 crore export order for traction motor components. This order is for delivery between 2026 and 2027
Inverted Head and Shoulder pattern. Pivot points plotted. Head would be ideal target. Right shoulder low would be long term stoploss.
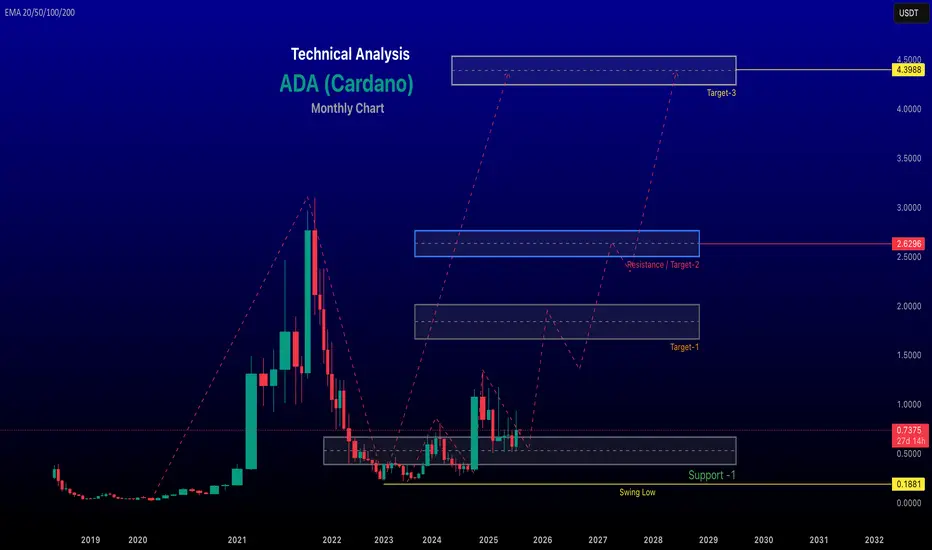
ADA TECHNICALThe current price of Cardano (ADA) in Tether (USDT) is approximately 0.88 USDT, based on recent data from Coinbase. In the last 24 hours, the price has increased by about 3.86%, with a high of 0.89 USDT and a low of 0.83 USDT. Over the past week, the exchange rate has risen by 16.11%, and over the past year, ADA's value has grown by 62.03% against USDT.
Chart For the reference
~~ Disclaimer ~~
This analysis is based on recent technical data and market sentiment from web sources. It is for inf
Bank Nifty Weekly Insights: Key Levels & TrendsThe Bank Nifty ended the week at 55,149.40, slipping -0.35%.
🔹 Key Levels for the Upcoming Week
📌 Price Action Pivot Zone:
55,032 to 55,267 – This blue-shaded range is the key area to watch. A breakout on either side could decide next week’s trend direction.
🔻 Support Levels
S1: 54,679
S2: 54,207
S3: 53,739
🔺 Resistance Levels (From Chart):
R1: 55,621
R2: 56,093
R3: 56,564
📊 Candle Observation:
The weekly candle was a strong bearish red candle with both upper and lower shadows. This shows th
Nifty Weekly Outlook: Holding the Line or Breaking Below?The Nifty 50 ended the week at 24,870.10, gaining +0.97%.
🔹 Key Levels for the Upcoming Week
📌 Price Action Pivot Zone:
24,792 to 24,949 – This is the critical zone to watch. A decisive move beyond either side may dictate next week’s trend.
🔻 Support Levels
S1: 24,553
S2: 24,236
S3: 23,936
🔺 Resistance Levels
R1: 25,187
R2: 25,505
R3: 25,887
📊 Candle Observation:
The last weekly candle formed a red body with a long lower shadow, showing that although bears dominated early in the week, strong
Natural gas analysis Monthly Time frameNatural gas markets are influenced by a complex interplay of supply, demand, weather, geopolitical events, and technical factors. Below is a concise analysis based on recent trends and data as of August 24, 2025, covering key aspects of the natural gas market
Price Trends and Market Dynamics
Spot and Futures Prices: The Henry Hub spot price recently fell from $2.92/MMBtu to $2.81/MMBtu, and the September 2025 NYMEX futures contract dropped from $2.828/MMBtu to $2.752/MMBtu. The 12-month future
Learn & Trade: Nifty StrategiesDaily Nifty chart setups, insights, and detailed trade ideas. Follow for real-time analysis and educational tips—ideal for new and experienced traders looking to learn disciplined market strategies.”
2. “Sharing structured Nifty setups, key trading zones, and transparent trade planning. Join in for actionable analysis, risk management techniques, and a supportive learning environment for all traders.”
3. “A platform dedicated to simplifying technical analysis and real-world trading. Expect cle
EID Parry - Inverted Head and Shoulder - BullishEID Parry is one of the top fundamental company in sugar industry. And EID parry is among the Murugappa group of companies. One should watch Murugappa group of companies. They are all very good.
Seeking to curb carbon emissions, India aims to increase the share of ethanol in gasoline to 20 percent by 2025-26, from 13 percent -14 percent now. Indian sugar mills such as E.I.D.-Parry Balrampur Chini Mills Shree Renuka Bajaj Hindusthan and Dwarikesh Sugar have increased their ethanol production cap
renderwithme | ADA Technical Analysis Monthly Chart"Riding the Cardano wave! #ADAUSDT poised for a breakout—targeting $0.81 and beyond! #CryptoTrading"
~ Disclaimer ~~
This analysis is based on recent technical data and market sentiment from web sources. It is for informational \ educational purposes only and not financial advice. Trading involves high risks, and past performance does not guarantee future results. Always conduct your own research or consult a SEBI-registered advisor before trading.
# Boost and comment will be highly apprec
Bank Nifty Weekly Insights: Key Levels & TrendsBank Nifty ended the week at 55,617.60, registering a decline of -1.61%.
🔹 Key Levels for the Upcoming Week
📌 Price Action Pivot Zone:
55,501 to 55,736— This critical range should be monitored for potential trend continuation or reversal. A breakout on either side could determine directional bias.
🔻 Support Levels:
Support 1 (S1): 55,148
Support 2 (S2): 54,679
Support 3 (S3): 54,187
🔺 Resistance Levels:
Resistance 1 (R1): 56,092
Resistance 2 (R2): 56,565
Resistance 3 (R3): 57,057
📈
Nifty 50 at a Turning Point? Key Levels & Market Outlook AheadThe Nifty 50 ended the week at 24,565.35, registering a decline of -1.09%.
🔹 Key Levels for the Upcoming Week
📌 Price Action Pivot Zone:
24,487 to 24,644 – This range is crucial for identifying potential trend continuation or reversal. A move outside this zone could set the directional tone for the coming sessions.
🔻 Support Levels
Support 1 (S1): 24,254
Support 2 (S2): 23,942
Support 3 (S3): 23,680
🔺 Resistance Levels
Resistance 1 (R1): 24,880
Resistance 2 (R2): 25,196
Resistance 3 (