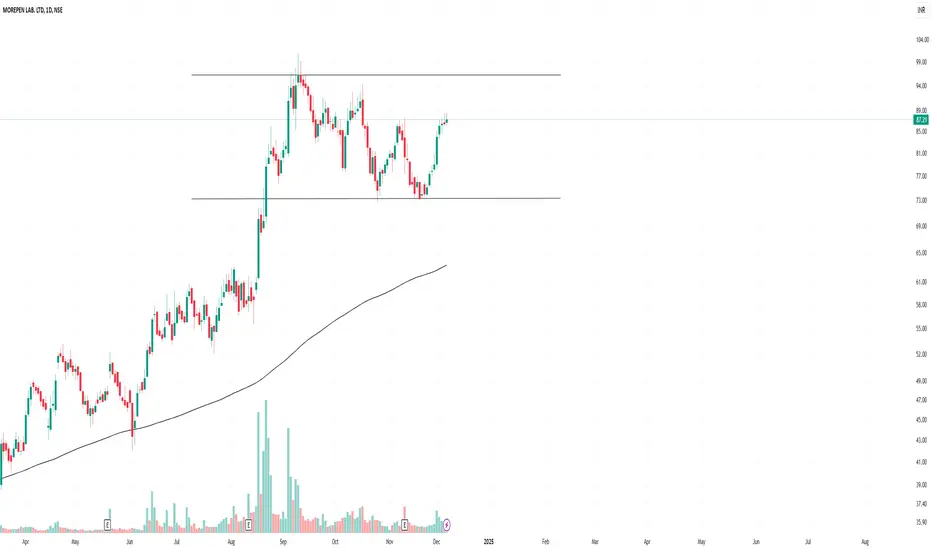
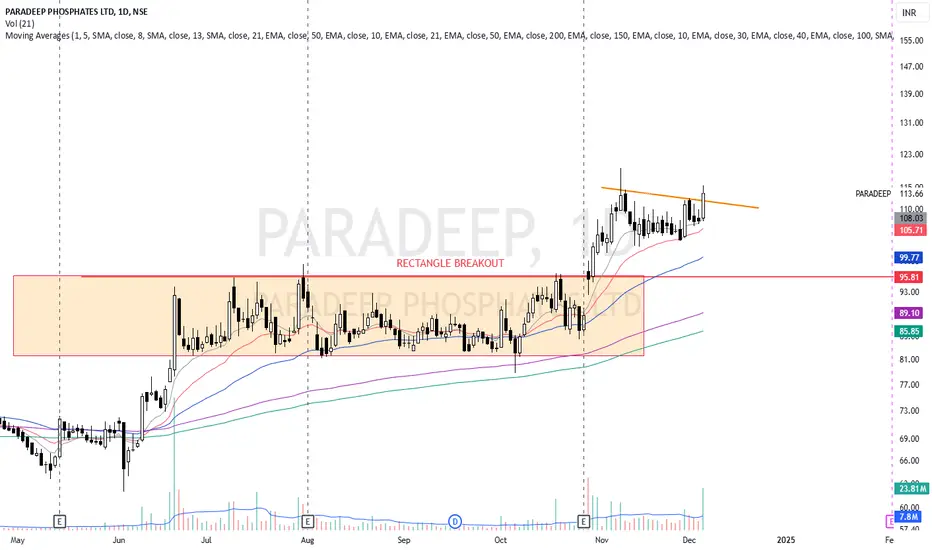
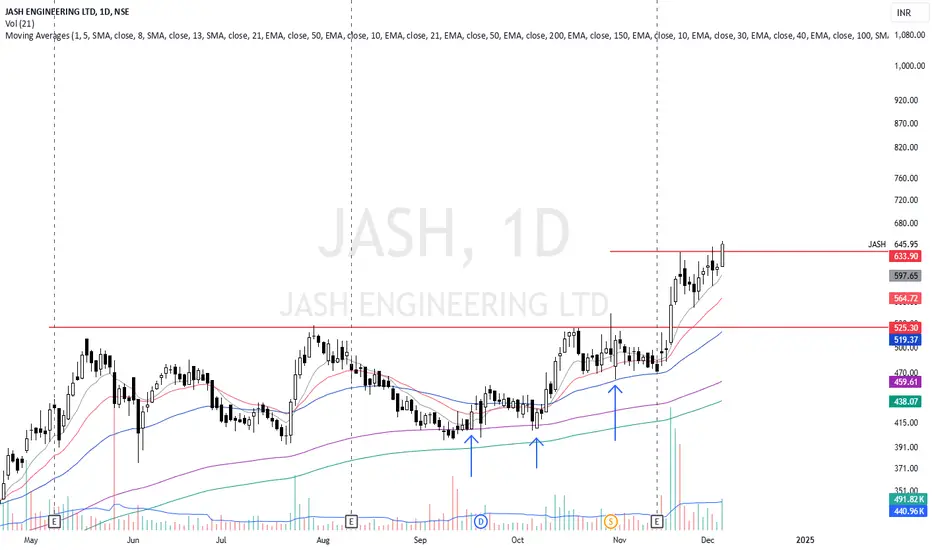
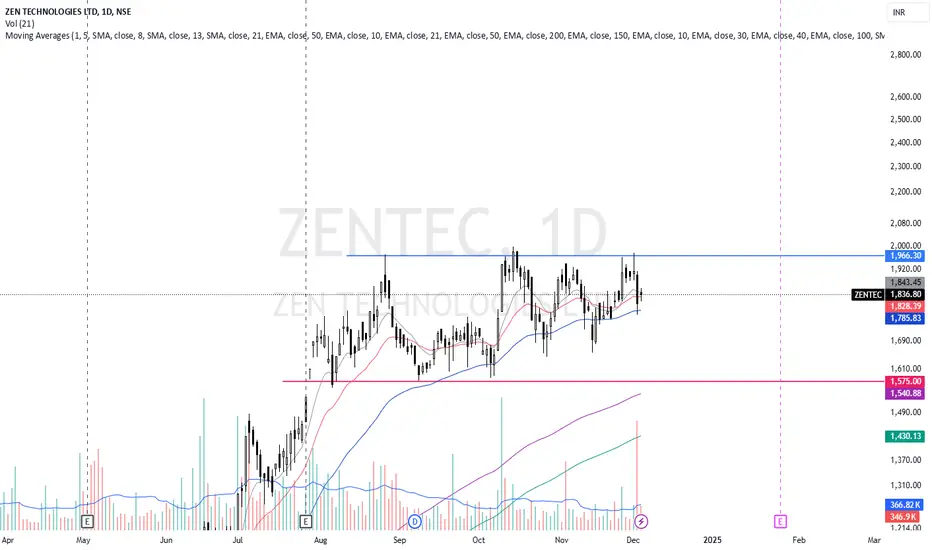
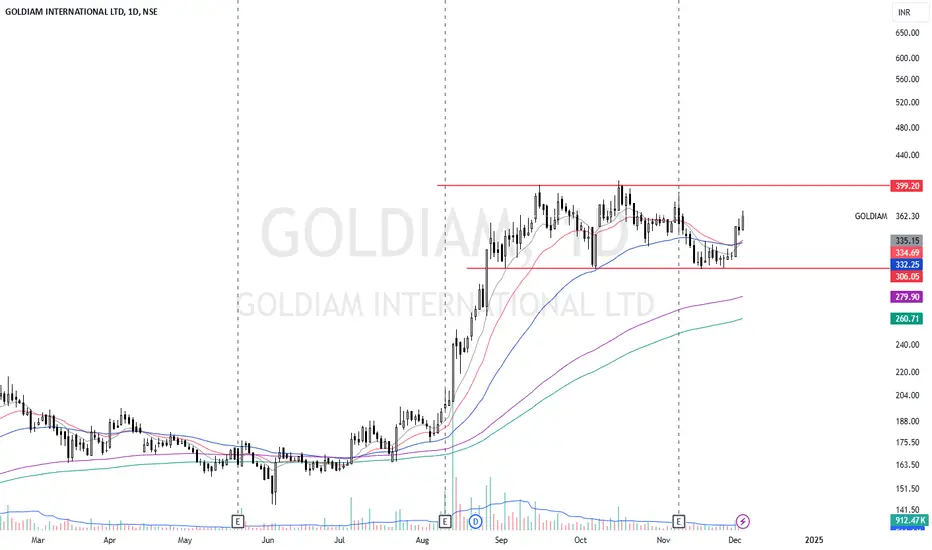
Morepenlab consolidation breakout above 95 tgt-120++morepen lab currently consolidating in a range
last six qoq profits are good
it took support around 70-75 once close above 95 can make a good move
Disclaimer- Just my view and opinion trade at your own risk not an investment advice
these are only for educational purposes
Rectangle
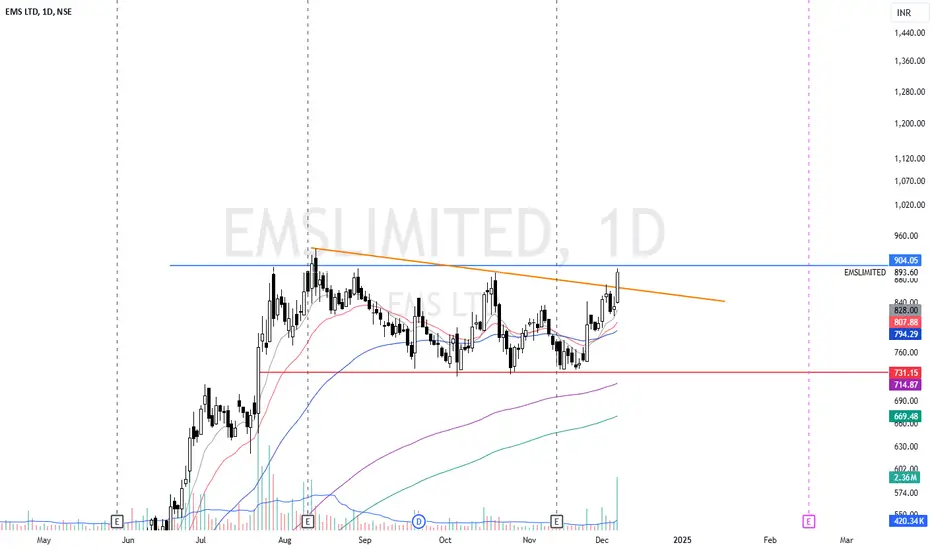
OFSS watch for a breakout of Base.Good pattern.
-Trying to break out of the box.
-Inverse H&S on DTF
-Narrow range inside candles on DTF.
-Dry volume
Breakout traders wait for a breakout of the base. Positional traders can look for building positions given in the chart.
The view and chart are shared just for educational purposes. Please do your research before investing.
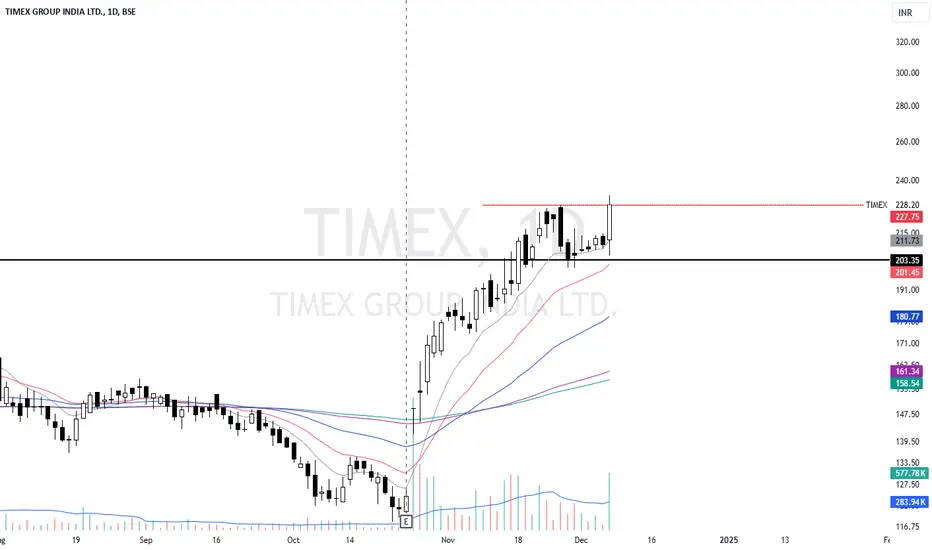
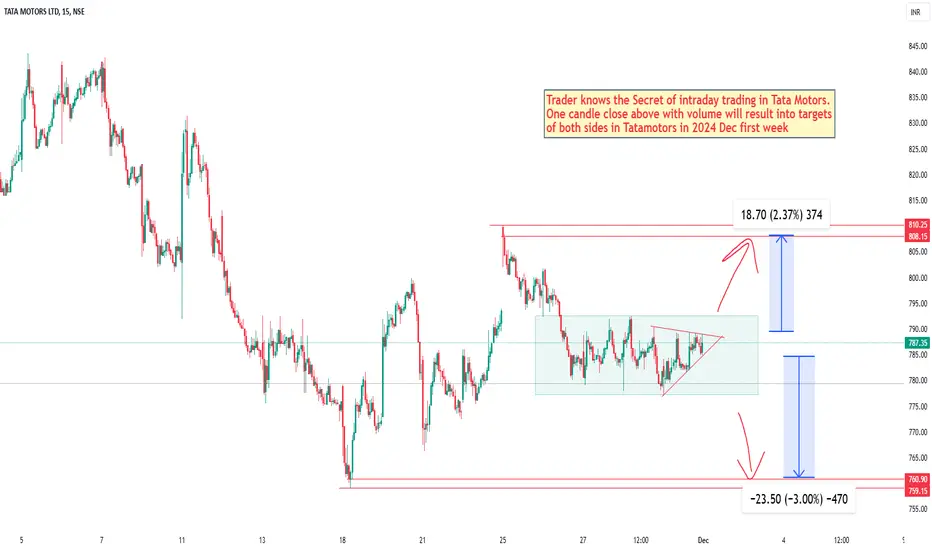
Tata Motors Intraday Ideas for December first wek 2024hi! this is Kapil,
Traders know the Secret of intraday trading in Tata Motors.
One candle close above with volume will result into targets
of both sides in Tata motors in 2024 Dec first week.
Disclaimer - Before making any actual investment or trading decisions, it is strongly recommended that you consult a qualified broker or financial advisor.
Lyka Labs Ltd. 155 [LYKALABS]– Rectangle Pattern (2.5 Years)
1. Rectangle Pattern Overview
- Formation Details:
- The stock exhibits a 2.5-year rectangle pattern, a classic consolidation pattern indicating indecision between buyers and sellers.
- The resistance is clearly identified at ₹160, with multiple failed attempts to breach this level.
- The support zone lies between ₹135-₹140, reflecting consistent buying interest at these levels.
- Significance:
- This prolonged consolidation signifies accumulation, often a precursor to a significant b
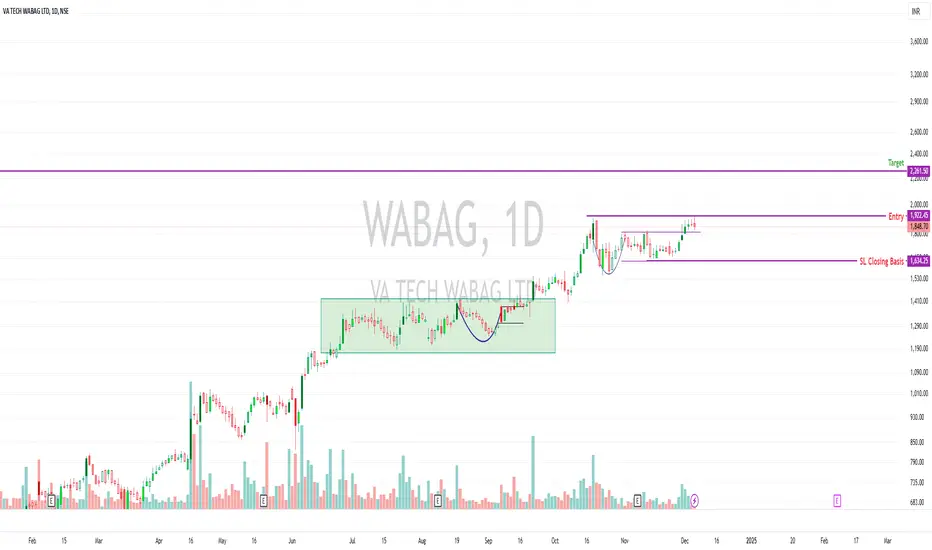
Prajindustries All set for a breakout?
✅Bullish Engulfing from support levels.
✅Good Volume
✅Dry volume when pulling back.
✅Trading above Key DMAs.
❗️Positional SL is very deep(20%)- Adjust SL as per your appetite and position sizing technique.
Position sizing is very important if you are building positions.
Aggressive trader's SL after the breakout is 761 closing basis.
The view is personal. Please do your due diligence before trading. This is not a buy-sell recommendation.
We missed the ideal entry when the stock broke out
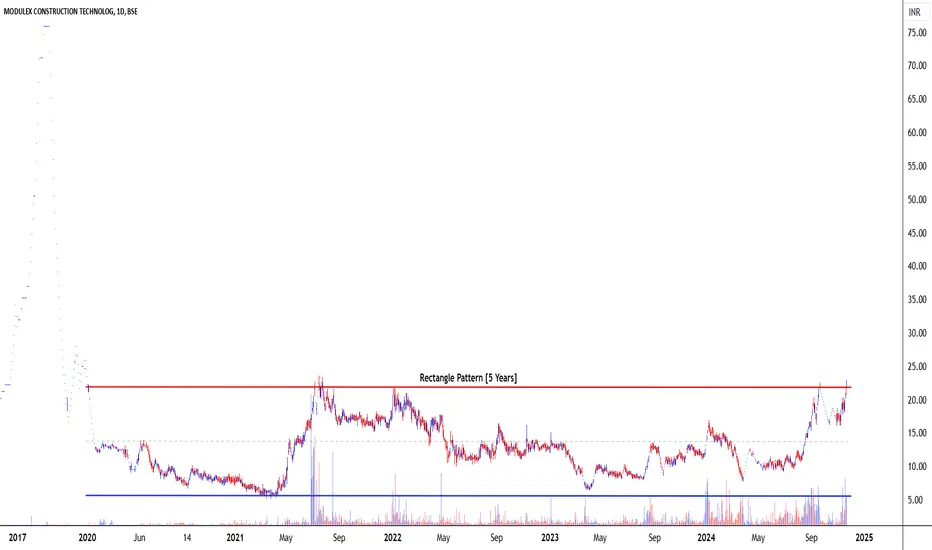
Modulex Construction Technologies Ltd. Based on Rectangle Patter
1. Pattern Analysis
- Rectangle Pattern:
- Timeframe: 5 Years
- Description: The stock has formed a rectangle pattern, with a well-defined resistance at ₹24 and support at ₹8. This long-term consolidation suggests significant accumulation and potential for a substantial breakout.
- The breakout above ₹24 signals a shift in sentiment, with the potential to transition into a strong bullish phase.
2. Volume Analysis
- Volume Behavior:
- Volume remained subdued during the consolidati
Kiri Industries Ltd. Based on Rectangle Pattern Breakout1. Pattern Analysis
- Rectangle Pattern:
- Timeframe: 8 Years
- Description: The stock exhibited a prolonged consolidation within a rectangle pattern, with a well-defined resistance at ₹640 and support at ₹240. This extended period of consolidation reflects equilibrium between buyers and sellers over a long duration, indicating a potential for a significant move once the breakout occurs.
- The breakout above ₹640 signals a strong bullish trend, breaking the resistance level after years of
Maruti Interior Products Ltd. [SME] Based on Rectangle Pattern B
1. Pattern Analysis
- Rectangle Pattern:
- Timeframe: 2.5 Years
- Description: The stock was trading within a well-defined rectangle pattern, bounded by ₹70 (support) and ₹130 (resistance). This prolonged consolidation indicated indecision in the market, with neither bulls nor bears gaining dominance. The breakout above ₹130 marks the conclusion of this range-bound phase and signals the beginning of a potential upward trend.
2. Volume Analysis
- Volume Behavior:
- During the consoli
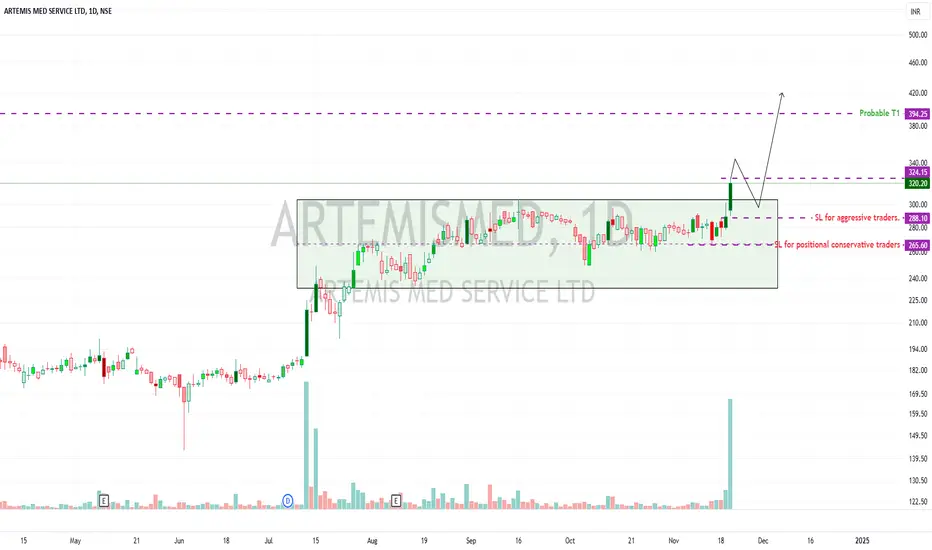
Artemismed broke out of base. Long opportunity...
- Good volume
-Trading above key DMAs.
-Group movement in the pharma and healthcare sector.
Safe traders:
Wait for a retest or add 30-50% now and add the rest after the retest. SL 265 closing basis. Deep SL. So position sizing and risk management are imperative.
Risk per trade is Around 18%
RR: 1:1.2
Aggressive traders:
Can try going long above today's high ( 324.5) with SL below today's breakout candle closing basis.
Risk : 11.2%
RR: 1: 2
This is just a view about how to approach