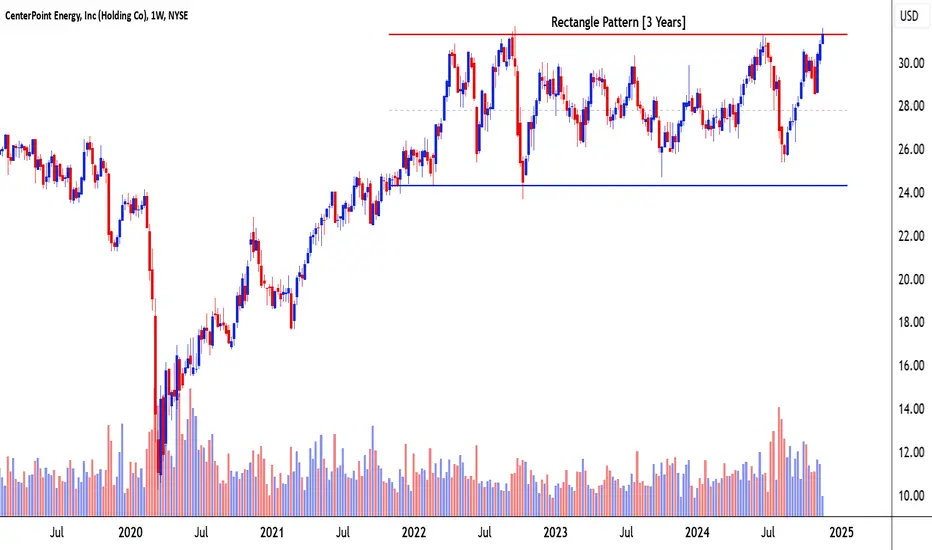
CenterPoint Energy Inc. Based on Rectangle Pattern
1. Pattern Analysis
- Pattern: Rectangle Pattern
- Timeframe: 3 Years
- Description: CenterPoint Energy has been trading in a well-defined Rectangle pattern with horizontal resistance at $31.50 and support at $24.00. This extended consolidation phase reflects a balance between buyers and sellers. The stock has recently approached the upper resistance, indicating the possibility of a breakout, which could signify the start of a new bullish trend.
2. Volume Analysis
- During the Recta
Rectangle
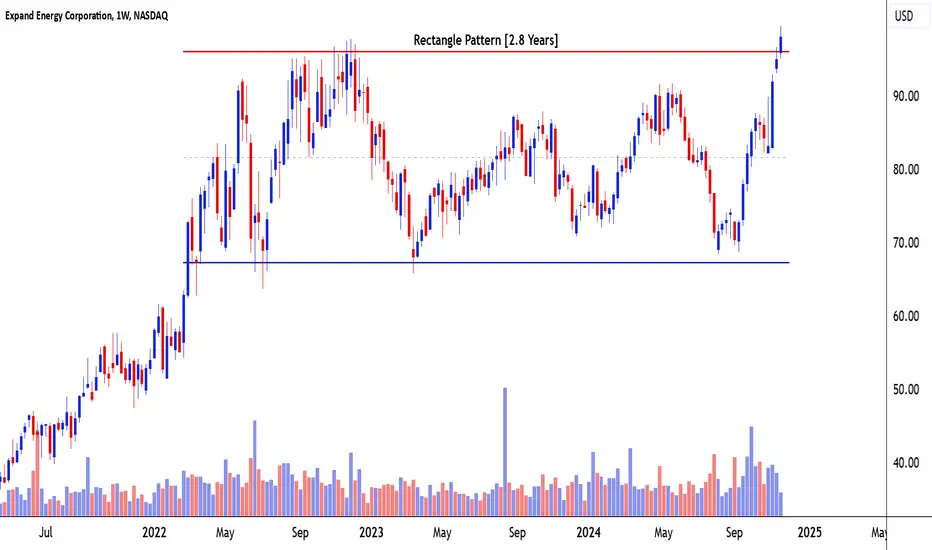
Expand Energy Corporation Based on Rectangle Pattern
1. Pattern Analysis
- Pattern: Rectangle Pattern
- Timeframe: 2.8 Years
- Description: Expand Energy Corporation has been trading within a well-defined Rectangle pattern, with horizontal resistance at $98 and support at $68. This prolonged consolidation phase represents a balance between buyers and sellers, with neither side dominating. The recent breakout above $98 signifies a potential end to this consolidation and the start of a new bullish trend.
2. Volume Analysis
- During the
Asian paints Funda and 2021 to 2024 distribution TGT-below1600technically from 2021 to 2024 asian paints has seen distribution i think by now smart money has already exited
Asian Paints
last all quaters has profits around 1100-1200 cr
This quater 694 cr which is very massive dip in profits
current p/e 52
sector p/e 47
i think asian paints is now no longer market leader
so considering these profits constant for next three quaters also then
keeping P/e also constant at 50 stock fair price would be 1600 where eps is taken as 32 (Trailing Twelve month
LOKA HUGE BULLISH MOVE IS COMING! $LOKA is preparing for nasty move as it did in past after Binance Listing.
Currently trading around 0.20 having support around 0.18 multiple times, indicates bullish movement at any time.
Target could be 0.25, 0.28, 0.35 and more.
LLong
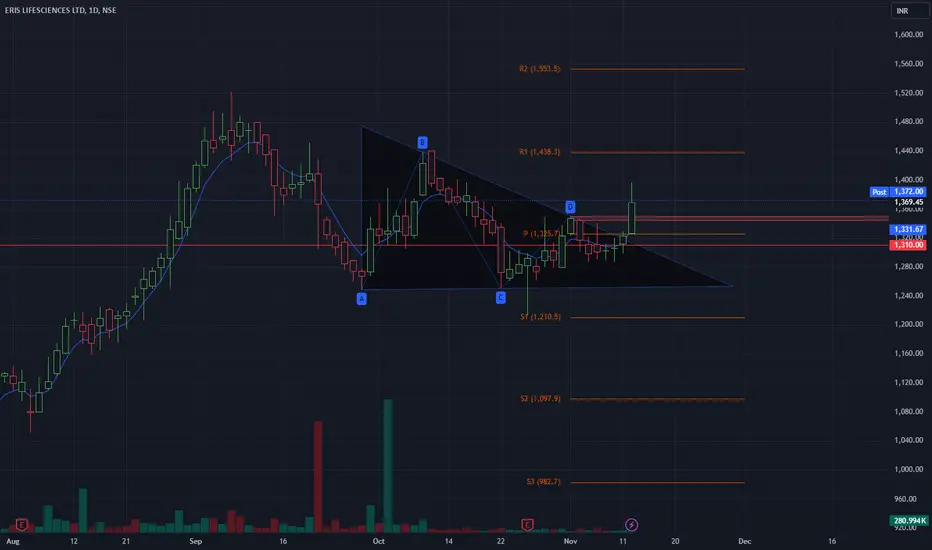
Horizontal Breakout in ANANADRATHI NSE:ANANDRATHI
#ANAND RATHI WEALTH LTD (1D Chart)
Trend: The stock is in an uptrend.
View: Bullish
Structure: The chart shows a potential upward move, as it is forming a strong horizontal resistance zone and a breakout of 4300+ will give us a good momentum move and once it sustain above the level on day closing basis We can carry it for swing also
Entry: 4,300+ Don't enter in spike wait for 5 min candle close.
Risk: previous swing low level marked on chart Stoploss Level: 3,987 (Red Line
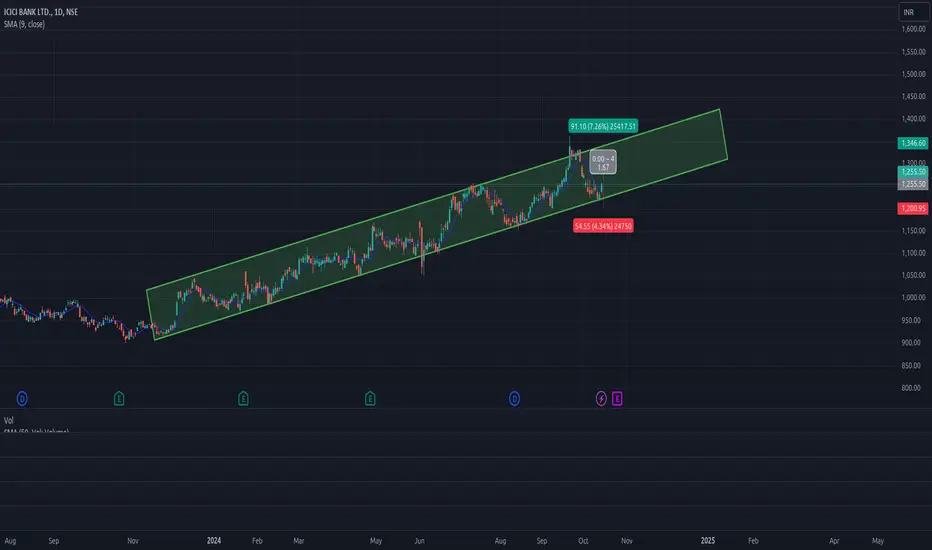
ICIBANK: Swing: 1D 16-Oct'24ICIBANK: Swing: 1D 16-Oct'24
ICICI Bank is trading in a channel (marked) for the last several months and is in a uptrend. ADX is 21 (>20).
The ADX slope is -ve but seems like the slop is reducing and will turn positive in the coming days.
The stock hit the bottom of the channel on 11-Oct24 with a red candle and then on 14-Oct'24 bounced back with green candle. Ideally the close of the 14-Oct'24 candle should have been our buy price but on 14-Oct'24 the stock was trading below 9 SMA
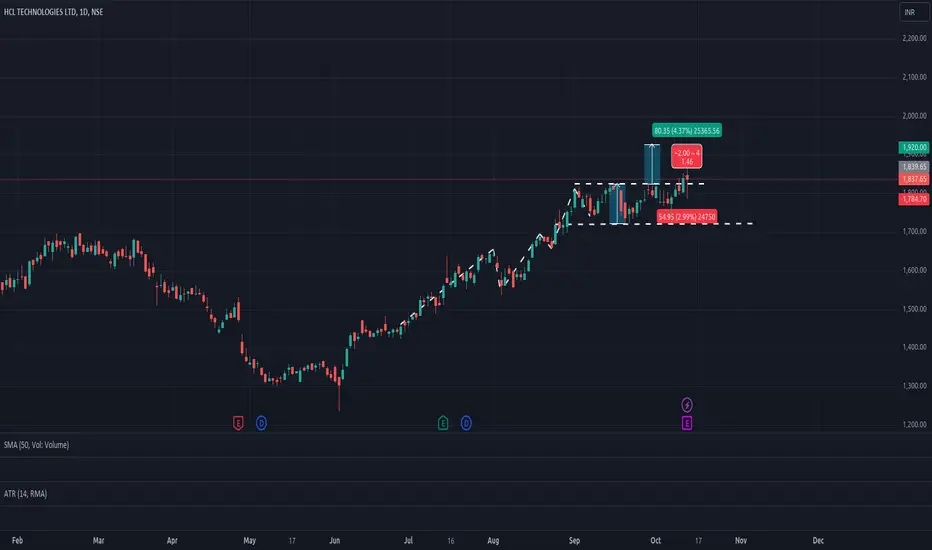
HCLTECH: Swing: 1D 14-Oct'24HCLTECH: Swing: 1D 14-Oct'24
Stock has been in an uptrend since around 27-Jun'24
Starting 02-Sep'24 the uptrend has paused and the stock has been trading in a range. Marked on charts. ADX ~ 17 also confirms range bound trade
The stock broke the trend on 11-Oct'24 with volumes greater than 50 SMA.
The stock has taken support at 9 day SMA. It also crossed over it just 2 days ago. All +ves
Entering long @ 11-Oct'24 close 1839.65
Target = Trading range height + resistance = 102.85 +
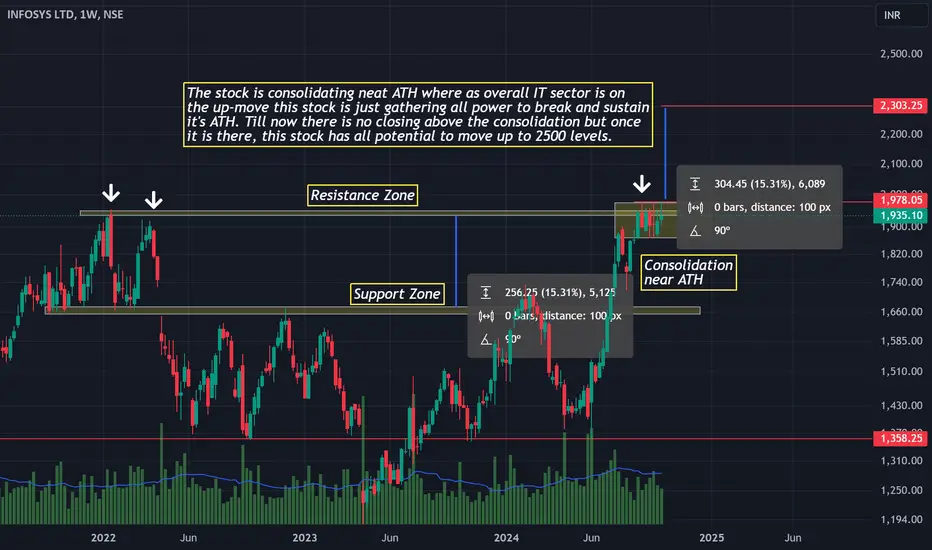
INFY: Consolidation near ATHThe stock is consolidating neat ATH where as overall IT sector is on the up-move.
This stock is just gathering all power to break and sustain it's ATH.
Till now there is no closing above the consolidation but once it is there, this stock has all potential to move up to 2500 levels.
DISC: The publication idea is just a technical analysis and should not be considered a buy or sell recommendation. Please consult your financial advisor before taking any trade.
Stock Opportunity: Reliance Consolidation BreakoutBack in December 2023, Reliance gave a major breakout after a 2-year consolidation period and has since rallied 23%. Currently, the stock is trading near its previous breakout level, from which it reversed three times in the past, signaling a potential opportunity for further upside.
However, investors should be cautious as the stock is trading below its 200 EMA on the daily timeframe. While the fundamentals remain strong, it's essential to keep an eye on technical levels and manage risk accord
Stock Opportunity: Geojit Finance LtdHey everyone! 🌟
Geojit Finance Ltd. has recently given a multiyear breakout and is now in a phase of range contraction. What's interesting is that volume is dropping, which is typically a healthy sign of consolidation.
On top of that, the fundamentals look strong and the company is expected to deliver a good quarter ahead, which could further fuel its momentum.
Here's what we’re watching for:
📉 Volume contraction – Signaling reduced selling pressure.
📊 Potential breakout – Keep an eye out fo
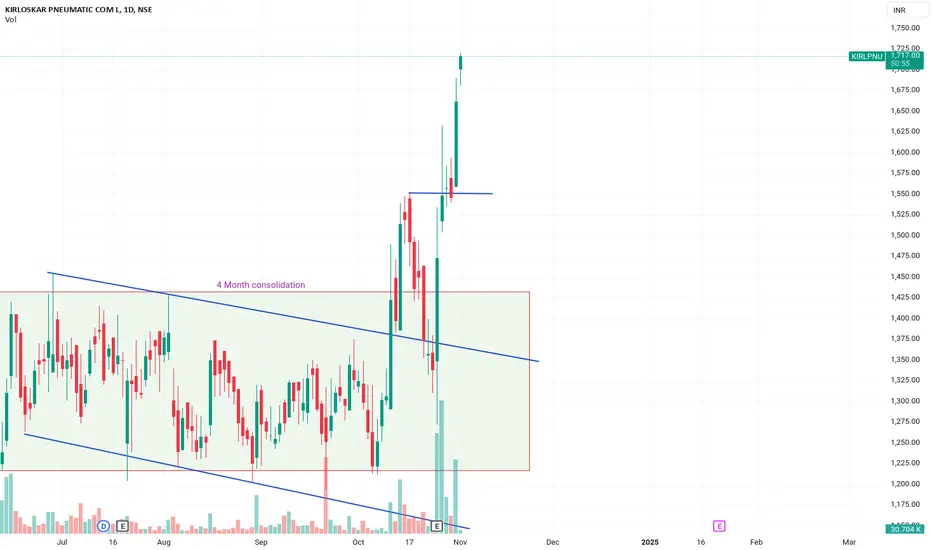
COLPAL RANGE BREAKOUT WITH MASSIVE VOL A range breakout occurs when the price of a stock moves outside a defined range of support and resistance levels. This can signal a potential trend change or continuation, depending on the direction of the breakout. Here are some key points to consider:
Identifying a Range
Support and Resistance: Identify the horizontal levels where the price has repeatedly bounced off (support) and where it has faced resistance.
Consolidation: Look for a period where the price moves sideways within these level
Rectangle Channel Breakout - VESUVIUS INDIAOverview of Company :
The company's products include shaped refractories like shrouds, stoppers, pre-cast products, nozzles, and crucibles. It also includes unshaped refractories like castables and taphole clay. It also offers repair and maintenance services for its refractories.
Technical Aspects to be learned from this chart :
1. This stock price formed Rectangular channel pattern from almost more than 5 months.
2. Stock gave a powerful breakout with bullish candle closing above 52W ind
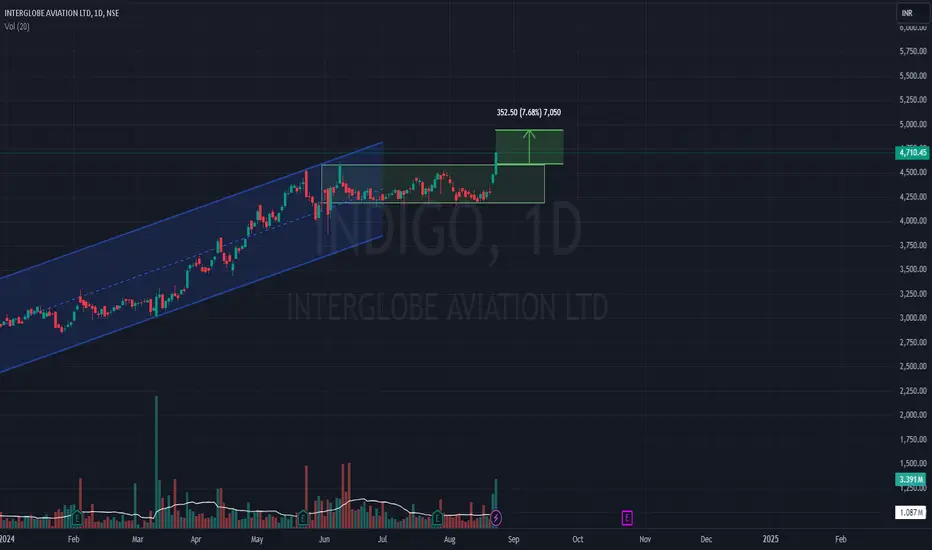
Indigo - Box Breakout Indigo - Box Breakout
Disclaimer:-
This is only for educational purposes. The author is neither a registered stockbroker nor a registered advisor and does not give investment advice. His comments are an expression of opinion only and should not be construed in any manner whatsoever as recommendations to buy or sell a stock, option, future, bond, commodity, index, or any other financial instrument at any time.
Asian Paints - Consolidating beautifully !!!Asian Paints is a large cap stocks and a market leader in paint industry. It has been consolidating beautifully, and we can see it moving towards ATH. Other factors:
1. RSI is improving
2. Steady volumes showing consolidating in a range
3. High delivery ratio from quite some-time
4. TTM topline and profitability is second best as compared to prior years
5. DIIs have increased stake
"Cleaneasycharts"
Learning & Earning!!!
Cheers!!!